ABSTRACT
ALFARIS, FARIS EBRAHEM. Modular Static Controller for Large-Scale Distributed Renewable Energy Resources. (Under the direction of Dr. Subhashish Bhattacharya).
Driven by environment constrains, power systems requirements, oil availability and cost uncertainty, the electrical energy generation and delivery is moving into a new era of design and operation. In this era, the renewable energy resources plays a pivotal role in electricity supplying through widespread installation of distributed generation (DG) among grid-tied (transmission or distribution networks) and micro-grid (MC) power systems. Therefore, the governments’ energy departments have forced the power system developers to rethink their considerations and polices in the aspects of designing and operating the electrical power grids.
The distributed renewable energy generation (DREG), which are relied on photovoltaic (PV) solar arrays, fuel cells, wind and hydro turbines, are characterized by their low operation cost and low air pollution (as recommended by the environmental protocols). However, the high penetration and intermittent nature of these resources inevitably poses undeniable challenges to be integrated to the existed electrical power networks, especially in case of weak power systems. These challenges include the frequency stability constraint, due to the absence of the physical inertia, voltage variation at the point of interconnection (POI) and power quality issues.
solutions to overcome the aforementioned dynamic difficulties to allow more renewable energy resources accommodation.
This thesis investigates the dynamic performance of the recent proposed power converter based solutions to integrate Large-Scale distributed renewable resources (DRR) with higher power system stability and higher power quality. These solutions include the Convertible Static Transmission Controller (CSTC), Integrator Factor Controller, Modified Backstepping Controller and Active Power Double-line frequency Suppression. The CSTC system is a unique configuration developed from the Flexible AC transmission systems (FACTS) family, and it is installed across a power transformer. This thesis investigates the utilization of the CSTC for renewable resources integration.
In the same context, the potential impact of integrating a high fluctuating DREG on the dynamic performance of an actual weak medium-voltage power network is addressed, and the consequential harms on the attached loads are highlighted. Motivated by the observed dynamic difficulties, a shunt power electronic based versatile controller, named as Modular Static Distribution Controller (MSDC), is developed to significantly enhance the injection of the DREG, in particular, a wind farm into an actual weak power system. The MSDC shows the ability to improve the injected power quality in order to meet the technical specifications required in grid codes. The key feature of the MSDC device, besides its own functionalities, is the flexibility of the point-of-interest allocating, unlike the dc-ac interface power conditioning systems (PCS), where the power converters are permanently attached to the DRRs, to draw the electric power.
considering more efficient power switches in converter designing. These switches include the high voltage high frequency wide band gap (WBG) devices, particularly the Silicon Carbide (SiC) based semiconductor switches such as 15kV SiC IGBTs and 10kV SiC JBS diodes. In this thesis, different SiC-based power converter topologies for the use in Battery Energy Storage System (BESS) are investigated as a building block of the MSDC system.
Motivated by the technical issues of the investigated power electronic topologies, and in sake of improving the overall aptitude of the MSDC, rather than manipulating the power switches, an alternative power inverter topology is investigated for performing the MSDC powertrain. This inverter was developed from the family of the current source inverters (CSI), which is the Current-Fed Quasi Z-Source Inverter (CF-qZSI). The CF-qZSI has been selected carefully for this purpose based on the technical features, as well as, the buck/boost and bi-directional operation capability. First, the feasibility of utilizing the SiC switches for the CF-qZSI inverter implementation is validated by comparing its performance with the traditional powertrain converters. These power train converters include SiC-based conventional boosted-VSI, bidirectional normal CSI and Si-based CF-qZSI. Second, the control scheme of the CF-qZSI for the grid-tie configuration is developed and tested. Third, the device dynamic impact is evaluated when used to facilitate the integration of an actual PV solar farm into a low-voltage power network.
Modular Static Controller for Large-Scale Distributed Renewable Energy Resources
by
Faris Ebrahem Alfaris
A dissertation submitted to the Graduate Faculty of North Carolina State University
in partial fulfillment of the requirements for the degree of
Doctor of Philosophy
Electrical Engineering
Raleigh, North Carolina 2019
APPROVED BY:
_______________________________ _______________________________ Dr. Subhashish Bhattacharya. Dr. Mesut Baran
Committee Chair
ii DEDICATION
This work is dedicated to my family:
Ebrahem and Norah: Father and Mother
Ghadeer: Beloved wife
Adeeb and Abdulaziz: Great sons
And to all my brothers and sisters
iii BIOGRAPHY
iv ACKNOWLEDGMENTS
First and foremost, all thanks and praises to God (ALLAH) for providing me with the power and patience to have this work accomplished
My heartfelt gratitude goes to my PhD advisor Prof. Subhashish Bhattacharya for his generous support and supervision. Prof. Bhattacharya’s deep knowledge and great enthusiasm have been very inspirational to my research and development at North Carolina State University. He taught me how to conduct research independently and think out of the box. I hope to be privileged to benefit from his mentorship and collaboration throughout my future career.
I am grateful to my committee members, Prof. Mesut Baran, Prof. Leonard White, and Prof. Ramon Collazo for their valuable suggestions and helps.
I acknowledge the FREEDM systems center, the ECE department at the North Carolina State University, and NSF global research center for funding my research. I also appreciate the assistance from the staff members of the FREEDM Systems Center and the ECE department.
Financial assistance from Saudi Arabian Cultural Mission (SACM) in the form of research assistantship is gratefully acknowledged. Also, I would like to take this opportunity to express my heartfelt gratitude and sincere appreciation to King Saud University for affording me a full scholarship for the PhD degree, so I would like to gratefully acknowledge their support.
I would like to express my gratitude to all friends at NC State who have been helpful and have encouraged me during this period.
v TABLE OF CONTENTS
LIST OF PUBLICATIONS ……….………....……… viii
LIST OF FIGURES ……….……….……. ix
LIST OF TABLES ………..……….…. xv
Chapter 1. Introduction ……….…………....… 1
1.1 Background ……….……….……….……..…... 1
1.2 Research Motivations and Objectives ………...…………...…... 3
1.3 Thesis Contributions and Layout ………..…..….... 5
Chapter 2. Background and Literature Survey ……….………...….… 7
2.1 Introduction ………...…... 7
2.2 Renewable Energy Resources based Distributed Generation ………...….…. 7
2.2.1 Interface of High Power Rating Distributed Renewable Generations ………….…. 11
2.2.2 Technical Challenges and Power Quality Issues due to the Integrations of Distributed Renewable Energy Generations …………...……. 13
2.2.3 Power Quality Enhancement based on Power Electronic Systems ………...…..…. 16
2.3 Projects and Future Targets of Large-Scale Distributed Renewable Energy Generations Equipped with Battery Energy Storage Systems (BESS) …………....……. 25
2.3.1 Global 2030 Renewable Energy Targets …………...………..…. 25
2.3.2 An Example of On-going Large-Scale BESS-based Distributed Renewable Energy Generation Projects (South Korea) ………...… 29
Chapter 3. Dynamic Modeling for Different Configurations of the Convertible Static Transmission Controller ………..….... 32
3.1 Introduction ………..… 32
3.2 Objectives ………..…..…. 34
3.3 Dynamic Model of the CSTC ……… 35
3.4 Control Strategies ……….…… 39
3.4.1 Common Direct Controller ………..… 39
3.4.2 PI Controller Tuning ………...…….… 40
3.4.3 Integrator Factor Control (IFC) ……….…...… 41
3.4.4 Modified Backstepping Control (MBSC) ………....… 42
3.5 Validation of the Proposed Transient Model ……… 44
3.6 Summary ………..………… 48
Chapter 4. Advanced Control Strategies for Convertible Static Transmission Controller Enabled Dual Active Power Filters and PV-Power Integration …...…… 49
4.1 Introduction ………..……… 49
4.2 Objectives ………...…… 51
4.3 DC-Link Dynamic Model ……….……...…. 53
4.4 Solar Radiation and PV Array Model ……… 54
vi
4.5.1 DC Link Controller and Source Current Filter ……….…… 57
4.5.2 Power Controller with Transformer Current Filter and Power Factor Correction ... 59
4.6 Stabilized DC Voltage under Unbalanced AC Grid ………..……… 62
4.7 Validation of the Applied Controllers ………...… 63
4.7.1 System Configuration and Solar Farm Actual Field Data ……….…...… 63
4.7.2 Simulation of Different Case Scenarios ………...… 66
4.7.3 AC Current and DC-Link Voltage ……….…..… 69
4.7.4 DC Link Voltage Under SLG Fault Condition ………....… 73
4.8 System Algebraic Model ……….……..…… 74
4.9 Summary ………..… 79
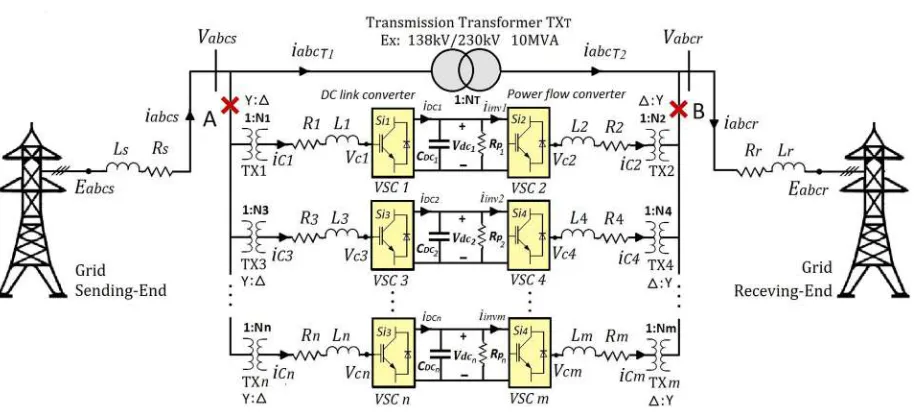
Chapter 5. Modular Static Distribution Controller for Distributed Energy Resource Generation Applications ………..……….……….… 81
5.1 Introduction ………..……… 81
5.2 Objectives ………..……...… 83
5.3 System Configurations ………..…...…… 84
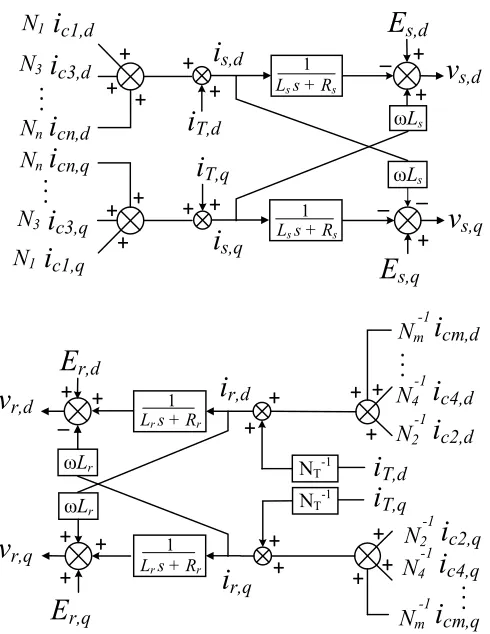
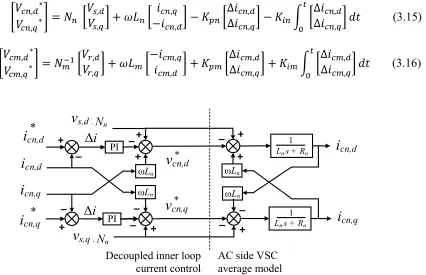
5.4 Modular Static Distributed controller ………...……… 86
5.4.1 Operation Principle and Dynamic Model ……… 86
5.4.2 Converters Design Considerations ………..……….……… 87
5.5 Control System Design ………...……..…… 88
5.5.1 DC-DC Control System ………...………… 88
5.5.2 DC-AC Control System ………...…....… 89
5.6 Simulation Analysis ………..…....…… 95
5.6.1 Validation of the Power System Model ………...……….…… 95
5.6.2 MSDC Dynamic Response Test ………...…… 97
5.6.3 MSDC Dynamic Impact Evaluation ………..…..…… 98
5.7 Summary ………..…..… 101
Chapter 6. A Current-Fed Quasi Z-Source Inverter with SiC Power Modules for EV/HEV Applications ………...…...…… 103
6.1 Introduction ……….……...… 103
6.2 Objectives ………... 107
6.3 VSI and CSI Design Guidelines ……….….… 107
6.4 Current-Fed Quasi Z-Source Inverter ………...….. 111
6.4.1 SVPWM Control Strategy ……….… 111
6.4.2 Circuit Analysis ……….…… 113
6.4.3 Inductors Current and Capacitors Voltage Ripples ……… 117
6.4.4 AC Output Voltage and Current ………...… 120
6.5 Simulation Analysis ………....… 123
6.5.1 Circuit Parameters and Case Scenarios ……….….… 123
6.5.2 Voltage Step-up and Step-down Capability ………...… 125
vii 6.5.4 Impact of High Switching Frequency on Z-Network Voltage and
Current Ripples ………...….………...133
6.5.5 Total Harmonic Distortion (THD) of the Output Voltage and Current ……….… 134
6.5.6 Power Loss Comparison ……… 139
6.6 Summary ………..………….. 141
Chapter 7. Current-Fed Quasi Z-Source Inverter based PV Distributed Generation Controller ……….... 143
7.1 Introduction ……… 143
7.2 Objectives ………...……… 146
7.3 CF-qZSI Based Distribution Controller ………..……… 147
7.3.1 Operation Principle and Dynamic Model ………..…… 147
7.3.2 Inverter Design Considerations ……….….… 149
7.4 System Configuration ……….… 150
7.5 Control System Design ………...… 152
7.5.1 Supervisory Control Loop ……….….… 152
7.5.2 Inner Control Loop ………....… 155
7.5.3 Synchronization Module ………...….… 155
7.6 Simulation Analysis ………....… 157
7.6.1 Power System Model Validation ………...…… 157
7.6.2 CqZDC Dynamic Response Test ………..….… 157
7.6.3 CqZDC Dynamic Impact Evaluation ……….… 160
7.7 Summary ………..…..……….……...… 163
Chapter 8. Controller Hardware-In-the-Loop Test and Real-Time Validation of the CF-qZSI based Distributed Generation Controller .………..…………..… 165
8.1 Background and Objectives ……… 165
8.2 Controller Hardware-In-the-Loop (CHIL) Set-up ……….………. 166
8.3 Excremental Results ………...… 167
8.4 Summary ……… 173
Chapter 9. Conclusion and Future Work ……….………...… 174
9.1 Conclusions of the Present Work ……….………...… 174
9.2 Contributions ……….………...… 178
9.3 Future Work ………..………..… 180
Bibliography ……….……...………...… 183
viii LIST OF PUBLICATIONS
Most of the work that achieved in the dissertation was published in the following publications: Journal Publications:
F. E. Alfaris and S. Bhattacharya, "Control and Real-Time Validation for Convertible Static Transmission Controller Enabled Dual Active Power Filters and PV Integration," in IEEE Transactions on Industry Applications, vol. 55, no. 4, pp. 4309-4320, July-Aug. 2019.
Conference Publications:
F. Alfaris, A. Alzahrani and J. W. Kimball, "Stochastic model for PV sensor array data," 2014 International Conference on Renewable Energy Research and Application (ICRERA), Milwaukee, WI, 2014, pp. 798-803.
F. E. Alfaris and S. Bhattacharya, "Convertible static transmission controller model and supervisory vector control for operation under unbalanced grid conditions," 2017 IEEE Energy Conversion Congress and Exposition (ECCE), Cincinnati, OH, 2017, pp. 4806-4812.
F. E. Alfaris and S. Bhattacharya, "Advanced control strategies for convertible static transmission controller enabled dual active power filters and PV-power integration," 2017 IEEE Industry Applications Society Annual Meeting, Cincinnati, OH, 2017, pp. 1-7.
F. E. Alfaris and S. Bhattacharya, "A current-fed quasi Z-source inverter with SiC power modules for EV/HEV applications," 2017 IEEE Energy Conversion Congress and Exposition (ECCE), Cincinnati, OH, 2017, pp. 5445-5452.
M. Alharbi, F. E. Alfaris and S. Bhattacharya, "A novel current control strategy for a back-to-back HVDC applications under unbalanced operation conditions," 2017 IEEE Energy Conversion Congress and Exposition (ECCE), Cincinnati, OH, 2017, pp. 1263-1269.
F. E. Alfaris, N. Yousefpoor and S. Bhattacharya, "Modular Static Distribution Controller for Distributed Energy Resource Generation Applications," 2018 IEEE Energy Conversion Congress and Exposition (ECCE), Portland, OR, 2018, pp. 5857-5864.
ix LIST OF FIGURES
Figure 2-1. Emerging of distributed generation in different power networks in the
modern power plant …………..………...……….……….… 7 Figure 2-2. Network connection of DG units in grid-connected and micro-grid
operation modes …………..………...………...… 8 Figure 2-3. Classification of DG resources and technologies …………...……… 9 Figure 2-4. Prediction of the energy resources utilization in the Unites States. (a) different energy resources, (b) renewable energy resources (red) is for geothermal,
(grey) is for biomass and (brown) is for waste [18] …………...………..… 10 Figure 2-5. Configuration of a distribution network integrated a distributed renewable
resource with an interface stage and control circuit ………....……….………....… 12 Figure 2-6. The impact of the DREG on the power network and other attached DG units ....… 16 Figure 2-7. Configuration and connection of common FACTS devices …………..………..… 18 Figure 2-8. The UPFC characteristics. (a) phasor diagram, (b) P-Q operation range …...…..… 19 Figure 2-9. Configuration and different mode connections of the CSTC system ……...…....… 21 Figure 2-10. Configuration and different mode connections of the distributed generation
controller used for enhancing the PV system integration ………….……..……..… 23 Figure 2-11. Total investment needed by 2030 for the renewable energy targets
(in USD billion) [20] ……….………...… 27 Figure 2-12. The renewable energy implementation plan for South Korea government
by 2030 [55] ……….……… 28 Figure 2-13. The renewable energy capacity needed toward 2030 renewable targets in
South Korea [59] ………….……….… 30 Figure 3-1. The Convertible Static Transmission Controller in different configuration modes...33 Figure 3-2. The Convertible Static Transmission Controller in shunt-shunt
configuration with parallel BTB-VSC systems ………...………...….. 35 Figure 3-3. The transient model of parallel BTB-VSC systems with collected
currents in d-q reference frame for: (Top) rectifying side converters and
(Bottom) inverting side converters ………...………....… 38 Figure 3-4. The transient model of: (Top) DC-link circuit and (Bottom) power transformer .... 38 Figure 3-5. Implementation of the decoupled current controller (rectifier side) ………..…..… 39 Figure 3-6. Step response of VSC2 currents with different inner loop current
controller PI parameters ………...……… 41 Figure 3-7. Integrator Factor Control structure in d-q synchronous frame to generate
the reference vectors for the dc-link voltage controller converter ………..…….… 43 Figure 3-8. Modified Backstepping Control structure in d-q synchronous frame to
generate the reference vectors for the dc-link voltage controller converter ...…..… 43 Figure 3-9. The schematic diagram of the switching pulse width modulator control
x Figure 3-10. CSTC system performance (in pu) with a change in the reference active power command of converter2 from zero to 0.5 pu and -0.4 pu of converter4, while
the reactive power references changes from 0 to 0.2 pu at 1.0 s ………...… 46
Figure 3-11. DC-Link voltage under line-to-ground fault at AC network (points A and B) ....… 47
Figure 3-12. Active power of the DC-link converter under line-to-ground fault at points A and B ……….………...… 47
Figure 4-1. The Convertible Static Transmission Controller system with parallel converters in shunt-shunt configuration mode and renewable energy source …..… 50
Figure 4-2. Solar radiation power based on Meinel and Meinel model (base power=1kW/m2) ..55
Figure 4-3. Equivalent circuit of a photovoltaic solar cell ………...…….….. 56
Figure 4-4. Implementation of the decoupled current controller (rectifier side) ……..……..… 57
Figure 4-5. Controller implementation of the AC to DC converter with harmonics reduction of the source current ………..………...… 58
Figure 4-6. Power factor correction controller ………...………..…...… 61
Figure 4-7. Controller implementation of the AC-DC converter ……..………...……...… 61
Figure 4-8. Schematic diagram of the Pulse-Width- Modulation circuit ……...…………...… 61
Figure 4-9. Phasor diagram of the inverter and receiving-end voltage bus ………...… 62
Figure 4-10. Convertible Static Transmission Controller system with PV-integration and non-linear load …….………..…..… 63
Figure 4-11. RTDS simulation facility (for controller and system validation) ………….…....… 64
Figure 4-12. Actual solar radiation power (base power=10 MW) ……….………...… 65
Figure 4-13. System performance with change in VSC1 and VSC2 current and power references (Case 1) ………….………...… 67
Figure 4-14. System performance with change in VSC1 and VSC2 current and power references (Case 2) …….………...… 70
Figure 4-15. System performance with change in VSC1 and VSC2 current and power references (Case 3) ……….………..… 70
Figure 4-16. Receiving-end voltage and the corresponding transformer current …….……...… 71
Figure 4-17. Phase-a of VSC2 current (consist of injected power and harmonic compensation components) ……….………..……..…… 71
Figure 4-18. DC-link voltage during Case 1 and Case 2 …….………...… 72
Figure 4-19. Rated DC link voltage under SLG fault at secondary side of the transmission transformer with and without using the proposed control strategy ... 73
Figure 4-20. (0.75 pu) DC link voltage under SLG fault at secondary side of the transmission transformer with and without using the proposed control strategy ... 74
Figure 4-21. Algebraic model of the studied system …….………....… 75
Figure 4-22. Receiving-end and transformer active power with respect to VSC1 active power and receiving-end interface inductance (PPV = 0 pu) …………...…….…… 76
xi Figure 4-24. Sending-end active power with respect to VSC1 active power and
receiving-end interface inductance (PPV = 0 pu or Ps=Pr ) ……….… 77
Figure 4-25. Sending-end active power with respect to PV active power and receiving-end interface inductance (PVSC1 = 0 pu or Ps=PT) ……...… 78
Figure 4-26. Sending-end real power versus real power of PV-source and VSC1 (at Xr=0.3 pu) ……….………..……… 78
Figure 5-1. Annual growth of the global renewable energy capacity since 2000 [92] …..….… 81
Figure 5-2. Average inertia constant for different generation turbines [96] …………..…….… 83
Figure 5-3. Single line diagram of the BPA actual power system ……….……… 85
Figure 5-4. An example of the MSDC system configuration at the POI bus …..…………...… 87
Figure 5-5. Detailed model of the dc-dc chopper converter ……… ……….… 87
Figure 5-6. Control circuit of dc-dc converter ………..………..… 89
Figure 5-7. ω-P, U-Q droop curves of ωU-droop controller …………..……….…...… 92
Figure 5-8. Control circuit of the dc-ac converter ………..……… 94
Figure 5-9. Process flow of the proposed MSDC system ……..………...………..… 94
Figure 5-10. Injected power form WF1 and WF2 (black) actual data and (blue) simulation results ………….………...….… 95
Figure 5-11. Comparison of system actual data (black) and simulation model results (blue) ….. 96
Figure 5-12. Dynamic performance test of the MSDC ……….………....… 97
Figure 5-13. Injected real power into the POI bus. (blue) with no control, (black) with using MSDC and (red) is the reference power signal ………….………..……….… 99
Figure 5-14. Power factor and injected reactive power of bus #6 during PFCC mode. (blue) with no control and (black) with using MSDC ………….………….…....… 99
Figure 5-15. THD of current and voltage at Bus 6. (blue) with no control and (black) with using MSDC ………….………...… 100
Figure 5-16. RMS line voltage at the POI bus during the VDC operation mode. (blue) with no control and (black) with using MSDC …….……….….… 100
Figure 5-17. Reactive power injected into the POI bus during the VDC operation mode. (blue) with no control and (black) with using MSDC ……….………....… 100
Figure 5-18. Frequency response of the POI bus voltage under sudden change in the injected real power ……….……… 101
Figure 6-1. Circuit diagram of 2010 Prius power control unit [103] …………..…………..… 103
Figure 6-2. DC-DC converter side of the 2010 Prius engine [103] ……..………...….… 104
Figure 6-3. Voltage and current fed Z-source inverters utilized for EV/HEV power applications [109] ………...………..….… 105
Figure 6-4. EV/HEV Inverter topologies investigated in this chapter …..……… 108
xii Figure 6-7. Transition states of the bi-directional CSI during motoring mode.
(The dot lines represent the same waveforms but with different duty ratios) ….… 110 Figure 6-8. Traditional and modified SVPWM used for conventional CSI and
current-fed qZSI ………...……….………...……….……… 113 Figure 6-9. Transition states of the current-fed qZSI during motoring mode ………..…….… 115 Figure 6-10. Transition states of the current-fed qZSI during motoring mode:
(a) active state, (b) short-zero state and (c) open-zero state ……….…………...… 116 Figure 6-11. Transition states of the current-fed qZSI during re-generation mode ……… 118 Figure 6-12. Voltage across the input inductor (L3) for the CF-qZSI ……….………....… 119 Figure 6-13. The ac voltage gain Vout/Vin versus active-state duty cycle period DA
and power factor cosθ operating in mode 1 ……….………...… 122 Figure 6.14. The ac voltage gain Vout/Vin versus active-state duty cycle period DA
and power factor cosθ operating in mode 2 …….……….……….….… 123 Figure 6-15. Dynamic performance of SiC CF-qZSI during the transition from case1 to
case2 at t=0.12 sec ………….……….…… 126 Figure 6-16. Dynamic performance of SiC CF-qZSI during the transition from case3 to
case4 at t=0.22 sec ….……….…… 127 Figure 6-17. Location of the case scenarios on the voltage gain versus duty ratios plot ….…… 128 Figure 6-18. Dynamic performance of SiC CF-qZSI during the transition from case1 to
case4 at t=0.2 sec ……….………...… 129 Figure 6-19. Output voltage and current of the SiC-based CF-qZSI during the transition
from case4 to case5 (by increasing Dop while Dsh=0) …….……….… 130 Figure 6-20. Dynamic performance of the SiC-base CF-qZSI during the transition from
case4 to case5 at t=0.4 sec. (step-change) ……….……….… 131 Figure 6-21. Input DC current of the SiC-base CF-qZSI during the transition from case4 to case5 at t=0.4 sec. (step-change) ….………….……….. 132 Figure 6-22. Dynamic performance of the SiC CF-qZSI during the transition from case4 to case5 at t=0.4 sec. (ramp-change) ……….……….… 133 Figure 6-23. Detailed System performance during case2: (Left) Si-based and current-fed
qZSI. (Right) SiC-based current-fed qZSI ……….………...… 134 Figure 6-24. Output phase voltage and output line current of the boosted-VSI during case2 .… 135 Figure 6-25. Potential harmonic contents for the output phase voltage and output line
current of the boosted-VSI and during case2 ……….……….… 135 Figure 6-26. Output phase voltage and output line current of the bi-directional CSI
during case2 ………..……….… 136 Figure 6-27. Potential harmonic contents for the output phase voltage and output line
xiii
Figure 6-28. Output phase voltage and output line current of the Si CF-qZSI during case2 ..… 137
Figure 6-29. Potential harmonic contents for the output phase voltage and output line current of the Si-based CF-qZSI and during case2 ………….………...… 137
Figure 6-30. Output phase voltage and output line current of the SiC CF-qZSI during case2 .... 138
Figure 6-31. Potential harmonic contents for the output phase voltage and output line current of the SiC-based CF-qZSI and during case2 ……….……….… 138
Figure 6-32. Conduction loss, switching loss and total system loss comparison among the studied topologies during motoring mode at 5kW output power, 20 A peak output current and unity power factor ……….………...… 139
Figure 6-33. Input inductor current ripple, input capacitor current ripple, output line current THD and system total power loss of the SiC-based CFqZSI versus the switching frequency during case4 ……….……….… 141
Figure 7-1. Configuration of the buck/boost bi-directional CqZDC at the POI bus ……..…… 148
Figure 7-2. LC-network currents during charging and discharging modes ……..……… 148
Figure 7-3. Open-state duty cycle and circuit loop currents versus shunt filter reactive power (Po = 0.5 pu, Vin=3kV, vo,L-L = 2.5kV,rms and unity output power factor) .. 151
Figure 7-4. Open-state duty cycle and circuit loop currents versus output real power (Qf =0.05 pu, Vin=3kV, vo,L-L = 2.5 kV,rms and unity output power factor) ……… 151
Figure 7-5. Single line diagram of the studied power system …………..……….… 152
Figure 7-6. ω-P, U-Q droop curves of ωU-droop controller …………...………..… 155
Figure 7-7. Process flow of the proposed CqZDC system …..….……….… 156
Figure 7-8. Control circuit of the CqZDC system ……..………..… 156
Figure 7-9. RTDS simulation facility (for controller and system validation) ..……….… 158
Figure 7-10. Dynamic performance at the POI bus (without using the CqZDC) …….……..… 158
Figure 7-11. Dynamic performance test of the CqZDC ……….……….… 159
Figure 7-12. Worst case injected real power into the POI bus (PS) ……….………… 160
Figure 7-13. Power factor of the power injected into the POI bus (PS) during the PFCC mode ……….………...… 160
Figure 7-14. Injected reactive power into the POI bus (QS) during the PFCC mode …..……… 161
Figure 7-15. Frequency response of THE POI bus voltage ……….……… 162
Figure 7-16. Line voltage of POI bus (Vs) during worst case ……….…….………… 162
Figure 7-17. Voltage and current THD at the POI bus …………...…………...………..… 163
Figure 8-1. The real-time controller hardware-in-the-loop simulation setup to verify the control structure of the CqZDC ………...…………..… 165
Figure 8-2. The practical sequence of designing and employing a power converters’ controller circuits using the Controller-Hardware-In-the-Loop test platform ....… 166
xiv Figure 8-4. Dynamic performance (in per unit) of the CqZDC when the reference value
of the reactive power has a step change, with disconnecting the PV-system ……. 169 Figure 8-5. Worst case scenario of the PV power injected into the POI bus ………..……….. 170 Figure 8-6. The active power generated by the CqZDC during the APSC mode …....……..… 170 Figure 8-7. Power factor of the injected power into the POI bus ……….………..… 171 Figure 8-8. Line voltage of the POI bus (Vs) during the worst case ………..… 172 Figure 8-9. The reactive power generated by the CqZDC device during the VDC
operation mode during the worse voltage interval ………..… 172 Figure 8-10. Frequency performance of the POI bus voltage (4 hours interval).
xv LIST OF TABLES
Table 2-1. Overview on power quality issues [33] ………..… 15
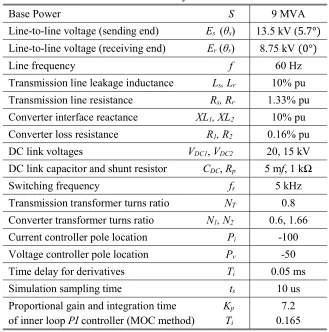
Table 3-1. VSC-CSTC System Parameters ………..……… 45
Table 4-1. Nomenclature of the shortcuts used in this chapter (chapter 4) ………….….…....… 52
Table 4-2. Operation Functions of the BTB-Voltage Source Converters ……….…...… 57
Table 4-3. VSC-CSTC System Parameters ………...… 65
Table 6-1. Considerations on Power Converters for EV/HEV applications ………...………… 106
Table 6-2. Bidirectional Boosted-VSI and CSI Governing Equations ………...… 111
Table 6-3. Truth Table for the Switching Pulse Generator Used for CF-qZSI ………..… 112
Table 6-4. CF-qZSI Governing Equations ……….… 121
Table 6-5. Parameters of the Electric Vehicle Traction System ……….… 124
Table 6-6. Different Test Cases for Simulation Analysis ……….………..… 125
Table 7-1. Inertia Constants for Different Generation Turbines [96] ……….…… 143
1 CHAPTER 1
Introduction
1.1 Background
In the recent decade, the electrical power systems follow an increasing trend of
decentralization, due to the increased deployment of distributed renewable energy generations
(DREG). Therefore, the traditional fossil fuel-based power grids are being replaced, partially or
entirely, by the distributed renewable resources (DRRs) based clustered networks. This essential
change in the electricity production sector is metamorphosing the century old paradigm of centrally
located facilities that producing electricity and sending it to consumers through transmission and
distribution networks [1,2]. This paradigm shift in the power system networks necessitates rapid
advancement in power electronics based system in order to efficiently meet the exigent need of
accommodating more DRRs into the power grids.
The distributed renewable resources, or the distributed generations (DGs) in general, help
in covering partial of the power demand, improving the power quality and maintaining the stability
of the transmission and distribution power networks [3], and as well known, the DREG are
characterized by the low carbon dioxide emission throughout the generation process, which
contributes in decarbonizing the electricity generation sector, therefore, it helps in reducing the
collective greenhouse gas (GHG) emission by 5.2%, as required by the Kyoto Protocol (UNFCCC,
1997). This protocol has been reinforced in 2005, and the follower member states have set out their
renewable energy targets accordingly [4]. The distributed renewable generation also enables
increased energy access by providing rural electrification and satisfying demand growth [3].
In the modern power systems, the renewable energy sources (RES) based distributed
2 aforementioned tasks, with keeping the existed conventional generators as a back-bone of the
overall generation system. On the other hand, the electricity can be generated by relying only on
the RES, as in micro-grid (MG) systems, where this type of systems are entirely segregated from
the conventional fossil-based generators based networks [5].
Based on the aforementioned, and due the multiplicity in the electrical power sources and
their managing approaches, the electrical power systems now a days are experiencing significant
modifications and changes in terms of planning and operation sectors. These changes include the
attaching of inconsistence power supplies, and merging large scale energy storage systems to the
power plants. Consequently, Nemours reports and studies discussed the technical influences of
these changes on the existed power plants, as discussed in [1], [2] and [6].
In a related context, different research centers, industrial development projects and
scientific studies are focusing on evaluating the proposed technologies related to the
accommodation of the DG in power systems, especially those which based on renewable energy
resources as in [7-9], in order to assure the reliability and security of these types of electricity
supplies. These research concerns are also involve the technical issues resultant from the
intermittency of the renewable energy resources, such as solar radiation and wind speed, besides
the non-deterministic patterns of the generated and consumed powers. Based on the above
mentioned studies, and other studies conducted on actual power systems as discussed in the
literature review, one of the biggest hurdles that impedes the secure investment of DRG in the
power grid infrastructure, especially in the US, is the penetration and low inertia nature of these
resources [10]. Therefore, scientific communities and research centers focus more on practical
3 resources. For example, facilitating the integration of the distributed energy resources (DER) is
becoming an important topic in the field of improving and designing the electrical power grids.
The recent advancement in the technologies of the power conversion systems, that interface
the DGs, and the wireless communications between power sharing nodes have noticeably enabled
the development of the DREG to overcome the dynamic issues that arised from the nature of the
RES type of electricity supplies. Henceforth, not only the distribution level networks are changing,
furthermore the system developers now are considering large-scale DRRs in producing a high
demand percentage of the electricity. In other words, the recent advancement in power electronic
systems plays a pivotal role in establishing a new game in power system designing and managing,
rather than changing the old game, which was focusing on the performance enhancement of the
existed electrical power networks.
1.2 Research Motivations and Objectives
In modern power grids, with low kinetic stored energy such as micro-grids, robust control
of power supplies and effective load sharing mechanisms are necessary to maintain the system
reliability and voltage/frequency stability. And from the load side point of view, power
disturbances and load changes should be accounted in order to ensure the power network
robustness [11]. In addition, power quality and power efficiency are significant parameters in
modern power grids, hence, numerous of supplementary power devices are utilized to enhance the
power quality, such as FACTS devices.
On the other hand, the increased deployment of large-scale renewable energy resources
considerably poses serious challenges to the stability and reliability of power networks, due to the
high intermitted and unsteady dynamic nature in the produced electricity power. In addition, the
4 amount of the injected power. Hence, improved flexible power compensating and power
conditioning devices are required to accommodate these changes in power networks.
Therefore, this research aims at broadly proposing an alternative power solutions to
overcome the aforementioned problems and to ensure safe facilitating and effective
accommodating of large-scale DREG. To this aim, different tasks and methodologies were adopted
in this work, in order to achieve the above objectives. These key tasks are:
1- Modeling the recently proposed flexible AC transmission controller, which is the
convertible static transmission controller, and using the obtained dynamic model to
improve the system supervisory control algorithm.
2- Evaluating the performance of convertible static transmission controller when it is used to
accommodate distributed renewable energy resource, to ensure efficient integration of
renewable energies and enhance the grid-connected power quality and efficiency.
3- Development of a versatile power conditioning system (PCS) to effectively manage and
compensate the line active power, to overcome the frequency oscillations, besides the other
FACTS functionalities. This task is adopted to improve the grid security, facilitate a safe
integration of distributed renewable generation and protect sensitive loads from frequency
variations.
4- Investigating the development of the same above mentioned versatile PCS based on the
current source inverter topology to improve the device performance and control
effectiveness. This task is considered due to the recent advancement in power electronic
5 1.3 Thesis Contributions and Layout
The remaining of this thesis is structured as follows:
Chapter 2 provides a background on distributed generation and power conditioning systems to
integrate the renewable energy resources to the power system. This chapter also discusses the
state-of-the-art power solutions, to facilitate the integration of distributed renewable resources. In
addition, this chapter shows a brief literature review on the present large-scale renewable energy
projects and targets.
Chapter 3 derives the dynamic model of the Convertible Static Transmission Controller (CSTC),
which is utilized to control the transmitted power through a power transformers and substations,
as well as, to accommodate distributed renewable energy resources.
Chapter 4 investigates the utilization of the CSTC as a power system to interface an actual PV
solar farm, and to operate as an active power filter to enhance the transmitted power quality.
Chapter 5 introduces the modular static transmission controller (MSTC) to facilitate the
integration of a fluctuated power from an actual wind farm. First, this chapter derives the transient
model of an actual transmission power system consisting of 12-bus and validates the model using
the actual data collected from real field. Second, the technical problems and power quality issues
as results of intermitted wind power are addressed. Third, a versatile power system is proposed to
overcome the dynamic problems. The performance of the overall system and the dynamic impact
of the proposed system are evaluated at the end of the chapter using the Real Time Digital
Simulator (RTDS).
Chapter 6 discusses different current-source inverter topologies to be used as alternative
topologies of the usual used voltage-source inverter in the applications of the bi-directional dc-ac
6
Chapter 7 seeks the capability of the Current Fed Quasi Z-source Inverter (CF-qZSI) to be an
alternative topology for power conditioning systems (PCS), which applied at the terminals of the
distributed renewable energy resources to improve their dynamic performances.
Chapter 8 proves the proposed control structure of the CF-qZSI, when it is utilized for the MSDC
system, through a Controller Hardware-in-the-loop (CHIL) platform test. For this purpose, the
Typhoon 602 and Real Time Digital Simulator (RTDS) were used to verify the validity of the
architecture and actual hardware ability of the proposed controller. Comparative study and
lab-scale experimental work are reported in this chapter to verify the proposed control scheme.
Chapter 9 draws the major conclusions and remarks for the present work, as well as, it highlights
the main key contributions that yielded by this dissertation. In addition, this chapter suggests
different opportunities and possible paths for future research work, based on the solutions that this
7 CHAPTER 2
Background and Literature Survey
2.1 Introduction
This chapter highlights the strategies for the distributed generations (DGs) and power
conditioning systems (PCSs) when empowered by renewable energy resources. It also discusses
the integration of high rating energy storage systems (ESS) to the DGs. In addition, and in order
to demonstrate the future trends in the green energy investment, this chapter introduces a literature
survey on several present large-scale renewable energy projects and targets across the world.
2.2 Renewable Energy Resources based Distributed Generation
In the early 1990s, the Distributed Energy Resources (DER), or generally called distributed
generation (DG), has significantly become power supply alternatives in advanced electricity power
G G G G
Conventional power Generators
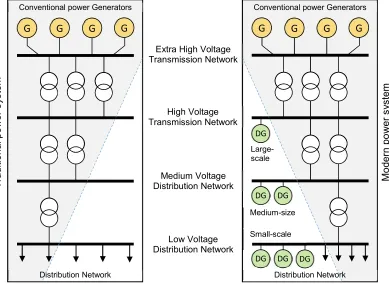
Distribution Network DG Large-scale Medium-size Small-scale
Extra High Voltage Transmission Network High Voltage Transmission Network Medium Voltage Distribution Network Low Voltage Distribution Network T ra di tio n a l p o w e r sy st em M o de rn p o w e r sy st em
DG DG
DG DG DG
G G G G
Conventional power Generators
Distribution Network
8 systems [12]. Figure 2-1 shows the types of DG connections in the modern power networks. The
DG has gained more attraction in the electricity sector since last decade, due to the technical
advancement in the electrical power generation and management, and the pivotal roles they play
amongst the power grid, such as the contributions in power grid total loss reduction, guarantee a
backup generation, enabling increased energy access and delivering power to rural areas [13].
Furthermore, the GDs are contributing in higher power grid reliability and quality during normal
grid operation, including power factor correction, providing the necessary compensation reactive
power to enhance the voltage profile and filtering the harmonics in the grid currents [3] and [14].
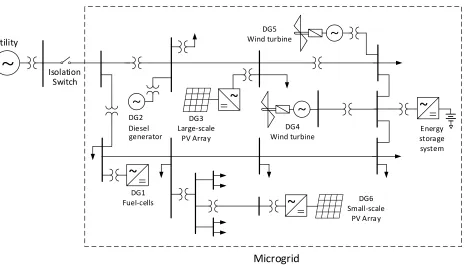
The distributed generations are also could appear as autonomous power systems, as in
Micro-grid operation mode, where a cluster of DG units are responsible of forming the distribution
network to supply the mounted loads, during the absence of the main utility supply. Figure 2-2
shows an example of a micro-grid operation mode, when the isolation switch is opened.
~
~
~
~
~
~
~
DG6Small-scale PV Array DG3
Large-scale PV Array
DG4 Wind turbine DG5
Wind turbine
DG2
Energy storage system
Microgrid Isolation
DG1 Fuel-cells
~
Utility
generator Diesel Switch
9 In this case, the DG unites must be controlled in such a manner that all unites output powers
are monitored, along with the grid dynamics and power flow, to maintain the robustness and
stability of the distribution network. In addition, the capability of the DGs, and energy storage
systems if exist, must be measured continually to ensure optimized load sharing and power
dispatching mechanisms among all mounted DG units [15]. In general, the distributed generation
units are powerd by energy resources as classified in Figure 2-3. However, this dissertation focuses
more on the renewable energy resources and energy storage technologies, hence, the conventional
resources will not be further discussed in this research work.
In the recent two decades, a dramatic increase in DGs deployment was noticeable, and the
thanks is due to the environmental-friendly energy resources, such as wind turbines, photovoltaic
solar arrays, fuel cells and hydro turbines [16]. These clean energy resources are desirable, from
the environmental point of view, to combat the rise in the greenhouse gas emission all over the
world. Consequently, number agreements has been initiated to increase the reliance on the
green-energy resources to generate the electricity power, through the widespread installation of
small-scale and large-small-scale distributed renewable energy generation (DREG). For example, the historic
climate change agreement that signed in Paris in 2015, as a part of the United Nation Frame work Distribution
Generation sources & technologies
Non-Traditional resources Traditional resources
Low speed turbines Diesel engines Micro-Turbines
Electrochemical Devices Storage Devices Renewable sources
Fuel Cells
Batteries Fly wheels
Photovoltaic Wind turbines Hydro turbines
10 Convention Climate Change (UNFCCC) agenda [17]. This agreement was initiated to motivate
the participating parties to invest in large-scale DREG in order to limit the rising in the average
global temperatures below 2 degree Celsius. Driven by Paris agreement, many governments across
the world announced their renewable targets that’s plan to undertake in order to achieve the
agreement objectives. For example, Figure 2-4 (a) shows the trend of the all power resources in
the United States from 1990 to 2040, while Figure 2-4 (b) graphically illustrates the high rising in
the utilization of the environmental-friendly resources till 2040.
The renewable energy power plans are expected to be the largest second source of power
energy, after natural gas, by the end of 2030 as reported in the Energy Information Administration
(EIA) annual report (Annual Energy Outlook-AEO2019) [19]. This report also alluded to some
significant keys that encourage the investments in renewable energy, especially in the US. These
keys include the federal tax credits for renewable investments, clean power plans (CPP) set by
EIA, continued cost reduction ($/kWh) of the produced power from generators empowered by
wind and PV panels, and the growth in the global renewable energy projects planned for 2030.
(a) (b)
11 In the same context, numerous cost-effective studies, concluded that the investment in the
renewable energy resources receives an increased attention, since it significantly contributes in
exploiting the globally untapped energy resources [20,21]. Most of the Group of Twenty (G20)
countries are targeting tens Gaga-watts (GW) large-scale renewable energy projects by the end of
the next decade. The total expected capacity for the renewable energy projects is around 1.3 Tera
Watts (TW) by 2030, based on the announced targets in 2017 [20].
2.2.1 Interface of High Power Rating Distributed Renewable Generations
The distributed generators that empowered by renewable resources could not be integrated
directly to the electricity power grid, due to the intermit pattern of their produced power caused by
the nature of the transformed energy, such as wind speed and sun radiation. Moreover, these kinds
of power generators could suffer from high/low output voltage or frequency change due to the
disturbances in the captured renewable energy [22].
Therefore, a coupling stage is always utilized to integrate the DGs to the grid. This coupling
stage is commonly called as interface unit, and the joint point (or power bus) that links the DGs
front end to the power grid is referred as the Point of Common Coupling (PCC), or it is often called
Point of Interconnection (PIO). Figure 2-5 shows a simplified configuration of a distribution
system integrated a distributed renewable resource, and equipped with an interface stage and
control circuit. There are different interface mediums, and the selection amongst these interface
mediums is dependent on the nature of the interfaced distributed renewable resource and the
pattern of its produced power.
Referring to [22], the interface mediums can be classified as follows: Medium 1) direct
machine coupling, where the synchronous generator (SG) or induction generator (IG), or other
12 and hydro turbines. Medium 2) fully power electronics coupling. Basically, the power electronics
coupling devices (or converters) are used to condition the energy generated by the distributed
resource to match the grid requirements, as well as, to improve their performances. For example,
the power generated by photovoltaic distributed generation is converter to the ac form and fed to
the grid via dc-ac power converter. Similarly, fuel cells (CHP) based DGs requires fully power
electronics interface stage to couple with the grid. Medium 3) Partial power electronics coupling,
where partial of the DG apparent power, that transform via machine coupling, is converted by
power converters for power quality and enhancement purposes. An example of the Partial power
electronics coupling DGs is a variable speed wind DG. Medium 4) distributed power electronics
coupling, when more than one DG is connected to the same PCC, as in some applications of PCSs.
It is worth mentioning that, some DG resources, for example PV arrays, produces a dc
output voltage lower than the maximum line-to-line grid voltage. Therefore, a step-up (boost)
dc-dc converters are placed between the energy source and its dc-dc-ac interface stage. The majority of
fully and partially power electronics coupling units employ the two-level dc-ac voltage source
converter (VSC), due its simplicity and cost effectiveness [23]. However, for high power DG
Utility Network
Distribution transformer
Distributed Renewable resource
Local loads
Interface
Control circuit
PCC
Interface transformer
CT
VT
CT
Distribution generation
13 applications (typically >1 MW), the VSC with ordinary IGBTs is not capable to carry out the
output currents and/or the grid side ac voltage. Therefore, high power rating power converters are
used to interface the relatively big size DG units [24]. These converters include the three-level
Neutral Point Clamped (NPC) converter, multilevel modular converters (MMC) and Cascaded
H-bridge (CHB) converter. The Cascaded H-H-bridge converter is often used to achieve better system
performance, compared to the MMC, and to distribute the total size of the input battery source into
smaller dc sources [25].
Advanced power electronics technologies, such as high power capability Wide-Bandgap
(WBG) semiconductor switches, can be used in order to interface high rating distributed resources.
Numerous studies discussed the old and modern power electronics-based DG interface, as in
[26-28], yet this subject is out of the scope of this dissertation and hence will not be further discussed.
Nevertheless, more details on high power rating converters and advanced power electronics
switches will be discussed in the next section, when they utilized to facilitate the integration of
large-scale distributed renewable energy generation.
The suitable planning and optimal placement of the DGs into the power grid is another
factor that affect their performances. Different methods and techniques are used to efficiently
planned the DGs stations and choose their optimal location within the electricity power network.
These methods are well reviewed and discussed in [29,30].
2.2.2 Technical Challenges and Power Quality Issues due to the Integrations of
Distributed Renewable Energy Generations
In spite of the increased deployment of distributed renewable energy generation, due to
environmental and economical purposes, the drawbacks of those resources is undeniable. In other
14 physical inertia, inevitably poses significant challenges and dynamic issues facing the main utility
grid, end consumers and/or other attached renewable resources [10].
These issues include voltage stabilization, frequency deviation, power quality reduction,
low power factor and lower stability and security of the power network. The term “power quality”
here is defined as the righteousness level of voltage and current waveforms, and grid frequency.
Table 2-1 summaries the different considerations to measure the power quality of the power grid.
A poor power quality could result in higher power loss, damage or undesirable behavior of
sensitive equipment and loads, and interfacing with nearby communication lines. More effects of
poor power quality is explained in [31]. This reference also explains how the growth in power
electronic based non-linear loads and switching power supplies could negatively interact with
distorted grid waveforms, contributing in further reduction in grid power quality and reliability.
In addition to the utility power network, other distributed generation unites could be
affected by the problems posed by the distributed renewable generation, since they are interlinked
by the same distribution network. Furthermore, the GDs are commonly installed at weak
sub-transmission line, which makes them more susceptible to the above mentioned problems [32]. The
technical issues poses from DREG to the utility network could propagate to other DGs through the
interfaces voltage bus as shown in Figure 2-6. This figure illustrates the different challenges in all
power system stages (i.e., distributed renewable generation at high, medium and low voltage power
networks).
The technical issues at each power stage can affect the other parts of the power system.
Moreover, emerging more DG unites to the power grid rises the potential of the aforementioned
challenges. Therefore, and due to the fact that utilities are strict about criteria and requirements,
15 generations, in order to insure safe interconnection of more distributed energy resources. In the
next section, a literature review on different power electronics-based devices, used to facilitate the
integration of the DER in high voltage transmission systems and medium/low voltage distribution
power networks, is given.
Table 2-1. Overview on power quality issues [33]
Quality problem Explanation Causes Consequences
Voltage sag Normal voltage level declines between 10% and 90% of the nominal rms voltage at the power frequency, during 0.5 cycle to 1 min.
Faults on the electrical networks. Faults in consumers installation. Start-up of large motors and connection of heavy loads and.
Tripping of contractors (PCs, PLCs, ASDs, ..etc.)and electromechanical relays. Disconnection and loss of efficiency in electric rotating machines.
Short interruptions
Total interruption of electrical supply for duration from few milliseconds to one or two seconds.
Opening and automatic reclosers of security equipment to decommission a faulty part of the electrical network. The important fault sources are lightning, insulator flashover as well as insulation failure.
Tripping protection devices, loss of information and malfunction of data processing equipment. Stoppage of sensitive equipment, such as ASDs, PCs, PLCs.
Long
interruptions Total interruption of electrical supply for period greater than one to two seconds.
Material failure in the electrical power networks, storms and objects such as trees, human error, striking lines or poles, fire, bad coordination or failure of security equipment.
Stoppage of all equipment.
Voltage spike Very fast changing of the voltage rate for durations from several
microseconds to few milliseconds. In low voltage, these variations may reach thousands of volts.
Lightning, switching of lines or power factor correction capacitors, disconnection of heavy loads.
Destruction of components (electronic components) and of insulation materials, data processing errors or data loss, electromagnetic interference.
Voltage swell Momentary rise of the voltage, at the power frequency, outside the common tolerances, with period of more than one cycle and usually less than a few seconds.
On/Off of heavy loads, badly dimensioned power sources, badly regulated transformers during off peak hours.
Data loss, stoppage or damage of sensitive equipment, or flickering of lighting and screens, if the voltage values are too high.
Harmonic distortion
Voltage or current waveforms assume non-sinusoidal shape. The waveform corresponds to the sum of various sine-waves with different magnitudes and phases, having frequencies that are multiples of the electrical power system frequency.
Modern sources
All nonlinear loads, such as power electronics equipment.
Classic sources
Electric machines working above the knee of the magnetization curve, arc furnaces, welding machines, rectifiers, and dc brush motors.
Increased possibility of incidence of resonance, neutral overload in three phase systems, cables and devices overheating, efficiency loss in electric machines, electromagnetic interposition with communication systems, error in measures when using average reading meters and nuisance tripping of thermal protections.
Voltage
fluctuation Oscillation of voltage value, amplitude modulated by a signal with frequency of 0–30 Hz.
.
Arc furnaces, repeated start/stop of electric motors such as elevators, oscillating loads.
The most perceptible consequence is the flickering of lighting and screens, giving the impression of unsteadiness of visual perception.
Noise Superimposed of high-frequency signals on the waveform of the power-system frequency
Electromagnetic interferences provoked by Hertzian waves such as microwaves, TVs and radiation due to welding machines, arc furnaces, and electronic equipment. Improper grounding may also be a cause.
Disturbances on nonlinear loads which usually not destructive. May cause data loss and data processing errors.
Voltage Unbalance
A voltage variation in a three-phase system in which the three voltage magnitudes or the phase angle differences between them are not equal.
Large single-phase loads, incorrect distribution of all single-phase loads by the three phases of the system.
16 2.2.3 Power Quality Enhancement based on Power Electronic Systems
In order to overcome the technical and dynamic issues that addressed in the previous
section, numerous solutions were developed by scientific communities, energy national
laboratories and industries, since the early 1970s. These solutions are still under improvement to
allow more renewable energy resources accommodation with higher power quality and efficient
energy utilization.
This brief introduction focuses more on the widespread utilized solutions, such as the
Flexible AC Transmission Systems (FACTS), and their applications to facilitate the integration of
the DER.
2.2.3.1 Overview on FACTS Devices used to Enhance the Electrical Power Networks
In recent decades, flexible and higher capacity transmission lines were needed due to the
global increased in electricity power demand. In addition, and due to the rapid growth of
inconsistent power supplies, such as renewable resources, and nonlinear loads, the reliability,
efficiency and quality of the power system were under critical situations. Consequently, the
Figure 2-6. The impact of the DREG on the power network and other attached DG units.
Utility Network DR1
Loads PCC1
MVAC
DR2
weak transmission
system Loads
DREG
PCC2 LVAC
Intermittent apparent power.
Absence of inertia.
Interface Harmonics.
Injected reactive power
Power quality issues (Table 2-1)
Reduced power factor
Power loss rising
Stability reliability security
Frequency deviation
Variable interfacing impedance
Variation in VPCC2and frequency
Damage of sensitive loads
Power oscillations *
Wide band of dynamics *
17 flexible AC transmission systems with power electronic conversion devices were developed [34].
The main concepts and objectives of FACTS devices operation can be summarized as follows:
1) Controlling the active and reactive power flows.
2) Enhancing the voltage profile and power quality at the point of common coupling bus.
3) Improving the sub-transmission power factor.
4) Filtering the voltage and current harmonics.
5) Modulating the interfaced line impedance and admittance.
6) Dynamic power balancing for one, or multiple, power lines.
Different FACTS devices are developed to conduct one (or more) of the above listed
objectives, and they are classified based on type of connection (shunt, series or combined
shunt-series) or based on the objective (voltage control, voltage support, var compensate, harmonic filter
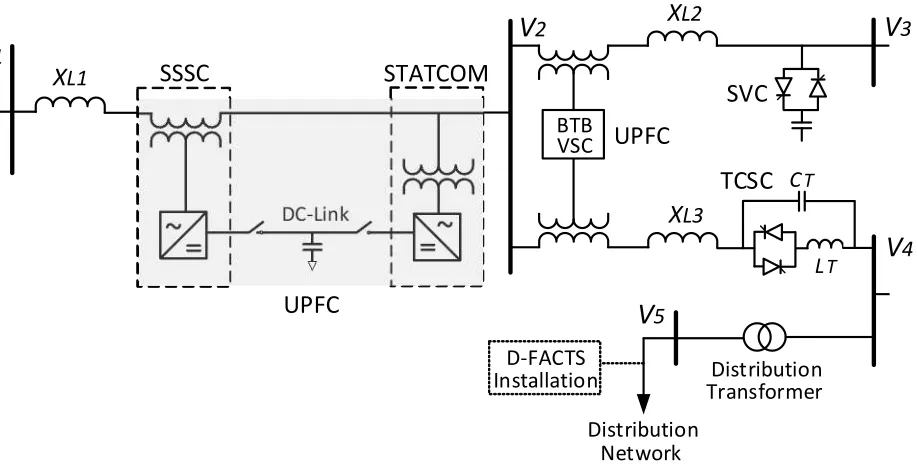
or power flow control). Figure 2-7 shows the most effective types of FACTS, connected to a
transmission line. Referring to [35], these FACTS devices can be explained as follows:
1. The Static VAR Compensator (SVC) is the first generation of FACTS, and it was developed
to generate or absorb reactive power to improve the voltage transient stability, reduce the
power oscillations and power loss. This device is connected to the grid through a shunt cable
with a proper passive power element and bypass switches.
2. The static synchronous compensator (STATCOM) is another shunt-connected device, where
it is commonly utilized at weak trans-mission lines to regulate the voltage at the interfaced bus
(and adjusting the reactive power in some applications). The voltage source inverter (VSI) is
the common building block of STATCOMs, while a step-up delta-wye power transformer is
used to isolate the shunt inverter harmonics. It is worth mentioning that, some applications
18 to handle high power ratings (>1 MVA). For example, a 10 MVA Cascaded-multilevel
converter (CMC) is utilized in [36] to implement a STATCOM system for enhancing the
integration of a large-scale wind farm. The device configuration gives the ability of operating
as a variable current source, to provide the required inductive/capacitive reactive power. The
main advantage of STATCOMs over the SVCs is the need for smaller passive elements with
better damping characteristics [33]. Design considerations and device limitations are well
discussed in [37].
~
~
D-FACTS Installation
BTB VSC
Distribution Transformer
V
1V
2V
3V
4V
5X
L1X
L2X
L3Distribution Network
STATCOM
SSSC
UPFC
UPFC
SVC
TCSC
CTLT
DC-Link
3. The Thyristor Controlled Series Compensator (TCSC) is the basic device to control the power
flow and enhance the grid stability. Due to its series-connected configuration, it contributes in
limiting the fault currents, however, affecting the line impedance is a main problem of this
device, therefore, proper control design is needed to avoid the critical resonance in the line
19 Vr
Vs+Vu
I Vs δ
ϕ Vu
Vu=0.03pu
Vu=0.02pu
Vu=0.01pu
impedance. Besides, the TCSC cannot be segregated from the grid as for shunt-connected
devices. More concerns about the TCSC operation and control are discussed in [34].
4. Another series-connected device is the Static Synchronous Series Compensator (SSSC). It has
the same concept of statcom except the use of a series-connected transformer instead of the
shunt configuration. It injects series voltage, with adjustable phase angle, to control the power
flow and improve the power stability. Unlike the TCSC, the SSSC does not remarkably affect
the line impedance, which results in avoiding the resonance problems.
5. The Unified Power Flow Controller (UPFC) is the most effective member of FACTS family,
since it constructed of STATCOM and SSSC, connected back-to-back through a DC bus, to
regulate the power flow, improve voltage profile and mitigate harmonics in power networks.
The decupling between the phase angle of the line current and the injected voltage is what
characterized the UPFC over the SSSC. In addition, the shunt converter side can be operated
as a voltage controller and harmonics active filter. Figure 2-8 shows the phasor diagram and
the P-Q operating range when the injected series voltage varies from 0.01pu to 0.03pu and
from 0 to 360 degree phase angle.
Figure 2-8. The UPFC characteristics. (left) phasor diagram, (right) P-Q operation range.
Q (PU)
P
(
P
U
20 In this case, the sending and receiving end voltages are set at constant values at 0.98 (0.20 rad)
and 1.0 (0.0 rad), respectively, while the line impedance (XL1) is assumed to be 0.2pu. This
FACTS device suffers from the circulating current thorough the SSSC side converter, due to
the series connection with the power line, and the limited transformed active power. In
addition, there is a possibility of undesired interaction between the two end nodes that attached
to the grid. More dynamic and operation issues of the UPFC are discussed in [37].
6. The Interline Power Flow Controller (IPFC) is basically a combination of single line SSSC
unites shared the same DC bus, and each unit is interfacing one line of the power transmission
system. Dynamic power balancing and optimized 3-phase power flow control can be conducted
by the IPFC. The basic principle of the IPFC control capability and operation limits are well
investigated in [38] and [39]; respectively.
Despite the effectiveness of the aforementioned FACTS in power flow control and power
quality enhancement, they have two main challenges, especially when installed in medium voltage
(MV) transmission networks. First, the capital insulation and operation costs ($/kVAR); where
power electronic converters with high power ratings (hundreds MVAR) and high voltage ratings
(hundreds of kV) are required to meet the grid needs. Second, the rapid growth of renewable DERs
and nonlinear loads distortions in low voltage (LV) distribution networks, where FACTS devices
are not capable to take control of their undesirable impact [33]. It is worth mentioning that,
renewable energy installations are desired to be placed close to the end loads, in order to reduce
the transmitted power in transmission lines, as well as, reduce the length of the DER radial feeders.
Therefore, distributed flexible AC transmission systems D-FACTS are developed in order
to conduct the same objectives of the normal FACTS in LV distribution networks, hence, they are
![Table 2-1. Overview on power quality issues [33]](https://thumb-us.123doks.com/thumbv2/123dok_us/1587690.1195669/34.612.67.538.222.719/table-overview-power-quality-issues.webp)
![Figure 2-11. Total investment needed by 2030 for the renewable energy targets (in USD billion) [20]](https://thumb-us.123doks.com/thumbv2/123dok_us/1587690.1195669/46.612.91.523.70.343/figure-total-investment-needed-renewable-energy-targets-billion.webp)
![Figure 2-13. The renewable energy capacity needed toward 2030 renewable targets in South Korea [59]](https://thumb-us.123doks.com/thumbv2/123dok_us/1587690.1195669/49.612.106.508.419.638/figure-renewable-energy-capacity-needed-renewable-targets-south.webp)