ISSN(Online): 2319-8753
ISSN (Print): 2347-6710
I
nternational
J
ournal of
I
nnovative
R
esearch in
S
cience,
E
ngineering and
T
echnology
(An ISO 3297: 2007 Certified Organization)
Vol. 4, Issue 1, January 2015
Development and Validation of a Stability
Indicating Reverse Phase HPLC Method for
Simultaneous Determination of Etodolac and
Paracetamol in Its Tablet Dosage Formulation
Mithlesh Rajput1, Hinna Hamid2, Manjeet Aggarwal3, Rakesh Kumar Khandal4*
Department of Drugs and Pharma, Shriram Institute for Industrial Research, Delhi, India1
Department of Chemistry, Jamia Hamdard, New Delhi, India2
The National Institute of Food Technology Entrepreneurship and Management, Sonipat, Haryana, India3
Uttar Pradesh Technical University, IET Campus, Sitapur Road, Lucknow, Uttar Pradesh, India4
ABSTRACT: A simple, sensitive, accurate, HPLC-UV method has been developed for the simultaneous determination
of etodolac and paracetamol in presence of their degradation products in tablet combined dosage formulation. Chromatographic separation was achieved successfully by using phenomenex C18 column (150 mm x 4.6 mm, i.d. 5 m particale size) with an optimized mobile phase of ACN:H2O:H3PO4 in the ratio of 500:500:0.25 (v/v/v) pH 3.0 with
triethyamine. The mobile phase was run at a flow rate of 1 ml / minute under isocratic conditions with injection volume 10µl and the quantification of etodolac and paracetamol was carried out by UV detector at 274 nm based on peak area maeasurment. The reliability and performance of the proposed method were statistically validated with respect to system suitability, linearity, accuracy, precision (inter-day and intra-day), specificity, and robustness, limit of detection and limit of quantification. The method was found to be linear in the wide working range of 2 to 80µg/ml and 2.5-100µg/ml for both the analyte of interest with correlation coefficient 0.999 and 0.999 for etodolac and paracetamol respectively.
The proposed method proved to be selective and suitable for indicating stability study for both etodolac and paracetamol in presence of any degradation product formed under different forced stress conditions (acidic, alkaline, oxidation, thermal and photolytic). The proposed validated method was successfully applied to the analysis of etodolac and paracetamol in their combined dosage form and thus can be routinely used for the simultaneous determination of etodolac and paracetamol when present in combined formulation.
KEYWORDS:Etodolac, Paracetamol, UV-HPLC, Stability indicating method.
I. INTRODUCTION
Etodolac is chemically (R, S) -2- (1, 8-Diethyl-4, 9-dihydro-3H-pyrano [3, 4-b] indol-1-yl) acetic acid. Its molecular weight and formula are C17H21NO3 and 287.35g/mol respectively [1]. Etodolac works by reducing the levels of
ISSN(Online): 2319-8753
ISSN (Print): 2347-6710
I
nternational
J
ournal of
I
nnovative
R
esearch in
S
cience,
E
ngineering and
T
echnology
(An ISO 3297: 2007 Certified Organization)
Vol. 4, Issue 1, January 2015
Figure 1: Chemical Structure of Etodolac
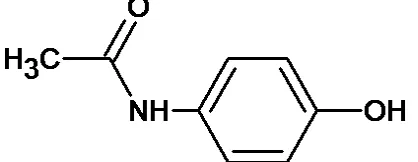
Paracetamol chemically is 4-hydroxyphenylacetanilide and its structure is given in figure 2. Its molecular formula is C8H9NO2 and molecular weights are 151.16 g/mol [8]. It is classified as a mild analgesic and is most commonly used
for the relief of headache and other minor aches and pains such as post-surgical pain, providing palliative care in advanced cancer patients. It is a major ingredient in numerous cold and flu remedies in combination with opioid analgesics [9]
Figure 2: Structure of paracetamol
There are various other publications also which describe various analytical methods for the determination of paracetamol either present alone or in combination with certain other active pharmaceutical ingredients in different formulations and biological fluids. The reported analytical techniques are based on the use of spectrophotometry [10] [11] [12], High performance liquid chromatography (HPLC) [13] [14] [15], Tandem liquid chromatography mass spectroscopy (LC-MS/MS) [16] [17] [18]. There are various methods have been reported for simultaneous determination of etodolac and paracetamol using spectrophotometery [19] [20] [21], High performance thin layer liquid chromatography (HPTLC) [22] [23] and HPLC [24] [25]. To the best of our knowledge there is no Stability indicating HPLC method is available for simultaneous quantification of etodolac and paracetamol in its combined dosage formulation. The International conference on harmonization guidelines requires that stress testing be carried out to elucidate the inherent stability of active pharmaceutical ingredient. Stability is the most important criteria in pharmaceutical formulation. The drug which is free from its degraded product is safe and effective for patients. With this background a study has been undertaken to develop a stability indicating reverse phase HPLC method for simultaneous quantification of etodolac and paracetamol in the presence of its degradation products in tablet combined dosage formulation.
II. MATERIALS&METHODS
Chemical and reagents:
ISSN(Online): 2319-8753
ISSN (Print): 2347-6710
I
nternational
J
ournal of
I
nnovative
R
esearch in
S
cience,
E
ngineering and
T
echnology
(An ISO 3297: 2007 Certified Organization)
Vol. 4, Issue 1, January 2015
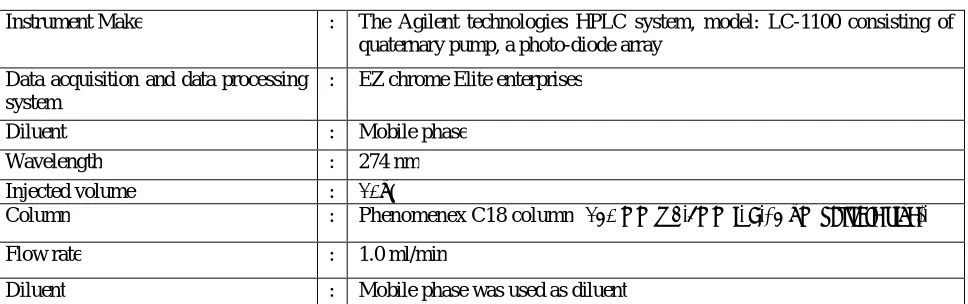
Instrumentation:
Table 1: HPLC Conditions
Instrument Make : The Agilent technologies HPLC system, model: LC-1100 consisting of
quaternary pump, a photo-diode array
Data acquisition and data processing system
: EZ chrome Elite enterprises
Diluent : Mobile phase
Wavelength : 274 nm
Injected volume : 10μl
Column : Phenomenex C18 column (150 mm x 4.6mm i. d., 5 μm particle size).
Flow rate : 1.0 ml/min
Diluent : Mobile phase was used as diluent
Methods:
(A) Preparation of Mobile Phase: The mobile phase was prepared by mixing of acetonitrile, water and
orthophosphoric acid in the ratio of 500:500:0.25 (v/v/v). The pH of the mobile phase was set to 3.0 by using triethylmine. Mobile phase was filtered through a 0.45μm nylon membrane filter.
(B) Standard solution preparation:
Solution –A: Etodolac standard stock solution containing 400 μg/ml was prepared in a 100 ml volumetric flask taking
40.7 mg of etodolac in 20 ml of mobile phase in the flask. This solution was shaken for 10 minutes and made to volume with mobile phase (final concentration is of 400.7 μg/ml).
Solution –B: Paracetamol stock solution containing 500 μg/ml was prepared in a 100 ml volumetric flask taking 50.7
mg of paracetamol in 20 ml of mobile phase in the flask. This solution was shaken for 10 minutes and made to volume
with mobile phase (final concentration is of 500.7 μg/ml).
Solution –C: 10 ml of each of solution A and solution B were pipetted in 100 ml volumetric flask and made to the volume using mobile phase. This gave combined standard working solution of etodolac and paracetamol each having
concentration of 40µg/ml of etodolac and 50 μg/ml of paracetamol respectively. 10 μL of the standard solution C was
injected in to the HPLC.
(C) Sample analysis:
Twenty tablets of sample were weighed in order to calculate average weight of the tablet and then finely powdered. An accurate weight of the powder equivalent to 40 mg of etodolac and 50 mg of paracetamol was weighed and transferred to 100 ml volumetric flask to which 20 ml of diluents was added. This solution was shaken and sonicated for 15 minutes, and made to volume with diluent to 100 ml (sample stock solution). A 10 ml aliquot of this solution was further accurately pipette into 100 ml volumetric flask and diluted to volume with mobile phase. This gave combined test solution of etodolac and paracetamol each having concentration of approximately 40 µg/ml of etodolac and 50 µg/ml of paracetamol respectively.
(D) Forced degradation study of the sample was carried out under following conditions:
a) Acidic conditions: To study the effect of acidic degradation 5 ml of sample stock solution was taken into 50
ml empty volumetric flask and 5 ml 0.1M HCl solution to this flask and heating on a water bath at temperature 600C for approximately six hours. This solution was left to reach ambient temperature, neutralized to pH 7 by addition of 5 ml of 0.1 M NaOH, further diluted to 100 ml with diluent. The final concentration of this resulted test solution was 40 µg/ml of etodolac and 50 µg/ml of paracetamol respectively.
b) Alkaline conditions: To study the effect of basic degradation 5 ml of sample stock solution was taken into 50
ISSN(Online): 2319-8753
ISSN (Print): 2347-6710
I
nternational
J
ournal of
I
nnovative
R
esearch in
S
cience,
E
ngineering and
T
echnology
(An ISO 3297: 2007 Certified Organization)
Vol. 4, Issue 1, January 2015
for approximately six hours. This solution was left to reach ambient temperature, neutralized to pH 7 by addition of 5 ml of 0.1 M HCL, further diluted to 100 ml with diluents. The final concentration of this resulted test solution is 40 µg/ml of etodolac and 50 µg/ml of paracetamol respectively
c) Oxidative condition : : Oxidative degradation study was performed by refluxing the 5 ml of sample stock
solution with 10 % hydrogen peroxide at 600 C for 1 hr. Solution was allowed to cool at room temperature and further diluted with dilutent to 50 ml. The final concentration of this resulted test solution was 40 µg/ml of etodolac and 50 µg/ml of paracetamol respectively.
d) Thermal condition: Thermal degradation was performed by exposing the intact tablet formulations at 80 °C
for 72 hours. Then tablets were crushed in order to obtain fine powder and weight equivalent to 40 mg of etodolac and 50 mg of paracetamol was taken in to 100 ml of volumetric flask. 10 ml of diluent was added in to flask and sonicated for 15 minutes and further diluted with diluents this sample solution gave final concentration of 400 µg/ml and 500 µg/ml etodolac and paracetamol. This sample was further diluted to obtain final concentration of 40 µg/ml and 50 µg/ml etodolac and paracetamol.
e) Photolytic condition: Photolytic degradation was performed by exposing the intact tablet formulations to UV
–light for 48 hours and these tablets were crushed in order to obtain fine powder. Then the weight equivalent to 40 mg of etodolac was weighed and taken into 100 ml of volumetric flask. 10 ml of diluent was added into flask and sonicated for 15 minutes and then further diluted with diluents this solution gave final concentration of 400 µg/ml and 500 µg/ml etodolac and paracetamol. This sample was further diluted to obtain final concentration of 40 µg/ml and 50 µg/ml etodolac and paracetamol. The sample solution and degradation sample solution was then filtered through syringe using 0.45 mm membrane filter. 10μL of this sample solution was injected in to the HPLC. Calculation was based on the peak area ratio in the standard chromatogram and peak area in test chromatogram
III. CALCULATIONS
Prototype calculation for one set of Etodolac
Assay
(%) = AT X W1 X 10 X 100 X 100 X P X AW X 100 = Result %
AS 100 `100 W2 10 100 LC
Whereas,
AT = Average area of etodolac obtained in test preparation AS = Average area of etodolac obtained in standard preparation W1 = Weight taken of etodolac reference standard (mg) W2 = Weight taken of etodolac sample (mg)
AW = Average weight of tablets (mg) LC = Label claim (mg)
P = Potency of etodolac reference standard (%)
Prototype calculation for paracetamol
Assay (%) =
AT
X W1 X 10 X 100 X 100 X P X AW X 100 = Result %
AS 100 `100 W2 10 100 LC
Whereas,
ISSN(Online): 2319-8753
ISSN (Print): 2347-6710
I
nternational
J
ournal of
I
nnovative
R
esearch in
S
cience,
E
ngineering and
T
echnology
(An ISO 3297: 2007 Certified Organization)
Vol. 4, Issue 1, January 2015
AW = Average weight of tablets (mg) LC = Label claim (mg)
P = Potency of paracetamol reference standard (%)
IV. METHOD VALIDATION
Specificity and Selectivity: The specificity of the method was checked by injecting blank solution and sample
Solution There was no interference from blank on the retention time of analyte peak. To prove this method a stability indicating, force degradation study was also performed.
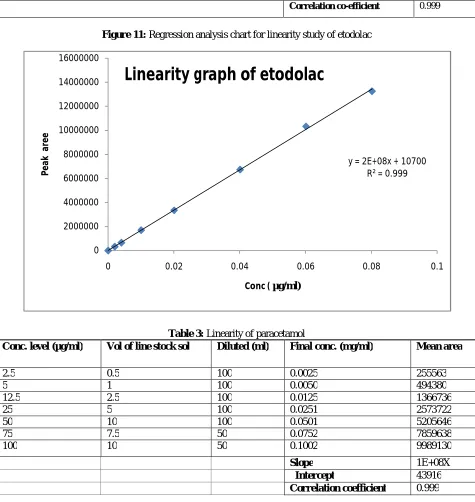
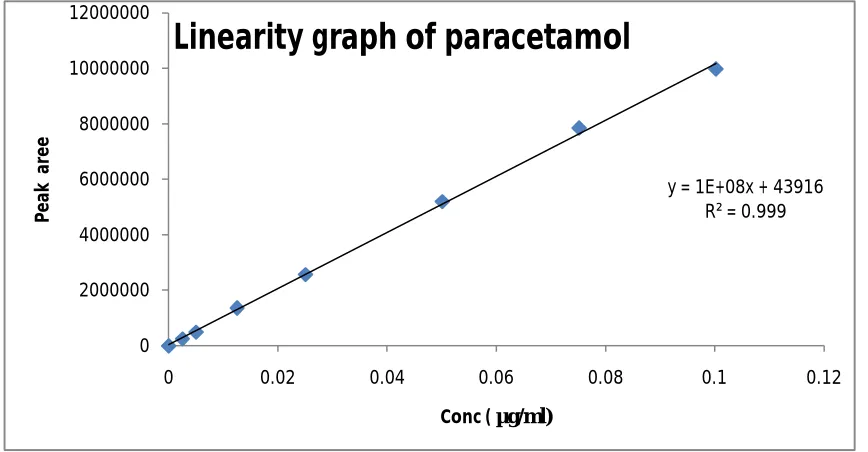
Linearity: The method showed linear in the concentration range of 2 µg/ml to 80 µg/ml and 2.5-100 µg/ml for
etodolac and paracetamol respectively. The correlation coefficient was found 0.999 for the drugs. The results are shown in table 2-3.
Precision: The method precision and intermediated precession were calculated. The results were within the limits. The
results of the method precision and intermediate precision were shown in table 4-5.
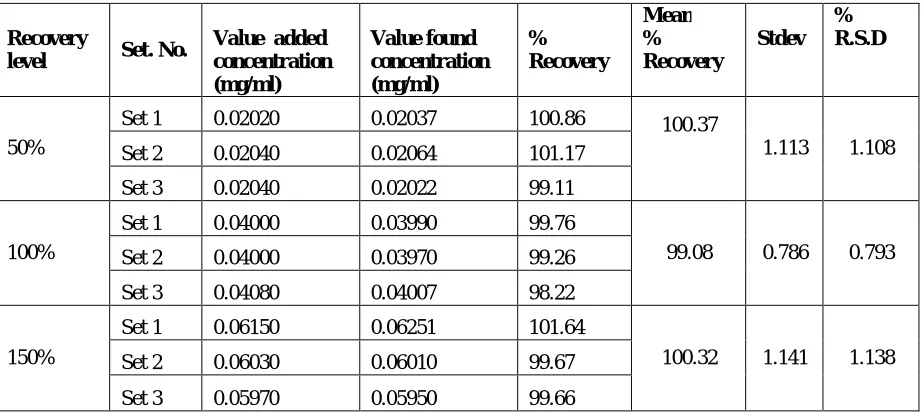
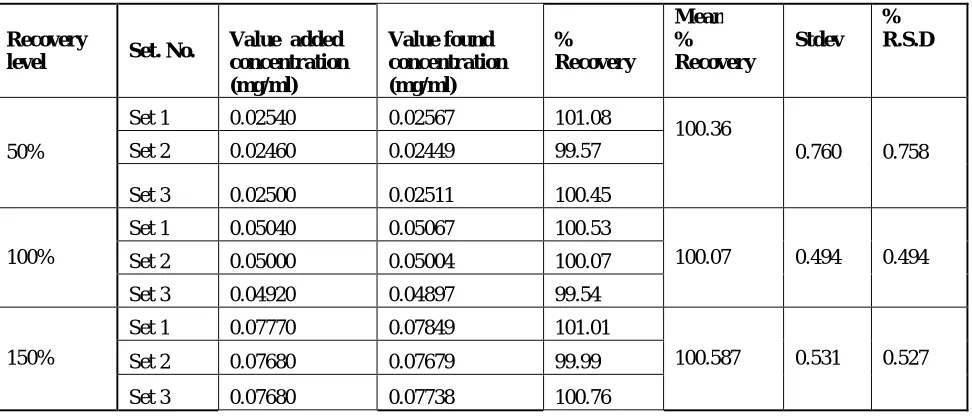
Accuracy: The accuracy of the method was determined by adding known amount of etodolac and paracetamol
corresponding to three concentration levels of 50%, 100%, and 200% of analytes concentration. The accuracy was calculated by amount of analytes added and amount of analytes found. This gives the percentage of analyte recovered by the assay method. Based on our results that the method is highly accurate. The accuracy results are shown in table6-7.
Robustness of the method: Changing with the flow rate (±0.1mL/min), and mobile phase composition. No change in
assay result % was observed. The results of the robustness results are shown in table 8.
LOD and LOQ: Limit of detection of method is 0.2 µg/ml and 0.25 µg/ml for etodolac and paracetamol respectively
and limit of quantification is 0.4 µg/ml for etodolac and for paracetamol 0.5 µg/ml.
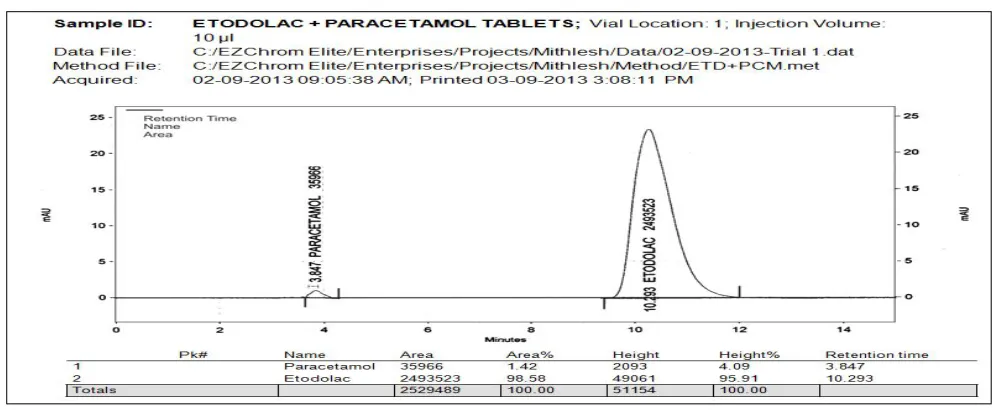
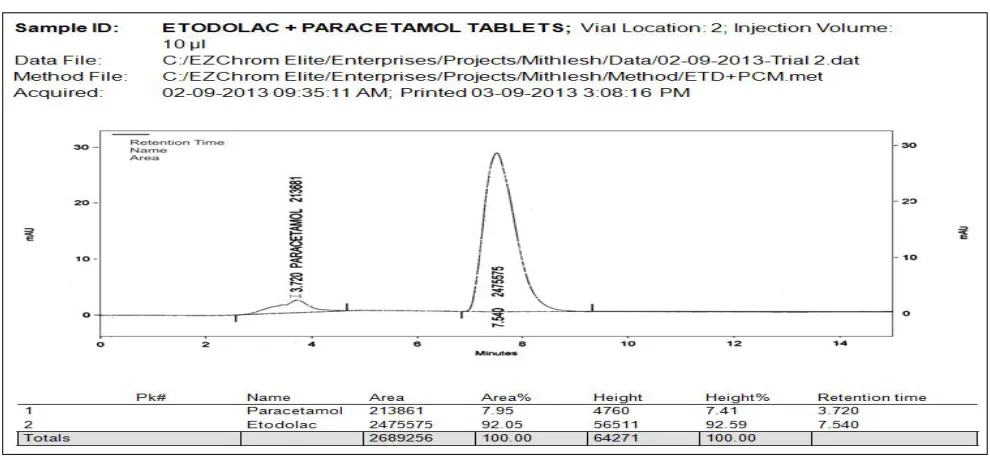
V. EXPERIMENTAL RESULTS
In the present work, an analytical method is based on LC method using UV detector, the analytical conditions were selected, keeping in mind the different chemical nature of etodolac and paracetamol. The development trials were performed by using original standard preparation with different mobile phases. Trial 3 is final mobile phase for validation study.
ISSN(Online): 2319-8753
ISSN (Print): 2347-6710
I
nternational
J
ournal of
I
nnovative
R
esearch in
S
cience,
E
ngineering and
T
echnology
(An ISO 3297: 2007 Certified Organization)
Vol. 4, Issue 1, January 2015
Figure 4: Chromatogram of trail II (mobile phase –methanol: acetonitrile: water 30:50:20 v/v/v)
ISSN(Online): 2319-8753
ISSN (Print): 2347-6710
I
nternational
J
ournal of
I
nnovative
R
esearch in
S
cience,
E
ngineering and
T
echnology
(An ISO 3297: 2007 Certified Organization)
Vol. 4, Issue 1, January 2015
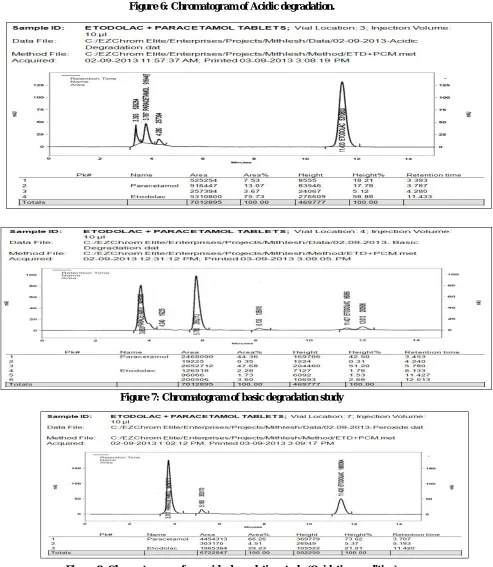
Figure 6: Chromatogram of Acidic degradation.
Figure 7: Chromatogram of basic degradation study
ISSN(Online): 2319-8753
ISSN (Print): 2347-6710
I
nternational
J
ournal of
I
nnovative
R
esearch in
S
cience,
E
ngineering and
T
echnology
(An ISO 3297: 2007 Certified Organization)
Vol. 4, Issue 1, January 2015
Figure 9: Chromatogram of thermal degradation.
Figure 10: Chromatogram of photo degradation.
During the force degradation study different peaks were generated but this proposed method can easily separate the peaks of etodolac and paracetamol along with its degraded impurities.
Table 2: Linearity table for etodolac.
Conc. level (µg/ml) Vol of line stock sol Diluted (ml) Final conc. (mg/ml) Mean area
2 0.5 100 0.002 326799.5
4 1 100 0.004 655505.5
10 2.5 100 0.010 1693216.5
20 5 100 0.020 3349736
40 10 100 0.040 6730491
60 7.5 50 0.060 10329067
ISSN(Online): 2319-8753
ISSN (Print): 2347-6710
I
nternational
J
ournal of
I
nnovative
R
esearch in
S
cience,
E
ngineering and
T
echnology
(An ISO 3297: 2007 Certified Organization)
Vol. 4, Issue 1, January 2015
y = 2E+08x + 10700 R² = 0.999
0 2000000 4000000 6000000 8000000 10000000 12000000 14000000 16000000
0 0.02 0.04 0.06 0.08 0.1
P
e
ak
a
re
e
Conc ( µg/ml)
Linearity graph of etodolac
Slope 2E+0.8X
Intercept 10700
Correlation co-efficient 0.999
Figure 11: Regression analysis chart for linearity study of etodolac
Table 3: Linearity of paracetamol
Conc. level (µg/ml) Vol of line stock sol Diluted (ml) Final conc. (mg/ml) Mean area
2.5 0.5 100 0.0025 255563
5 1 100 0.0050 494380
12.5 2.5 100 0.0125 1366736
25 5 100 0.0251 2573722
50 10 100 0.0501 5205646
75 7.5 50 0.0752 7859638
100 10 50 0.1002 9989130
Slope 1E+08X
Intercept 43916
ISSN(Online): 2319-8753
ISSN (Print): 2347-6710
I
nternational
J
ournal of
I
nnovative
R
esearch in
S
cience,
E
ngineering and
T
echnology
(An ISO 3297: 2007 Certified Organization)
Vol. 4, Issue 1, January 2015
y = 1E+08x + 43916 R² = 0.999
0 2000000 4000000 6000000 8000000 10000000 12000000
0 0.02 0.04 0.06 0.08 0.1 0.12
P
e
a
k
a
re
e
Conc ( µg/ml)
Linearity graph of paracetamol
Figure 12: Regression analysis chart for linearity study of paracetamol
Table 4: Results of precision studies for etodolac
Set No Assay (%) Mean assay (%) Steve %RSD
1 100.75
100.53 0.448 0.446
2 100.16
3 100.12
4 100.39
5 100.45
6 101.32
1 101.55
100.27 1.092 1.089
2 99.2
3 99.12
4 99.90
5 101.58
6 100.29
Mean 100.40
Absolute difference between mean % assay values of Method precision and Intermediate precision= 0.5
Steve 0.81
ISSN(Online): 2319-8753
ISSN (Print): 2347-6710
I
nternational
J
ournal of
I
nnovative
R
esearch in
S
cience,
E
ngineering and
T
echnology
(An ISO 3297: 2007 Certified Organization)
Vol. 4, Issue 1, January 2015
Table 5: Results of precision studies for paracetamol
Set No Assay (%) Mean assay (%) Stdev %RSD
1 99.49
99.9883 0.611 0.611
2 99.64
3 99.80
4 100.68
5 99.48
6 100.84
1 100.66
101.03 0.508 0.503
2 101.58
3 100.67
4 101.77
5 100.84
6 100.66
Mean 100.51 Absolute difference between mean % assay values of Method
precision and Intermediate precision= 1
Stdev 0.76
% RSD 0.76
Table 6: Summary of recovery study for etodolac at three different concentration levels
Recovery
level Set. No.
Value added concentration (mg/ml)
Value found concentration (mg/ml)
% Recovery
Mean % Recovery
Stdev % R.S.D
50%
Set 1 0.02020 0.02037 100.86 100.37
1.113 1.108
Set 2 0.02040 0.02064 101.17
Set 3 0.02040 0.02022 99.11
100%
Set 1 0.04000 0.03990 99.76
99.08 0.786 0.793
Set 2 0.04000 0.03970 99.26
Set 3 0.04080 0.04007 98.22
150%
Set 1 0.06150 0.06251 101.64
100.32 1.141 1.138
Set 2 0.06030 0.06010 99.67
ISSN(Online): 2319-8753
ISSN (Print): 2347-6710
I
nternational
J
ournal of
I
nnovative
R
esearch in
S
cience,
E
ngineering and
T
echnology
(An ISO 3297: 2007 Certified Organization)
Vol. 4, Issue 1, January 2015
Table 7: Summary of recovery study for paracetamol at three different concentration levels
Recovery
level Set. No.
Value added concentration (mg/ml)
Value found concentration (mg/ml)
% Recovery
Mean % Recovery
Stdev % R.S.D
50%
Set 1 0.02540 0.02567 101.08
100.36
0.760 0.758
Set 2 0.02460 0.02449 99.57
Set 3 0.02500 0.02511 100.45
100%
Set 1 0.05040 0.05067 100.53
100.07 0.494 0.494
Set 2 0.05000 0.05004 100.07
Set 3 0.04920 0.04897 99.54
150%
Set 1 0.07770 0.07849 101.01
100.587 0.531 0.527
Set 2 0.07680 0.07679 99.99
Set 3 0.07680 0.07738 100.76
Table 8: Robustness study for etodolac and paracetamol
Robust conditions Etodolac Paracetamol
Assay Retention time % Assay difference Assay Retention time % Assay
difference
0.9 ml/min 99.08 12.780 1.02 99.34 4.127 1.46
1.1 ml/min 99.22 10.43 0.88 99.89 3.367 0.91
Buffer: ACN (48:52 v/v) 99.64 11.762 0.46 100.56 3.931 0.24
Buffer :CAN (52: 48 v/v) 100.33 11.172 0.61 100.58 3.480 0.22
VI. CONCLUSION
ISSN(Online): 2319-8753
ISSN (Print): 2347-6710
I
nternational
J
ournal of
I
nnovative
R
esearch in
S
cience,
E
ngineering and
T
echnology
(An ISO 3297: 2007 Certified Organization)
Vol. 4, Issue 1, January 2015
REFERENCES
1. C.S. Sweet, Martindale, “ The Complete Drug Reference”, 34 Ed, 37-38, 2008 2. Http://Www.Medicinenet.Com/Etodolac/Article.Htm
J.Behari, G.W. Zeng, M.D. Thompson, P. Muller, S.S. Sekhon, L. Leoni, “R-Etodolac Decreases Beta-Catenin Levels Along with Survival and Proliferation of Hepatoma Cells”, Journal of Hepatology, 46(5), 849-57, 2007
3. A. J. Palande, B.J. Shailaja, S.T. Amit, D.C. Pravin, H.S. Bhimashankar, M.R. Pundlik, “Development and Validation of Stability Indicating Assay Method of Etodolac by Using UV-Visible Spectrophotometer”. International Journal of Pharmaceutical and Chemical Science, 2 (2) 678-685, 2013
4. A. Bhandari, R.Solanki, B.P. Nagori, M. Nawal, M. Bhandari, “UV Spectrophotometric Determination of Etodolac in Tablet Dosage Form”, Journal of Pharmacy Research, 4(10), 3309-3311, 2011
5. G.S. Garode, B.C. Ghodeswar, S.D. Thorat, P.P. Phawade, S.R. Chaudhari, “Development and Validation of Stability Indicating Assay Method for Simultaneous Determination of Etodolac and Thiocolchiside in Bulk and Tablet Formulation by RP-HPLC Method”, International Journal of Pharmaceutical Research and Development, 5(5), 008-014, 2013
6. R. Mohammed, K. Abyazani, E. Barbara, L. Barbara, “Etodolac in Equine Urine and Serum: Determination by High-Performance Liquid Chromatography with Ultraviolet Detection, Confirmation and Metabolite Identification by Atmospheric Pressure Ionization Mass Spectrometry”, Journal of Analytical Toxicology, 23, 201-209,1999
7. British Pharmacopoeia, Vol. II, London Her Majesty’s Stationery Office; 1998. P.1854. 8. Http://En.Wikipedia.Org/Wiki/Paracetamol
9. G.S.A Murtaza, A. Khan, A. Shabbir, M.H. Mahmood, H.B. Asad, K. Farzana, N.S. Malik,, I. Hussain, “Development of a UV-Spectrophotometric Method for The Simultaneous Determination of Aspirin and Paracetamol in Tablets”, Scientific Research Essays, 6, 417- 421, 2011
10. V. Vichare, P. Mujgond, V. Tambe, S.N. Dhole, “Simultaneous Spectrophotometric Determination of Paracetamol and Caffeine in Tablet Formulation”, International Journal of Pharma. Tech. Research, 2, 2512-2516,2010
11. R. Gondalia, R. Mashru, P. Savaliya, “Development and Validation of Spectrophotometric Method for Simultaneous Estimation of Ibuprofen and Paracetamol in Soft Gelatin Capsule by Simultaneous Equation Method”, International Journal of Chemical technology and research, 2, 1881-1885, 2010
12. D. Gharge, P. Dhabale, “Simultaneous Estimation of Aceclofenac and Paracetamol in Solid Dosage form by RP-HPLC Method” International Journal of Chemical technology and Research, 2, 942-946
13. N.S. Lakka, N. Goswami, P. Balakrishna, “Development and Validation of a RP-HPLC for Simultaneous Determination of Ibuprofen and Paracetamol in Solid Dosage Forms: Application to Dissolution Studies”, International Journal of Research and Pharmaceutical Sciences, 2, 331-337, 2011
14. S. Sharma, M.C. Sharma, “Isocratic RP-HPLC Method for Simultaneous Estimation of Paracetamol and Lornoxicam in Combined Tablet Dosage Form and Its Dissolution Assessment”, International Journal of Chemical Technology and Research, 3, 997- 1002, 2011
15. T. Zhu, L. Ding, X. Guo, L. Yang, A. Wen, “Simultaneous Determination of Tramadol and Acetaminophen in Human Plasma By LC-ESI-MS”, Chromatographia, 66, 171-178, 2005
16. A.K. Hewavitharana, S. Lee, P.A. Dawson, D. Markovich, P.N. Shaw, “Development of an HPLC-MS/MS Method for the Selective Determination of Paracetamol Metabolites in Mouse Urine”, Analytical Biochemistry, 374, 106-111, 2008
17. O.Q.P. Yin, S.S.L. Lam, M.S.S.Chow, “Simultaneous Determination Of Paracetamol And Dextropropoxyphene in Human Plasma by Liquid Chromatography/Tandem Mass Spectrometry: Application to Clinical Bioequivalence Studies”, Rapid Communication Mass Spectrum,19, 767-774, 2005
18. P. Balan, N.M. Carolin, P.M. Lakshmi, R. Vanaja, S. Rajasekar, “Simultaneous Estimation of Etodolac and Paracetamol by Uv Spectrophotometric Method in Tablet Formulation”, Journal of Pharmaceutical Reseach, 4(6), 1663-1665,2011
19. R. Patidar, U.S. Baghel, S. Patela, M. Singhal, N. Patidara, G. Englaa, N. Dongrea, “Simultaneous Spectrophotometric Estimation of Paracetamol and Etodolac in Tablet Dosage Forms”, Journal Global Pharmaceutical technology, 1(1) 62-66, 2009
20. A.V. Jadav, B.A. Gohel, M.M. Sondagar, B.A. Patel, S.J. Parmar, “Method Development and Validation for The Simultaneous Estimation of Paracetamol and Etodolac By Derivative UV Spectroscopic Method”, International Journal of Pharmtech Research, 5(3), 1155-1160, 2013 21. V.G. Kulkarni, S.V. Gandhi, P.B. Deshpande, P. Divekar, High Performance Thin Layer Chromatographic analysis of Paracetamol and
Etodolac in Combined Tablet Dosage Form, Journal of Chemical Pharmaceutical Research, 4, 1750- 1755, 2012
22. P.H. Chaube, S.V. Gandhi, P.B. Deshpande, V.G. Kulkarni, “High Performance Thin Layer Chromatographic Analysis of Paracetamol and Etodolac in Spiked Human Plasma”, Journal of Pharmaceutical and Biomedical Sciences”, 7 (13), 01-06 2010
23. K.J. Manoj, U.L. Naryan, “UV - Spectrophotometric and RP - HPLC Method Developement For Simultaneous Determination of Paracetamol and Etodolac in Pharmaceutical Dosage Form”, Pharmatutor-Art-1090 1-3, 2010