ABSTRACT
DULBERG, MARTIN S. A Task-based Framework for the Quantitative Evaluation of Input Devices. (Under the direction of Robert St. Amant and David F. McAllister.)
This research describes the development of a conceptual framework and methodology that
will permit the evaluation of input devices in graphical user interfaces in a more meaningful
context than previous studies. We provide a procedure for the reuse of performance
characteristics in expanded domains. Individual performance differences are analyzed and
their implications for current evaluation methods are discussed. We have built an
interactive simulation for domain-independent testing of the suitability of different input
devices for specific tasks, based on the demand characteristics of the task and the
performance characteristics of the device. The simulation will allow researchers and
practitioners to evaluate the suitability of particular input devices in a given user interface
with a severely restricted role for usability testing. Using the system, it will be possible to
select a device based upon optimal task completion time or estimated error rate. The role of
inter-task transition times is explored. A methodology for prediction of performance with
A TASK-BASED FRAMEWORK FOR THE QUANTITATIVE
EVALUATION OF INPUT DEVICES
by
MARTIN S. DULBERG
A dissertation submitted to the Graduate Faculty of North Carolina State University in partial fulfillment of the requirements for the Degree of Doctor of Philosophy
COMPUTER SCIENCE
Raleigh
2003
APPROVED BY:
___________________________________ ___________________________________
PERSONAL BIOGRAPHY
ACKNOWLEDGEMENTS
Table of Contents
Page
LIST OF TABLES . . . vi
LIST OF FIGURES . . . vii
1. INTRODUCTION . . . 1
1.1 Contributions . . . 6
1.2 Outline . . . 10
2. Related Work . . . 12
2.1 Evaluation and Calibration of Input Devices . . 14
2.2 Comparison of Input Devices . . . 16
2.3 Taxonomies of Input Devices . . . 22
2.4 Models of Device Usage . . . 28
2.5 Task Taxonomies . . . 33
2.6 Other Related Work . . . 36
3. Interaction Modeling . . . 39
3.1 Introduction . . . 39
3.2 Task Taxonomy . . . 39
3.3 Execution Paths . . . 41
3.4 Execution Graphs . . . 44
3.5 Performance analysis and prediction . . . 47
4. Simulation Design and Experiment Procedures . . . . 49
4.1 Method . . . 49
4.1.1 Subjects . . . 49
4.1.2 Design . . . 49
4.1.3 Procedure . . . 53
4.2 Data Collection . . . 54
4.3 Data Analysis Procedures . . . 55
5. Data Exploration and Analysis . . . 58
5.1 Modeling inter-task transition times . . . 58
5.2 Modeling device dependencies . . . 62
5.3 Overall performance patterns . . . 63
5.5. Individual Performance Differences . . . 103
5.6 Aggregate Error Rates . . . 114
6. Discussion . . . 118
6.1 Methodological Contributions . . . 118
6.1.1 Implications of user differences to generality of device testing . . . 119
6.2 Theoretical Contributions . . . 120
6.2.1 Task Execution Graphs . . . 120
6.2.2 Creating and Upgrading Models . . . 121
6.2.3 Limitation of model . . . 122
6.3 Future Work . . . 123
6.3.1 Evaluation of novel input devices . . . 123
6.3.2 Analysis of Time/Error critical regions of applications . . . 124
6.3.3 Device recommendation for specific users . . 124
6.3.4 Analysis of disabled user’s performance . . . 125
7. List of References . . . 126
8. Appendices . . . 133
8.1 Median trial completion times and curve error factors . . . 133
8.2 Simulation code: Form1.frm (Visual Basic) . . . 134
8.3 Simulation code: Modheaderbas.bas (Visual Basic) 142 8.4 Simulation code: vectorlib.bas (Visual Basic) . 147 8.5 Simulation code: staticstuff.bas (Visual Basic) 149 8.6 Data Analysis Code: dataanal.cpp . . . 151
8.7 Data Analysis Code: dataanal.h . . . 162
8.8 Data Analysis Code: transitions.cpp . . . 166
List of Tables
Page
Chapter 4
1. Format of trials.txt file . . . 54
2. Format of test.txt file . . . 55
Chapter 5
1: Fit and analysis of variance over all subjects . 60
2. Fit and analysis of variance over all subjects
by device . . . 63
3. Summary data collected by participant . . . 64
4. Sample size and task curve fit parameters for
subject six . . . 90
List of Figures
Page
Chapter 2
1. A selection of devices plotted on Buxton’s
taxonomy [Buxton 93] . . . 24
2. A selection of devices plotted on Card et al’s.
taxonomy [Card 91] . . . 27
3. Selection using a direct pointing device
[Buxton 1990] . . . 29
4. The selection task from Foley et al. [Foley 1983] 35
Chapter 3
1: Menu selection abstract model . . . 41
2: Simplified menu selection, abstract model . . . 42
3: Generalized execution graph . . . 44
4: Execution graph for simulation . . . 45
Chapter 4
1. Participant view of a random trial . . . 50
Chapter 5
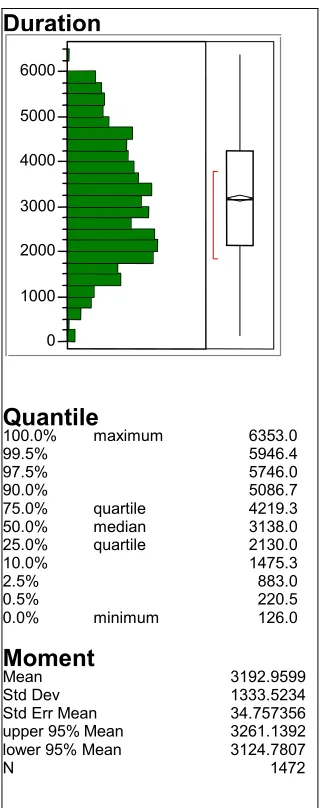
1. Oneway Analysis of Time (ms) By Transition type 61
2. Distribution by time (ms.) of selection task
with mouse across subjects . . . 65
3. Distribution by time (ms.) of selection task
with Touchpad across subjects . . . 66
4. Distribution by time (ms.) of selection task
with Trackpoint across subjects . . . 67
5. Scatter Plot with Fitts’ Law Model for Selection with Mouse across subjects . . . 68
6. Scatter Plot with Fitts’ Law Model for Selection with Touchpad across subjects . . . 69
7. Scatter Plot with Fitts’ Law Model for Selection with Trackpoint across subjects . . . 70
8. Distribution by time (ms.) of Orientation task with Mouse across subject . . . 71
9. Distribution by time (ms.) of Orientation task
with Touchpad across subjects . . . 72
10. Distribution by time (ms.) of Orientation task with Trackpoint across subjects . . . 73
11. Scatter Plot with Fitts’ Law Model for
12. Scatter Plot with Fitts’ Law Model for
Orientation with Touchpad across subjects . . 75
13. Scatter Plot with Fitts’ Law Model for
Orientation with Trackpoint across subjects . 76
14. Distribution by time (ms.) of Position task
with Mouse across subjects . . . 77
15. Distribution by time (ms.) of Position task
with Touchpad across subjects . . . 78
16. Distribution by time (ms.) of Position task
with Trackpoint across subjects . . . 79
17. Scatter Plot with Fitts’ Law Model for
Position with Mouse across subjects . . . 80
18. Scatter Plot with Fitts’ Law Model for
Position with Touchpad across subjects . . . . 81
19. Scatter Plot with Fitts’ Law Model for
Position with Trackpoint across subjects . . . 82
20. Selection task using the mouse (subject 6) . . 84
21. Selection task using the touchpad (subject 6) 84
22. Selection task using the trackpoint (subject 6) 85
23. Orientation task using the mouse (subject 6) . 85
25. Orientation task using the trackpoint
(subject 6) . . . 86
26. Position task using the mouse (subject 6) . . 87
27. Position task using the touchpad (subject 6) . 87
28. Position task using the trackpoint (subject 6) 88
29. Distribution by time (ms.) for S/DM transition with mouse (subject 6) . . . 92
30. Distribution by time (ms.) for S/DM transition
with touchpad (subject 6) . . . 93
31. Distribution by time (ms.) for S/DM transition with trackpoint (subject 6) . . . 94
32. Distribution by time (ms.) for S/P transition
with mouse (subject 6) . . . 95
33. Distribution by time (ms.) for S/P transition
with touchpad (subject 6) . . . 96
34. Distribution by time (ms.) for S/P transition
with trackpoint (subject 6) . . . 97
35. Distribution by time (ms.) for DM/S transition with mouse (subject 6) . . . 98
36. Distribution by time (ms.) for DM/S transition with touchpad (subject 6) . . . 99
37. Distribution by time (ms.) for DM/S transition
38. Distribution by time (ms.) for P/S transition
with mouse (subject 6) . . . 101
39. Distribution by time (ms.) for P/S transition
with touchpad (subject 6) . . . 102
40. Distribution by time (ms.) for P/S transition
with trackpoint (subject 6) . . . 103
41. Scatter Plot with Fitts’ Law Model for
Selection with Mouse (subject nine) . . . 104
42. Distribution by time (ms.) for DM/S transition with mouse (subject 10) . . . 107
43. Distribution by time (ms.) for P/S transition
with mouse (subject 16) . . . 108
44. Normalized performance time (ms.) for
selection task (mouse=1.0) . . . 109
45. Normalized performance time (ms.) for
orientation task (mouse=1.0) . . . 110
46. Normalized performance time (ms.) for
position task (mouse=1.0) . . . 110
47. Normalized performance time (ms.) for S/DM
transition (mouse=1.0) . . . 112
48. Normalized performance time (ms.) for S/P
49. Normalized performance time (ms.) for DM/S
transition (mouse=1.0) . . . 113
50. Normalized performance time (ms.) for P/S
1. Introduction
A graphical user interface (GUI) is a visual environment through which a user can interact
with a software application. GUIs derive their effectiveness from their support for direct
manipulation [Shneiderman, 1983]. Direct manipulation interfaces are associated with
• The visibility of objects of interest.
• The replacement of language with action.
• Incremental action and rapid feedback.
• Reversibility of actions.
• Syntactic correctness of all actions.
These properties encourage users to explore the functionality of the interface, promote
learning and retention, and enable users to gain mastery of the interface more quickly than
through most other forms of interaction.
Direct manipulation interfaces have become the dominant paradigm in human-computer
interaction, and GUIs are the most common form that they take. In a GUI, virtual objects
represent their counterparts in the domain of the application. In GUIs based on the
common desktop metaphor, for example, we find visual representations of manila folders,
paper documents, calculators, sticky notes, address books, and other office tools and
presentation are sometimes generalized as the "WIMP" model, being based on windows,
icons, menus, and a pointer (e.g., a mouse or touchpad.)
The visual representation is only part of the GUI; interaction with the GUI must support
problem-solving activities in the application domain. A desktop GUI thus supports the
dragging of file icons from one spatial location to another, representing file movement in
the directory system; a word processing GUI supports the activation of buttons that change
the visual properties of text. A key issue for developers is designing visual representations
that appropriately reflect the support of the GUI for the tasks that the user needs to carry
out. Ideally, the GUI will provide a set of conventions for interacting with the application
domain that can be easily comprehended and remembered, quickly learned, and efficiently
executed [Dix 1998].
Producing such interfaces is non-trivial. For a given GUI, significant performance
differences can arise due to natural physiological variation in users, differences in domain
knowledge and reasoning abilities between users, and differences in the ways that users
interpret the capabilities of the interface based on its visual representation. In comparing
different GUIs developed for the same task, further performance differences are due to the
alternative mappings of tasks to GUI interactions, the spatial structuring of screen elements,
and even variations in the size and appearance of those elements. The performance
properties of a given GUI are so complex and tightly interrelated that it is practically
impossible to predict them in advance, from first principles. Evaluation has thus come to
The specific evaluation issue addressed in this dissertation deals with the match between
the tasks that a user interface is designed to support and the low-level performance
properties of the physical input device through which the interaction occurs. For example,
consider the task of steering a car in a simulation. The task in this case would be indicating
one of two directions (steer left or steer right), and possibly a magnitude (e.g. bearing left
versus a hairpin left turn), depending on the simulation software. Any number of input
devices might be used for this task: a mouse, a touchpad, a joystick, arrow keys, even a
steering wheel. Intuitively, some of these devices will be more effective than the others,
especially if the task is considered in the context of other tasks that must be carried out
simultaneously, such as adjusting the speed of the car, attending to road signs, and so forth.
The problem of selecting the best match between the steering task and the input device can
involve a significant amount of analysis and empirical experience. (Early steering devices
in the history of the automobile include steering bars, steering sticks, and even leather reins
comparable to those used for horse-driven carriages; modern steering devices in prototype
cars include joysticks and immobile force sensitive steering wheels). Every year novel
computer input devices, either general-purpose or specialized for particular domains, are
described in the human-computer interaction literature, each with distinctly different
capabilities and performance differences. An important system design issue is determining
how effective an input device will be for performing a particular task with a particular GUI.
The suitability of input devices as they relate to task performance is generally evaluated by
empirical means through controlled experiments. For example, MacKenzie, Sellen, and
dragging tasks. In such experiments the user is asked to perform a task or series of tasks
with different devices to determine which one performs better for the task being evaluated.
Better is usually defined as faster task completion time or fewer errors, while errors are
usually defined by the experimenter within the context of the task being performed. For
their study MacKenzie et al. developed an experiment and wrote software that provided the
targets for the users to point at, as well as collected the data from each trial. Twelve
subjects were recruited and presented with trials of both tasks (dragging and pointing),
using four different target amplitudes with four different widths, for a total of 32 different
conditions. Once all of this data was collected, it was analyzed and adjusted to look at
movement time, error rate, movement time adjusted for errors, and fit of data to existing
performance models.
This study is an excellent model for empirical research in this area, and it has been adopted
widely in HCI. Generally, to conduct research that will yield meaningful results, it is
necessary to design and implement an experiment, recruit participants, have the participants
perform the experiment while data is being collected, and finally analyze the data to
determine the performance characteristics of the devices. Implementing the experiment
usually involves writing a customized version of the application with data logging
procedures built in. Somewhere between four and twenty subjects must be recruited and
monitored during the experiment. Once the experiment is done, the data are filtered,
aggregated, and analyzed to get a result. The MacKenzie et al. study points out a number of
broad, general findings about the performance characteristics of the above devices in
tested and it involves a higher error rate than pointing, for example. We can even conclude
that a tablet is superior to a mouse for pointing tasks but not for dragging.
For all the information that we can glean from such experiments, however, there are
significant missing elements. These provide the motivation for our research.
• Ecological validity. Interaction tasks are usually tested in isolation, for the sake of
experimental control. Real user interfaces generally involve much more complex
tasks than those used in testing the input device, however, which means that
individual tasks carried out in an experimental testbed may or may not provide a
good match for task combinations that are required in deployed interactive systems.
• Task coverage. Device evaluations almost always rely on a set of tasks that include
pointing and dragging, with many being limited to just these two tasks. The scope
of actions possible in GUIs is much wider than this; some action taxonomies include
rotation and path following as elements, for example, and it is not always clear that
these can be treated as composite tasks whose performance is precisely predictable
from an analysis of their individual component tasks.
• Standards for cross-device comparison. Although comparative studies of devices
usually lay out their procedures in clear detail, they are often implicitly tied to those
devices under consideration. When tasks and procedures are described that go
This can make it difficult for those considering the adoption of a novel device to
determine its comparative advantages in practice.
• Individual differences. By focusing on broad patterns in device comparisons,
evaluations usually neglect individual performance differences. For example, do
trends exist across users? Will all individuals that do well using a mouse will also
do well using a tablet?
This dissertation addresses these issues and a number of related questions that they raise.
1.1 Contributions
This dissertation describes the development of a conceptual framework and methodology
that will permit the evaluation of input devices in GUIs in a more meaningful context than
previous studies. We provide a procedure for the reuse of performance characteristics in
expanded domains. Individual performance differences are analyzed and their implications
for current evaluation methods are discussed. We have built an interactive simulation for
domain-independent testing of the suitability of different input devices for specific tasks,
based on the demand characteristics of the task and the performance characteristics of the
device. The simulation will allow researchers and practitioners to evaluate the suitability of
particular input devices in a given user interface with a severely restricted role for usability
testing. Using the system, it will be possible to select a device based upon optimal task
completion time or estimated error rate. In order to perform this evaluation with current
type of analysis would require an inordinate number of comparisons and time, and it would
yield an evaluation that would be of value only to the domain-specific task that was tested.
Our research provides a framework that enables a researcher or designer of interactive
systems to quickly evaluate device suitability for a wide range of tasks.
The approach taken in this dissertation involves the following steps:
• Development of a taxonomy of elemental tasks. We have identified a set of core,
fundamental tasks that users will perform in a GUI. The tasks in the taxonomy are
low-level operations that can be chained together to allow the modeling of more
complex interaction tasks. Examples of elemental tasks are key presses, clicks, and
moving the cursor to a particular location.
• Selection of representative input devices. We have chosen a representative sample
of input devices in our evaluation, each device associated with a characteristic set of
appropriate tasks. Although the input devices we have chosen are conventional,
they have not undergone the type of analysis presented in this dissertation. The set
is furthermore easily extensible to other less conventional input devices.
• Modeling: task execution paths. Once a task list and a device list have been created,
a set of execution steps can be derived for each task on a device by device basis,
assuming that the device is capable of performing the task. A series of execution
steps represents an execution path for a particular device and task pairing. We have
• Modeling: task execution graphs. We have developed task execution graphs to
combine execution paths into a concise, convenient representation. Nodes in the
graph represent states of the user interface. Outgoing arcs from each node represent
the elemental actions or steps that the user performs. Two weighting factors are
associated with the transitions in each task graph. One value represents an
execution time for the particular action represented by the transition, the other an
error probability. Task execution graphs, when parameterized in this way, can be
applied as predictive models of user performance.
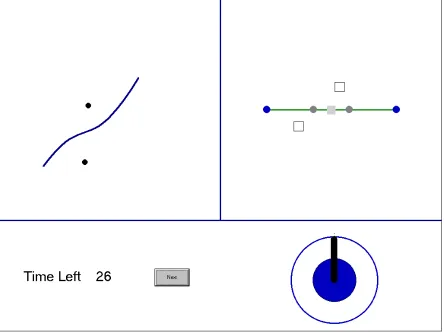
• Simulation: A GUI test bed was created with a trial presentation interface, extensive
timing, and event logging mechanisms and reporting capabilities, which permit the
observation and analysis of user actions within the test bed. The user is presented
with a series of curve matching tasks with randomized orderings and position
requirements. By altering the task orderings to complete a trial, we are able to
capture performance data for all possible combinations of task orderings and
transitions between tasks.
• Implications of user differences to conventional evaluation methods. Our results
demonstrate that individual user performance varies widely from median
performance and even with respect to the relationships between different devices.
This leads us to conclude that conventional evaluation methods are of very little
benefit in comparing device usage characteristics for substantial segments of the
The contributions of this thesis are the development of a simulation environment, the design
of a new model for representing and analyzing interaction, and the empirical results of
applying the interaction model to data produced by users using the simulation. Our
research has led to interesting findings in the area of modeling task and transition
performance, the role of individuality of user performance to prediction findings and a new
methodology for modeling user interaction. We have made contributions in the following
areas:
• Analysis: inter-task transition times. Inter-task transition times are predictable.
Models in common use in user interface performance modeling vary widely in the
level of detail at which they represent user behavior. The most popular approaches
represent tasks individually, rather than in combination. Our work shows that
individual task performance depends on the sequencing of the tasks involved, and
that this performance can be characterized naturally and concisely. The result is an
improvement in modeling accuracy with only a small increase in modeling
complexity.
• Analysis: device-dependent transition times. Transition times depend on device.
Common modeling approaches generally neglect the interactions between modeling
predictions and devices under consideration. In the keystroke level model [Card
1980], for example, pointing operations are generic, generating predictions that are
independent of whether pointing is carried out with a mouse, a touch pad, a
exist in the literature; we show how they can be incorporated into general modeling
procedures, again taking account of transitions between tasks of different types.
• User performance differences. Current evaluation methodologies do not take
individual performance characteristics into account, preferring instead to generalize
over a large population. This generalization has the effect of diminishing the
applicability of the results to any particular user in the population. We find that
while there appear to be some general trends with regards to performance, a
substantial minority of users cut against that trend.
1.2 Outline
The remainder of this thesis is organized in the following manner:
• Related Work: A review of relevant research is done. We look at studies related to
interaction and device usage in GUI’s in section two.
• Interaction modeling: In section three we present a new model for interaction in a
GUI and explain the steps necessary to construct a model and populate it with user
performance data.
• Simulation design and experiment procedures: We look at the constructional issues
related to the simulation in section four and provide details of how data was
• Data Exploration and Analysis: In section five we review the results of the analysis
of the participant data looking at task and transition based performance at the
aggregate and individual level.
2. Related Work
This proposal draws upon a large body of work in the HCI and psychology literature. We
have broken this up into six general areas of interest.
• Evaluation and calibration of input devices: Numerous studies have evaluated how
long it takes a user to complete a task and how well they are capable of doing it. The
findings of these studies inform our efforts to create a model of human performance
that supports the evaluation of device suitability in terms of task completion time
and some metric of the quality of performance. The data in these studies provide us
with a body of empirical data that we can use to both create and validate our model.
• Comparison of input devices: Many studies have analyzed the performance metrics
of a sampling of devices. We aim to extend this body of research with a new
framework for the evaluation of these devices. It is therefore important to
understand the strengths and limitations of work in this area. Each study in this area
has been done with a customized piece of experimental software, using a different
methodology and different analysis methodologies. This has the effect of limiting
the applicability of the results of these studies and diminishing the ability to
generalize about the findings. Our aim is to provide a more consistent approach to
• Device taxonomies: The range or type of input devices as well as the characteristics
that make devices similar or different have also been studied in detail. These
classification dimensions have helped us structure our model appropriately by
giving us a schema for covering the design space of relevant devices for a particular
task.
• Models of device usage: Various modeling techniques attempt to explain different
aspects of device usage through biomechanical, cognitive and probabilistic means.
These models are successful at describing device usage in different domains and
different contexts. We intend to use these models both as guidance for our model
and for verification that our model is reliable.
• Task taxonomies: Taxonomies have been developed that describe what type of tasks
are typically performed and how they are defined. We intend to use these task
taxonomies as a starting point for our model, to provide for a wide range of
evaluation conditions that might reasonably be encountered in the course of an
evaluation.
• Other Related Work: Finally, there is additional research that does not fit into any of
the categories above which we believe is important to understand the context of our
2.1 Evaluation and Calibration of Input Devices
Input devices have been evaluated for many different performance characteristics. These
evaluations have been used to determine the performance characteristics of devices, usually
with a single task, in order to uncover the underlying nature of user performance. Task
completion time has been studied extensively [Albert 1982, Card 1978, MacKenzie 1991,
MacKenzie 1992, Meyer 1988, Murata 1991, Walker 1993, Worden 1997], time to
complete a task along paths of different angles [Dulberg 1999, Jagacinski 1985], and
motion along a curved path [Accot 1997]. Error rates or mistakes in performance have also
been calculated in the above work as well as other studies. User preferences (including the
phenomenon that users may not prefer the most efficient devices) have also been examined
[Andre 1995].
A large body of literature starting with Paul Fitts’s seminal work [Fitts 1954] investigates
the time required to complete a pointing task with a variety of different of apparatus, under
a multitude of different conditions assuming expert performance with a low error rate. Most
of these works have validated some form of Fitts’ law equation, which takes the form of a
log relationship such as the following:
T=a+b log2 (2A/W)
where T is time, a and b are experimentally derived constants, A is the distance to the center
of the target, and W is the width of the target. The index of performance (IP) of a device is
1992]. Fitts' Law has been experimentally validated for a variety of tasks such as pointing,
tapping a stylus, hand movement, wrist rotation, joystick use and mouse positioning [Albert
1982, Card 1978, MacKenzie 1991, MacKenzie 1992, Meyer 1988, Murata 1991] and can
thus be used as a tool for the predictive measures of performance times for many cursor
prediction tasks. For example, MacKenzie, Sellen and Buxton [MacKenzie 1991] showed
that pointing and dragging tasks fall under the category of Fitts’ Law tasks. They also
analyzed the rate of dropping errors for the dragging task.
The log form of Fitts’ law has been the target of some investigation. Meyer et al [Meyer
1988?] is one representative sample. They proposed a stochastic optimized-submovement
model which characterizes target acquisition as a gross movement followed by a corrective
submovement. Their work yields a formula for predicted time of:
W D B A
T = + /
where A and B are experimentally derived nonnegative constants, D is distance and W is
target width. This model, like some of the other modifications to Fitts’ law yields slightly
more accurate predictions at shorter distances with very similar predictions to Fitts’ law at
longer distances. For theoretical reasons, however, the log form of Fitts’ law remains the
standard. As Newell explains it [Card 1983], the time to acquire a target is based on a
series of movements by the user until the goal is achieved. Each movement requires that the
user make use of their perceptual processor to observe where their hand or cursor is
(perceive the current state of the environment), then their cognitive processor to decide on
the action. This process is repeated n times until the goal is achieved. He goes on to show
that the relationship between the time to complete the action and the environment is based
on a logarithmic term of the distance to, and width of, the target.
Researchers do not always agree on the value of IP for a particular device. For example, the
IP of the mouse varies from 1.1 to 10.4 [MacKenzie 1991]. What accounts for this
discrepancy? Two factors are at work here: Different researchers use a different term for the
IP, and there are also quality issues with regard to the manufacture of the device. Some
mice are superior to others, employing finer quality mechanisms for the tracking of
movement, higher sampling rates to provide better feedback and perhaps a better ergonomic
shape to allow the user to manipulate the mouse more easily. We do not concern ourselves
with this aspect of device evaluation other than to demonstrate that it exists and to provide
some recommendations for compensation methods. We believe that it represents itself as a
constant factor in task performance time and so can be accounted for. What is less clear is
the effect that such differences in quality will have on errors.
2.2 Comparison of Input Devices
The comparison literature specifically looks at inter-device differences to determine which
devices are best suited to a particular task in either the time, variability of time, or error rate
dimensions. All of the following studies contain numerical results regarding device
comparisons. We have used these studies as the starting point for our model; they have also
One of the earlier papers that investigated the different performance characteristics of
various input devices was Card, English and Burr's work [Card 1978], which studied the
performance characteristics of the mouse, isometric joystick, step keys (which resemble a
diamond layout of arrow keys with a home key in the center), and text keys (which have
dedicated functionality like shortcut keys). The paper primarily looks at how rapidly and
accurately text can be selected with the four devices. The authors took five novice users
(one of whom was discarded for being significantly slower than the others) and discarded
results from the first 200 trials to control for practice effect (the subjects ran approx. 800
trials for each condition). The mouse was found to be faster and less error prone with less of
an increase in positioning time for greater distances, which is consistent with Fitts' Law.
The positioning time for the isometric joystick grew at the same rate as the mouse, but the
values were consistently higher regardless of the distance. The step keys and text keys saw
performance degrade at a much faster rate as the distance increased. The mouse had a
significantly lower error rate than the other three devices regardless of the target size.
The authors also discussed the effects of approach angle to the target. They found no
significant difference in positioning time when using a mouse regardless of the angle of
approach, whereas the other three devices had a noticeable increase in performance time as
the angle of approach to the target became more oblique, because the target was a piece of
text and hence was only one character high. The reason that they might not have found a
difference in the mouse performance was that they were only looking at the interval 0-90
degrees broken up into 3 bins (0-22.5 , 22.5-67.5 , 67.5-90) and might have missed more
Albert [Albert 1982] compared seven different input devices for accuracy, speed, and a
subjective evaluation of each device that involve a graphical input task that required the
participant to select a target. There were differences in the groups of devices that were
considered more or less direct. In this context we refer to directness as having a one to one
correspondence to the world, without an intermediary [Norman 1986]. For example, given
a drawing task, most direct to least direct approaches might include: drawing with pen and
paper; using stylus and tablet, a mouse; a joystick; a set of typed, drawing commands.
Albert found that the direct manipulation devices, a touch screen and a light pen, afforded
faster positioning speed and higher positioning accuracy than less direct devices such as
track balls and joysticks. Even within the same device, a touch screen mounted on the
display provided superior performance over one that was mounted next to the display.
Direct hand-eye coordination is presumed to be superior to indirect. A separate "enter"
button was also found to degrade the performance of participants due to the homing time
required both to context switch to the button, then return to the input device.
MacKenzie, Sellen and Buxton [MacKenzie 1991] looked at pointing and dragging tasks
with mouse, trackball and stylus. Fitts’ law modeled both tasks well with a higher IP for
pointing than dragging. The mouse was superior for dragging while the stylus was faster for
pointing. The track ball was third in both cases.
Errors were also investigated, particularly accidentally “dropping” an object while dragging
trackball was the most error prone device. There was little difference in errors across
devices for the pointing task.
Murata [Murata 1991] looked at pointing tasks and error rates between six devices. The
task was for the participants to sort five three-digit numbers. This task was paired with a
mouse, trackball, joystick, joycard, light pen and touch screen. A joycard is a type of
isometric joystick. The author used 10 naive subjects. He found that the joystick was fastest
while the light pen was most accurate. This study however only looked at these devices in
the context of a one-dimensional task. The participants were simply picking the row in
which the number was located. The author also gives no insight into whether he controlled
for learning with regard to task times. The findings in this paper run counter to previous
device comparisons in the literature.
Kurtenbach and Buxton [Kurtenbach 1993] did an evaluation of marking menus using pen
and mouse input, looking at error and response times based on the number of segments or
different selection areas in the circular pie menu and depth of submenus. A marking menu
provides a pie menu for novice users but allows experts to simply make the gesture that
corresponds to a selection in the novice menus. This gesture would correspond to the path
that would need to be traversed through the menus to make a particular selection. They
found the pen more accurate and faster than mouse input for this task. The error rate
increased as segments, depth or the combination increased while the response time
Guimbretière and Winograd [Guimbretière 2000] discuss an extension of marking menus
called FlowMenus. In a suggested usage, the menu appears with eight submenus appearing
radially arranged around the center menu at the time the menu is invoked. Using pen based
input, users can use a path to select like a marking menu but also use a path to quantify a
degree of selection based on path properties. No empirical evaluation was provided.
Douglas and Mithal [Douglas 1994] showed that isometric devices (devices which sense
pressure but don't move or change shape as a result of pressure being applied) are Fitts' Law
devices. The authors believed that a finger controlled isometric device would operate faster
than a joystick (the finger has a higher IP than the hand: Langolf 1976). This supposition
did not hold. Even though the keyboard joystick that they tested reduced homing time, it
had a longer pointing time component than the mouse. The authors question the
assumption in the Keystroke Level Model that homing time to a mouse (or other device) is
a constant by suggesting that Fitts’ law would dictate otherwise (relationship to distance of
the device from the hand).
Zhang et. al. [Zhang 1988] evaluated single and multimodal interaction in a CAD system.
Multimodal findings aside (which are beyond the scope of our model), they found that
mouse input was superior to pen based input in task completion time accuracy and
subjective satisfaction.
While all of the results described thus far in this section have been empirical, there are
some qualitative results available as well. van de Pol, Ribarsky, Hodges and Post [van de
particularly on the virtual workbench, but the findings can be generalized to other large
display immersive environments.
They mention five different types of selection interaction techniques:
• Direct Picking: The user reaches out till they actually "touch" the object in question.
This was implemented with a glove with positioning info. Direct picking was the
most intuitive and easiest selection technique but suffers from the limitation that
objects can't be out of reach.
• Ray Casting: By having a ray shoot out from the tip of a finger, the user can use
their finger like a laser pointer. This technique is useful for picking distant objects.
Feedback must be provided to the user to indicate the current position of the beam
in the virtual world; otherwise there can be discrepancies between the perceived and
actual position of the ray.
• Gaze directed selection: The user selects an object by looking at it. The ray starts
from a point mid-distance between the eyes. There is an uncited mention in the
article that it was found to be more intuitive to have the gaze point down rather than
straight ahead. A small cursor in the form of a cube is placed on the workbench
surface to provide feedback to the user. In the case of occluding objects, the closest
one is selected.
• Virtual Hands: A representation of one's hands is provided in the scene much like
direct picking; however, a nonlinear mapping technique is employed to allow the
user to select objects outside of their reach.
An unknown method was used to evaluate the effectiveness of these methods. Ray casting
was found to be most effective for distant object selection.
All of the studies that we have seen that relate to device comparisons have demonstrated
that performance is based on Fitts’ law with few minor differences. None of these studies
look at individual performance differences, concentrating instead on the overall patterns of
device usage across populations.
2.3 Taxonomies of Input Devices
A taxonomy of input devices is useful as a means for classifying and understanding the
underlying nature of input. By classifying devices according to characteristics like
dimensionality, degrees of freedom, or activation methods, the taxonomy provides insight
into the nature of how devices are used, as well as hints at where one might start looking for
similarities and differences in the performance characteristics of the devices.
Buxton [Buxton 1983] proposed a taxonomy that classifies devices along two dimensions,
the property that is sensed and the number of dimensions that the device can track (figure
mechanical or touch sensitive means. The distinction that Buxton was making is very
similar to the difference between direct and indirect manipulation, as discussed above.
The number of dimensions relates to the number of degrees of freedom along which the
device affords movement. A slider or rotary control allows or controls a single dimension
of movement, while a mouse, joystick, tablet or light pen allows motion along two
dimensions.
The properties that can be sensed are position, motion and pressure. A tablet, slider or light
pen sense position; a mouse, trackball or joystick sense motion; while an isometric joystick,
some styli on tablets and a space ball sense pressure or torque.
The device taxonomy allows us to group devices that are similar in performance
characteristics with the hope of simplifying our model. It allows us to establish relevant
relationships between devices that are close to each other in the possible design space.
One of the major drawbacks of the Buxton taxonomy is the lack of descriptive ability for
discrete devices. Without that capability, it is limited to a subset of all input devices.
Another drawback relates to the way that devices are categorized according to how they
sense input. While it might seem appropriate, there is little evidence provided to indicate
that it is a meaningful distinction. The author also mentions the notion of being able to
make analogies between devices according to their relative positions in the taxonomy.
Figure 2.1: A selection of devices plotted on Buxton’s taxonomy [Buxton 83]
Simpson and St. Amant [Simpson 2003] developed a taxonomy based on the physical
properties of devices with the idea in mind of being able to automatically find more
efficient mappings of device controls to tasks.
Foley et al. [Foley 1984] provide more of a design space rather than taxonomy for input
devices within the context of computer graphics interaction techniques. A variety of devices
commonly used in two-dimensional GUI's are described in terms of the tasks that are
commonly performed in graphics software, so devices are analyzed in terms of their ability
characteristics. For example, a mouse might be classified as excellent for selection but poor
for text entry.
Due to the informal classification scheme in the Foley paper, the possible design space of
input devices is quite constrained and somewhat arbitrary. While they have performed a
reasonable coverage of devices that were deemed appropriate for use within a GUI, the
scope of the design space is limited to devices that were in existence at the time of
publication. The Foley taxonomy is not designed to be extensible. There is also no
consideration of three-dimensional and hybrid devices that have been developed subsequent
to the publication of the paper.
Card, MacKinlay and Robertson[Card 1991, 1992] provide an interesting scheme for the
classification of devices based on the physical characteristics of the device as well as the
method of operation and interaction with said device. The Card et al. scheme classifies
devices along the following dimensions (Figure 2.2):
• Axes that can be manipulated: A rotary dial or slider can manipulate along a single
axis, a mouse or joystick can manipulate along two axes, usually referred to as x and
y, while a space ball or data glove can manipulate along all three axes
simultaneously. When manipulation along an axis is mentioned, it refers to the
device's native abilities, not what is possible with overloading functionality. There
exist seven different possible combinations for either one, two, or three axes. Of
course, many of these are functionally equivalent when we simply consider
• Linear vs. Rotary: A device either allows a user to make movements that can be
tracked in a positional manner or makes use of the angle of rotational information of
the device. A mouse is a linear device since it keeps track of the change in x and y
coordinates of movement, while a dial is a rotary device since it is controlled by
how much or how far it has been rotated. It is also possible to have hybrid devices
such as the Magellan mouse or a data glove where all six degrees of freedom are
being utilized.
• Position or Angle Utilization: If a device tracks movement or rotation it will do so
in either an absolute or relative fashion. A mouse tracks relative movement. Every
time that the mouse is polled, it reports the distance that it has moved since the last
time it was polled. On the other hand, a graphics tablet is frequently set up in
absolute mode. Each time the tablet is polled, it reports the actual location, if any, of
the stylus. There exists a correspondence between the screen and the tablet. A
mouse has no such correspondence. If a user picks up the mouse and places it down
on a different part of the desktop then no movement has taken place.
• Positional or Relative Force and Torque: For input devices that utilize force such as
a pressure sensitive stylus or space ball, the device can either measure the absolute
Figure 2.2: A selection of devices plotted on Card et al’s. taxonomy [Card 91]
The authors clearly intended that the above taxonomy be used to describe the design space
for all possible input devices regardless of practicality. As such it is capable of describing
all input devices regardless of whether they are discrete or continuous unlike the taxonomy
proposed by Buxton [Buxton 1983] and Foley [Foley 1984]. Both Buxton's and Foley's
2.4 Models of Device Usage
The modeling of device usage is concerned with arriving upon a "formal description of
activity which can be used for predicting some future activity." [Baber 1997] Several
techniques have been used. The primary focus is usually transaction time (time to complete
a specific task or subtask). Models can be used to test a particular interaction task without
the need for building the actual system and testing it with human subjects. For example,
Fitts' Law can be used to produce quantitative predictions that buttons three pixels wide are
not a good idea in an interface because the user would have a great deal of difficulty
clicking on them with a conventional mouse and hence the task completion time would be
unreasonably long. All this can be accurately predicted without writing a single line of code
or running a single subject in an experiment.
Fitts' Law [Fitts 1954] is an early model for rapid aimed pointing tasks with a low error
rate. Paul Fitts did his original work with a stylus tapping task where participants were
required to alternately tap two targets of fixed width, separated by a fixed distance, as
quickly as possible. His work has subsequently been extended to a variety of tasks
including mouse movement and dragging.
The three state device approach [Buxton 1990] takes an automata or state transition
diagram approach for the generic actions allowed by user interface widgets and interaction
devices. Examples are given to show the state diagrams for simple tasks such as selecting
(figure 2.3) and dragging. The three state device approach does not allow for the
they will have different characteristics with regards to usability. It is also limited in terms of
tasks and devices that it can describe, a pressure stylus being one example of a device that
cannot be modeled. It is possible that one could focus on the transitions and look at how
they were actually performed by the different devices. Note that the arcs in Buxton’s model
might be annotated by performance characteristics. Although not explored in his work, the
state diagrams can be expanded on by adding performance measures.
The keystroke level model (KLM) [Card 1980, 83] takes a summation of a task
decomposition approach to the prediction of task completion times. Given a particular task
A, A would be broken down into a series of elemental subtasks. Times can be computed for
each subtask and then the summation of all subtask completion times will give you the time
to complete task A. Certain constant times are used to determine the subtask times, such as
1.35 seconds per mental operation, 0.2 seconds per keystroke (based on an average typing
speed of 55 words per minute), or 1.1 seconds to move the cursor to a particular area. The
KLM has advantages as well as disadvantages in predicting user performance. It is fairly
easy to apply if a task decomposition can be created. It gives a fairly reasonable
approximation of actual performance [Baber 1997, Card 1983] but does not account for the
wide differences in individual performance. There is a lot of disagreement as to what the
appropriate constant values should be for different devices. Different constants have been
used [Card 1978, Epps 1986, MacKenzie 1991] for different devices to provide a greater or
lesser degree of fidelity to the actual user performance. This suggests that perhaps the
keystroke model does not always capture the essence of the task that is being measured.
For example, one assumption is that tasks are practiced and efficient; there is no
accommodation for users stopping to think about what to do next. In addition, there is also
the question of equivalence of devices. Two mice, for example, might not have the same
performance characteristics and would therefore require different weights [Buxton 1986].
Markov chain models are based on the idea that it is possible to describe the interaction
between a user and a device with a finite state machine. If each one of these actions takes a
Probabilities can be assigned to these transitions. An expected duration can then be
calculated by looking for the most likely path through the state diagram given that the user
is trying to accomplish a particular task. This method is most frequently used in voice
recognition systems [Rudnicky 1991].
Task network models are similar to Markov models in that they have states with projected
task completion time except that they are constrained by time; they expect action to occur
within a specified period of time [Baber 1997]. The time constraint is used to allow for the
inclusion of an error factor for unsuccessful completion within the projected time.
In some ways both of these approaches are similar to the KLM approach, with the inclusion
of probabilities between transitions. In addition, differences in performance can be modeled
with the possibility that different paths are taken.
GOMS (Goals, Operators, Methods, Selection) and the Model Human Processor (MHP)
[Card 1983] incorporate an approach to modeling that consists of three basic components:
The MHP which attempts to describe the cognitive aspects of the process that humans use
to store and retrieve information as well as process and act upon the information, a set of
tasks with a description of the knowledge required by the human to perform them, and a set
of performance times to allow performance prediction much like the KLM. The MHP is a
systems level way of describing the human mind. It consists of three subsystems: the
perceptual system which brings sensory information into the MHP, the motor system which
between the perceptual system and the motor system as well as solving more complex
problems requiring stored information and goal formation.
GOMS suffers from a number of different drawbacks. One problem is that it is a serial
based model and so does not allow for any parallelism in the MHP. It is not clear to what
extent a human may be forming the intention for a goal while still processing the results of
a previous action. What is clear is that some form of parallelism does occur [Olsen 1990].
GOMS also does not factor in or account for error. Even expert performance is not error
free. Finally GOMS is also subject to a high degree of complexity particularly when
alternative means of task completion are taken into account.
The Cognitive Complexity Theory (CCT) [Kieras 1986] extends GOMS by adding
production rules to describe the user knowledge and a state transition diagram of the
system. CCT suffers from many of the same problems as GOMS and has not been
empirically evaluated [Knowles 1988] although it is still in use for its qualitative properties.
Cognitive models such as EPIC [Hornof 1999] are frequently employed for the purpose of
simulating human interaction in a system. EPIC requires as inputs to its system a cognitive
strategy to complete a task, the perceptual features of the interface and the details of the
task environment. While models like EPIC are useful tools to understand the nature of an
interaction with a system, they require too much a priori knowledge of what the user wishes
to do. The direction of our research is not concerned with predicting a user's intent but
Different models may be more appropriate for different research goals. Fitts' Law may be
very useful for predicting performance time for elemental pointing tasks and gives
designers valuable guidance as to positioning and size criteria of controls in interfaces. The
KLM or GOMS are more useful for representing more complex interactions with interfaces.
Markov models are particularly useful for speech recognition or for probabilistically
calculating likely user intent, while task network models are frequently used to measure
error as opposed to task completion time. Cognitive models are useful for simulating human
interaction with a system. Some of these models are composites of other simpler modeling
techniques. For example, KLM or GMS incorporate aspects of Fitts’ Law in their models.
2.5 Task Taxonomies
Very little work has been done in the area of developing a task taxonomy that can be used
to specify the range of user actions in a GUI. By range of user actions we mean a complete
description or taxonomy of possible interaction methods and tasks that can be accomplished
in a GUI without consideration of context. To our knowledge, there is no prior work that
adequately describes the full range of tasks or actions possible in a GUI and provides a
framework for evaluating their similarities and differences although Simpson and St. Amant
[Simpson 2003] are using a set of low level tasks called positioning, orientation and
confirmation as a set of basic primitives to build larger tasks. There are however quite a
number of articles that mention specific tasks within the context of performance evaluation.
Unfortunately the definition of a task is not clearly agreed upon, so some work looks at
seem specific to a particular interface. For example, Szalavari [Szalavari 1998] mentions
Navigation, System control and Object manipulation as possible user tasks. Poupyrev
[Poupyrev 1996] investigated methods for Manipulation and Selection of objects. Some
work takes a more elemental view of tasks and considers cursor movement [Shneiderman
1983], pointing, and typing [Graham 1996, Douglas 1994] to be primary tasks. We are
looking for a middle level task taxonomy that will permit us to express a reasonably
complete set of user interactions in a GUI without having to resort to a complete task
decomposition scheme that would require an unwieldy amount of task analysis before
someone could use our system.
Foley [1984] has what appears to be a comprehensive set of tasks as they relate to
interaction in a graphics package:
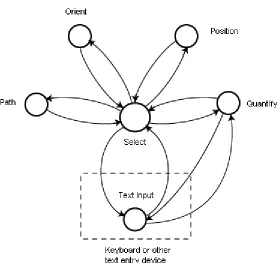
• Select: Select from a finite set of alternatives (see Figure 2.4)
• Position: Indicate a position on an interactive display
• Orient: Manipulate the angle of orientation of an object in two space or three space
• Path: Generate a series of points or orientations over time (Considered distinct
because of time dimension)
• Quantify: Specify a quantity either through text input or manipulation of a control
Figure 2.4: The selection task from Foley et al. [Foley 1984]
The related work described has done a good job of advancing the field to the point where it
is possible to develop the system that we are proposing. A lot of work has been done in the
area of evaluation and calibration that can be used both for the purpose of model
construction and model validation by making sure that it is consistent with earlier research.
model. They all suffer however from a lack of generality that can be overcome by making
the results more applicable to complex systems rather than simply focusing on a specific,
narrowly defined task.
We use prior device taxonomy work to clarify likely differences in performance based on
the differences in the underlying device, to aid us in developing our model. All of our work
is experimentally validated. Since it is not provable that these taxonomies are indicative of
performance, they merely serve as descriptors of the possible design space of input devices.
The task taxonomy work that we have looked at serves as a starting point for the task
descriptions that we develop for our model. Since we are not suggesting that we can
describe this area in its entirety, we are not concerned with the lack of empirical evaluation
in this area.
2.6 Other Related Work
Not all GUI interaction situations can be modeled accurately without greatly increasing the
complexity of the model. For example, Farris et. al. [Farris 2001] describe a situation where
targets can be placed at the edges of the screen to decrease target acquisition time.
Placement of targets at the edge of the screen (with no pixel border between the edge and
the target) is superior because it eliminates overshoot and theoretically allows users to
maintain velocity rather than slowing as they approach the target [Tognazzini 1999],
although in practice users still slowed down as if they were approaching a non-edge target.
Techniques such as this can be incorporated into our model with a corresponding increase
we feel that it is not desirable to add special cases such as edge targets since it will yield
marginal improvements in model accuracy but a combinatorial increase in the complexity
of the model. After adding relatively few special cases, the effort required to build a model
will eclipse the cost of testing the actual system.
Accot and Zhai [Accot 2001] investigated control gain and scale between monitor and input
device in steering law tasks. They determined that the error rate went up sharply for both
linear and steering law tasks as scale was increased. There was a less pronounced but
significant decrease in Index of Performance indicating that increasing scale above a factor
of two was detrimental to both performance time and accuracy in either type of task. Our
model handles interaction issues such as these through device specific calibration. The
same mouse set to two different C/D ratios is considered to be two different devices.
Various work has looked at optimization of target layout to minimize interaction time
[Schmitt 1999, Tognazzini 1999]. With the exception of techniques that “overcome” Fitts’
Law by altering characteristics such as gain [Worden 1997] or edge placement, these
techniques are simply optimizations of Fitts’ Law and are subsumed in our model. While
our model is designed to give an overall measure of suitability to purpose for the various
interactions possible in a GUI given a particular device, the optimization literature tends to
take a more frequency of task approach, optimizing the time and error rate for more
frequently performed tasks while allowing sparsely used functions to be more difficult.
These types of studies are more germane to particular interfaces while we strive for a
Douglas et. al. [Douglas 1999] investigated the predictive power of the ISO 9241, Part 9
Draft International Standard for testing computer pointing devices for performance and
comfort [ISO Draft 1999, Final 2000]. While the ISO standard addresses a variety of
ergonomic issues related to muscle load and fatigue, which are beyond the scope of our
model, it does little to address the suitability to task of a particular device. Its greatest
contribution perhaps is to specify a particular framework for the experimental evaluation of
devices to conform to a range of biomechanical parameters and to develop a single
instrument for the evaluation of subjective user comfort. This will obviously have the
benefit of permitting more cross-study comparisons which is also a goal of our work.
Douglas et. al. have determined that there are a number of areas in which the ISO standard
still falls short of its goal, particularly in experimental evaluation.
MacKenzie et. Al. [MacKenzie 2001] take a novel approach to evaluating accuracy of
pointing devices. Rather than looking at a single error measure they propose seven new
accuracy measures that are designed to elicit more subtle differences between devices. All
of these quantitative measures look at some aspect of the deviation between a “perfect”
target selection task and actual performance. The measures are designed to allow the
researcher to augment an error rate, which simply gives you the magnitude of the problem
with the ability to measure why the problem is occurring. For example, is a high error rate
the result of a lack of smoothness in motion or a propensity for a device to allow cursor
acceleration thus overshooting the target? While this work is fascinating and will likely lead
to a better understanding of design tradeoffs in input devices, it is beyond the scope of our
3. Interaction Modeling
3.1 Introduction
In this section we describe an interaction model that provides our methodology for
analyzing user actions. The model has several components. It relies on a taxonomy of
elementary interaction tasks, and supports quantitative predictions of execution
performance. The model is based on the concept of execution graphs, in which user actions
are interpreted as transitions along weighted edges in a graph. A complete traversal of an
execution graph produces a prediction of performance in terms of duration or error rate.
The parameterization (i.e., the specific edge weights) of an execution graph depends on the
properties of a specific input device.
3.2 Task Taxonomy
We have identified a set of core, fundamental tasks that users will perform in a GUI. This
set is an extension of existing task taxonomies taken from the literature. The taxonomy is
not restrictive; it allows extension to new tasks as needed by the evaluator, by following a
methodology outlined below. For generality, the tasks in the taxonomy are of a fairly
primitive nature; they can be chained together to allow the modeling of more complex tasks
in an interface.
We have looked for a balance between the range of expressiveness permitted and the degree
of complexity that our taxonomy imposes upon the specification of a task. At one extreme,
as the KLM. This would force an unnecessary degree of complexity upon the user of our
modeling system; and would therefore add only marginal value to what already exists with
the KLM. At the other extreme, we might have described and provided measurements for
high-level application specific tasks. Doing so would eliminate what we see as one of the
key advantages of our system, the promise of generality across applications. By tying our
tasks to specific applications, it would be necessary to define an arbitrarily large number of
tasks and then perform an exhaustive series of tests to validate each task. This sort of brute
force approach will not work in the changing world of interface development, nor would it
provide any real benefit over prototyping and usability testing.
The direction we have therefore chosen is to provide the system evaluator with a reasonable
set of tasks that will successfully model higher-level tasks. We provide a set of three tasks
that can be chained together to model more complex tasks. We also provide a means for
the extension of our model by way of adding additional tasks to our task set to meet the
changing nature of interface design and input devices.
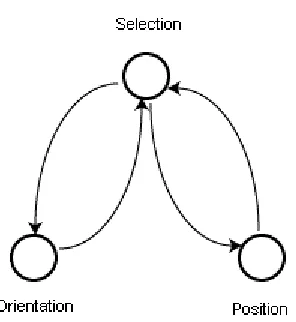
For the purposes of this study we defined the actions selection, position and orient as
follows:
• Selection: A cursor movement starting with a minimum of a 3 pixel movement
[Worden 1997], ending with an activation while the cursor was on a target.
• Position: Movement of a target from position A to position B. Position is commonly
![Figure 2.1: A selection of devices plotted on Buxton’s taxonomy [Buxton 83]](https://thumb-us.123doks.com/thumbv2/123dok_us/1745344.1223493/37.612.101.522.80.398/figure-selection-devices-plotted-buxton-s-taxonomy-buxton.webp)
![Figure 2.2: A selection of devices plotted on Card et al’s. taxonomy [Card 91]](https://thumb-us.123doks.com/thumbv2/123dok_us/1745344.1223493/40.612.94.523.77.348/figure-selection-devices-plotted-card-et-taxonomy-card.webp)
![Figure 2.3: Selection using a direct pointing device [Buxton 1990]](https://thumb-us.123doks.com/thumbv2/123dok_us/1745344.1223493/42.612.101.518.292.540/figure-selection-using-direct-pointing-device-buxton.webp)
![Figure 2.4: The selection task from Foley et al. [Foley 1984]](https://thumb-us.123doks.com/thumbv2/123dok_us/1745344.1223493/48.612.93.527.119.397/figure-selection-task-foley-et-al-foley.webp)