PATIENT SAFETY
Can Iterative Reconstruction Improve Imaging Quality for
Lower Radiation CT Perfusion? Initial Experience
C.J. Lin, T.H. Wu, C.H. Lin, S.C. Hung, C.F. Chiu, M.-J. Liu, M.M.H. Teng, F.C. Chang, W.Y. Guo, and C.Y. Chang
ABSTRACT
BACKGROUND AND PURPOSE: Initial results using IR for CT of the head showed satisfactory subjective and objective imaging quality with a 20 – 40% radiation dose reduction. The aim of our study was to compare the influence of IR and FBP algorithms on perfusion parameters at standard and lowered doses of CTP.
MATERIALS AND METHODS: Forty patients with unilateral carotid stenosis post– carotid stent placement referred for follow-up CTP were divided into 2 groups (tube currents were 100 mAs in group A and 80 mAs in group B). Datasets were reconstructed with IR and FBP algorithms; and SNRs of gray matter, white matter, and arterial and venous ROIs were compared. CBF, CBV, and MTT means and SNRs were evaluated by using linear regression, and qualitative imaging scores were compared across the 2 algorithms.
RESULTS:The mean effective radiation dose of group B (2.06 mSv) was approximately 20% lower than that of group A (2.56 mSv). SNRs for ROIs in the dynamic contrast-enhanced images were significantly higher than those for the FBP images. Correlations of the SNRs for CBF, CBV, and MTT across the 2 algorithms were moderate (R2⫽0.46, 0.23, and 0.44, respectively). ROIs in gray matter rather than the IR algorithm predicted increasing SNRs in all CBF, CBV, and MTT maps. Two cases of significant restenosis were confirmed in both algorithms. CBV, CBF, and MTT imaging scores did not differ significantly across algorithms or groups.
CONCLUSIONS: Lower dose CTP (20% below normal dose) without IR can effectively identify oligemic tissue in poststenting follow-up. IR does not alter the absolute values or increase the SNRs of perfusion parameters. Other methods should be attempted to improve SNRs in settings with low tube currents.
ABBREVIATIONS:FBP⫽filtered back-projection; IR⫽iterative reconstruction; Tmax⫽time point of maximal enhancement; VOF⫽venous output function
I
R has been shown to be an effective reconstruction method for improving imaging quality at low radiation doses in CT of the chest and abdomen.1-3Current IR techniques attempt toformu-late image reconstruction as an optimization problem in both signal space and imaging space. The noisiest measurements are given low weight in the iterative process by an intensive comput-erized process and, therefore, contribute very little to the final image.4Initial results by using IR for CT of the head showed
satisfactory subjective and objective imaging quality with a 20%– 40% radiation dose reduction.3,5,6 An integrated IR algorithm
iDose4(Philips Healthcare, Best, the Netherlands) has recently
been developed, which consists of the following 2 de-noising components: an iterative maximum likelihood-type sinogram restoration method based on Poisson noise distribution and a local structure model fitting on image data that iteratively de-creases the uncorrelated noise. In clinical practice, the users can adjust the image noise by inputting a parameter called “iDose level.”7
In 2009, the FDA raised concern about the radiation dose ac-companying brain CTP in daily neurovascular examinations.8
CTP has been widely used to evaluate hemodynamic changes in the brains of patients with stenotic-occlusive diseases and those with subarachnoid hemorrhage.9,10In combination with CT
an-giography, it serves as an excellent triage tool for patients with acute ischemic insults who may benefit from thrombolytic ther-apy within and beyond the therapeutic time window.11,12With
quick acquisition processes and lower radiation doses, CTP serves as a potential peritherapeutic hemodynamic monitoring tool for patients with neurovascular disorders.
Received August 31, 2012; accepted after revision October 10.
From the Department of Radiology (C.J.L., S.C.H., C.F.C., M.-J.L., M.M.H.T., F.C.C., W.Y.G., C.Y.C.), Taipei Veterans General Hospital, Taipei, Taiwan; School of Medicine (C.J.L., S.C.H., C.F.C., M.-J.L., M.M.H.T., F.C.C., W.Y.G., C.Y.C.) and De-partment of Biomedical Imaging and Radiological Sciences (T.H.W.), National Yang-Ming University, Taipei, Taiwan; and Graduate Institute of Epidemiology and Preventive Medicine (C.H.L.), National Taiwan University, Taipei, Taiwan. Please address correspondence to Sheng Che Hung, MD, Department of Radiol-ogy, Taipei Veterans General Hospital, No. 201, Sec. II, Shipai Rd, Taipei, 11217 Tai-wan; e-mail: [email protected]
There are 2 approaches to lowering radiation doses during CTP. Prolonged scanning intervals can reduce the dose by 25%– 58%, depending on the frequency of sampling on the time-atten-uation curve. For a fixed sampling frequency, the radiation dose of diagnostic-qualitative MTT mapping can be decreased to 58.3%.13,14For an alternative sampling frequency in the arterial
and venous phases, the maximum interval to provide an absolute CBF value is 1.5 seconds in the arterial phase and 3 seconds in the venous phase, resulting in a dose reduction of approximately 38%.14-16Keeping the kilovolt(peak) at the level of 80 is
recom-mended to provide the best contrast-to-noise ratio for CTP.17
These temporal variables dominate the SNRs in CTP.16Lowering
the tube current is the second method used to decrease the radi-ation dose. Its influence on hemodynamic parameters such as CBV, CBF, and MTT is not well-understood. The aim of this study was to explore the effects of IR on the imaging quality of primary enhanced images and color maps of hemodynamic pa-rameters in CTP in a setting of lower tube currents.
MATERIALS AND METHODS
Patient Selection
The local institutional review board approved the study. In-formed consent was obtained before CTP. From February to April 2012, forty-two patients with unilateral carotid stenosis who had undergone stent placement from 6 to 12 months before the start of the study were referred for regular follow-up of CTA and CTP and were prospectively enrolled in our study. One patient with poor heart function and 1 with poor renal function were ex-cluded. All patients were randomly assigned to 1 of 2 subgroups. Group A underwent CTP with a standard radiation dose at a tube kilovolt(peak) of 80 and a tube current of 100 mAs. Group B underwent CTP with a reduced radiation dose at a tube kilovolt-(peak) of 80 and a tube current of 80 mAs.
CTP Acquisition and Dataset Reconstruction
All examinations were performed on the Brilliance iCT scanner (Philips Healthcare). The CT perfusion protocol was as follows: FOV, 20 cm; matrix, 512⫻512; scan range, 8 cm from the sella floor to the high vertex. Each scan lasted 60 seconds with a fixed temporal resolution of 1.5 seconds in both the arterial and venous phases. A total of 40 mL of contrast (iopromide, Ultravist 370; Schering, Berlin, Germany) was injected via the right antecubital vein at a rate of 5 mL/s. The scanning time started 5 seconds after the initiation of contrast. Besides the regular images recon-structed with FBP, the original datasets were programmed to au-tomatically reconstruct another set of source images by IR directly from the CT console. In general, the optimal level (n) of iDose4
used to compensate for the reduced SNR of the reconstructed imaging is according to the reduced radiation ([10n⫹10]%). However, this does not necessarily imply that the same percentage of IR in combination with FBP was introduced. For example, to achieve the equivalent SNR as standard CTP, iDose level 1 should be used to compensate for a deteriorated SNR when the effective dose is decreased by 20%. The exact IR percentage is not revealed by the program. Nevertheless, in our study, we used iDose4level 5
for 2 reasons: First, the initial dose-reduction escalation was set as low as the tube current, equal to 40 mA (the optimal iDose4level
is 5). However, the first several cases in this group showed unac-ceptable imaging quality and thus were prematurely terminated. Second, because the main purpose of our study was to determine the effect of IR on the imaging quality of the hemodynamic pa-rameters, we universally used the highest level of iDose4to
max-imize the effect of IR and facilitate comparison among all subgroups.
Imaging Postprocessing
The 2 datasets were postprocessed on the workstation (Aquarius, Version 4.4.7; TeraRecon, Foster City, California) for brain per-fusion analysis by using a deconvolution method to obtain color maps of the CBV, CBF, and MTT. The arterial region of interest for the arterial input function was placed at the second segment of the anterior cerebral artery, and the venous region of interest for the VOF was placed within the superior sagittal sinus at the same plane. To minimize the selection bias for the arterial input func-tion and VOF between 2 reconstrucfunc-tion algorithms, the determi-nation of arterial and venous ROIs was manually duplicated by side-by-side comparison and set to include the whole cross-sec-tion of intended vessels.
For analysis of imaging quality of axial 5-mm dynamic con-trast-enhanced images, 5 ROIs at the level where the ventricles and the basal ganglia can be seen optimally at Tmax were manu-ally chosen bilatermanu-ally (Fig 1). These 5 ROIs were frontal white matter, occipital white matter, the head of the caudate nucleus, the lentiform nucleus, and the thalamus. We excluded ROIs lo-cated in the area of encephalomalacia and postischemic parenchy-mal changes. The arterial and venous regions of interest at their respective Tmax time points were also included for analysis. Five corresponding ROIs in the color maps of CBV, CBF, and MTT were chosen for intergroup comparison (Fig 2A–C). The sizes of ROIs in the brain parenchyma were created equally in both algo-rithms and set to 25– 40 mm2. The SNR of each region of interest
was defined as its mean divided by its SD.
Quantitative and Qualitative Analysis
For quantitative analysis, the mean values in each region of inter-est in the axial maximal enhanced image were compared between the 2 reconstruction algorithms. The correlations of means and SNRs of individual ROIs between the 2 reconstruction algorithms
[image:2.594.336.494.46.190.2]for the 3 perfusion maps (CBV, CBF, and MTT) were also com-pared. We used the general linear model to evaluate the SNRs. For predictor variables, we used tube current (100 and 80 mAs), the 2 algorithms, the ROIs in white and gray matter, and the peak arte-rial and venous enhancement. Previous literature indicated that the latter 2 could influence the SNR of perfusion maps; thus, they were also enrolled in analysis.18For the qualitative assessment, we
modified the method proposed by Abels et al,13and rated the
color-coded perfusion maps (CBV, CBF, and MTT) on a 3-point scale (0⫽poor, 1⫽fair, and 2⫽adequate) for 3 features: gray-white differentiation, homogeneity, and severity of artifacts. The
scores for the 3 features were added, re-sulting in a maximum score of 6.
Two neuroradiologists with 5 and 3 years’ experience interpreted the perfu-sion imaging. They were not aware of the reconstruction algorithms used or the subgroups of the perfusion. Statistical analysis was conducted with the Statistical Package for the Social Sciences software, Version 16.0 (SPSS, Chicago, Illinois). We used pairedttests to compare differ-ences in SNRs in enhanced imaging be-tween 2 algorithms and 1-samplettests to compare the differ-ences in imaging scores for the perfusion maps between subgroups. Pearson correlation coefficients were used to compare mean values and SNRs for each region of interest in the perfusion maps for the 2 reconstructive algorithms.
RESULTS
Patient Demographics, Radiation Dose, and Time-Attenuation Curve Analysis
There were no significant differences in patient age, sex, Tmax, or peak enhancement of arterial and venous ROIs between the 2 groups (Table 1). The CTDI and effective dose in group B were significantly lower than those in group A. There were 2 significant restenoses identified by CT angiography and CTP and confirmed by digital subtraction angiography.
Imaging Quality of Dynamic Enhanced Images and CTP Color Maps
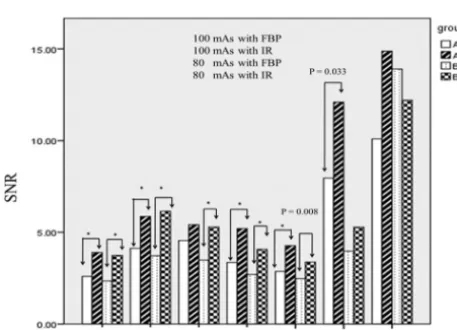
For both group A and B, SNRs of all intraparenchymal ROIs re-constructed by IR were significantly superior to those recon-structed by FBP, except for the lentiform nucleus ROI3 in group A (Fig 3). Arterial and venous ROIs reconstructed by IR demon-strated superior SNRs compared with those reconstructed by FBP, but only arterial ROIs in group A showed significant differ-ences (P⫽.03). With a reduced tube current of 80 mAs, the SNRs of all ROIs within the brain parenchyma reconstructed by IR were still significantly higher than those obtained at a tube current of 100 mAs reconstructed by FBP. For perfusion color-map analysis, the mean value correlations for CBF, CBV, and MTT across the 2 reconstruction algorithms all demonstrated good correlations
FIG 2. CBV (A), CBF (B), and MTT (C) of lower dose CTP (tube current is 80 mAs, group B) in a 61-year-old man, 6 months after receiving a right carotid artery stent.
[image:3.594.55.534.47.197.2]FIG 3. The mean SNR of individual ROIs in axial-enhanced imaging at Tmax reconstructed by IR and FBP in groups A and B (group A: 100 mAs with FBP; group A: 100 mAs with IR; group B: 80 mAs with FBP; group B: 80 mAs with IR. Asterisk indicatesPvalue⬍.001).
Table 1: Patient characteristics and radiation dose in CT protocols with standard and low tube currents
Subject Characteristic
Group A (Tube Current = 100 mAs)
Group B (Tube Current = 80 mAs)
P
Value
Age 74.9 74.2 .48
Sex (M/F) 14/6 14/6 1
Tmax (second) 12.5⫹2.34 12.3⫹2.83. .53
Maximium HU of A2a 159.84 177.6 .13
CTDI (mGy) 153.56⫹0.03 128.17⫹0.03 ⬍.001
DLP (mGy/cm) 1229⫹0.26 985⫹0.6 ⬍.001
Effective dose (mSv) 2.56 mSv 2.06 mSv ⬍.001
Note:— Tmax indicates the time point of maximal enhancement of anterior cerebral artery; DLP, dose-length product.
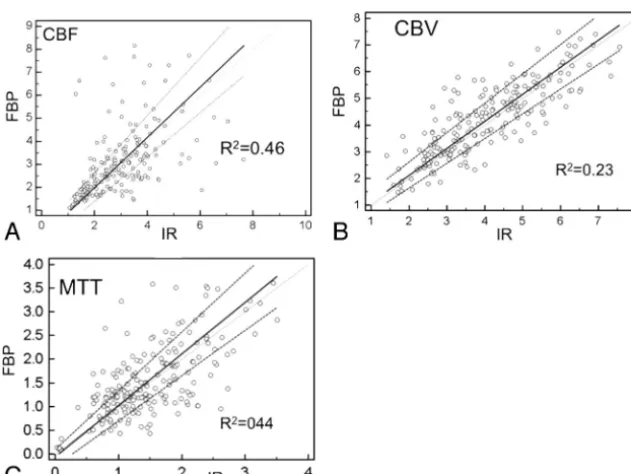
[image:3.594.54.372.253.346.2] [image:3.594.54.283.377.542.2](R2⫽0.82, 0.69, and 0.67, respectively) (Fig 4). The SNR
corre-lations for CBF, CBV, and MTT across the 2 reconstruction algo-rithms were moderate (R2⫽0.46, 0.23, and 0.44, respectively),
regardless of the milliampere-second used or locations (Fig 5). Results from the general linear regression model showed that the gray matter region of interest was the only independent vari-able to enhance SNRs in the CBF and CBV maps. For the MTT maps, region of interest in the gray matter, tube current of 100 mAs, and arterial and venous peak enhancement were all found to enhance the SNRs. However, there were no differences in any of
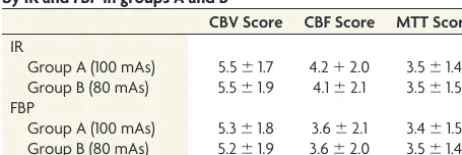
the 3 maps in SNR between IR and FBP (Table 2). For color-map interpreta-tions, thevalue between the 2 readers was 0.73. The CBF imaging quality score was nonsignificantly lower in group A compared with group B, regardless of the reconstructive algorithm. For CBV and MTT, there was no difference in subjective imaging quality between stan-dard and lower dose CTP, regardless of the reconstructive algorithms (Table 3).
DISCUSSION
Normalization of hemodynamic charac-teristics between 2 groups is challenging in small patient populations. To the best of our knowledge, no commercial inter-face currently provides a simple variable to represent the shape of the contrast bo-lus passage (ie, time-attenuation curve). We used the Tmax and maximum Hounsfield units of the arterial region of interest as 2 surrogates to describe the time-attenuation curve with a fixed in-jected contrast volume and rate.19,20
Pa-tients with poorer heart function dem-onstrated more prolonged Tmax and lower Hounsfield unit values in the arte-rial ROIs. In our study, there were no differences in Tmax and Hounsfield units between the 2 groups, which might have indicated that hemodynamics could affect subsequent analysis. Finally, we applied deconvolution methods, which, unlike the maximum slope method, are insensitive to heart func-tion,21,22 to acquire the perfusion
parameters.
All ROIs in both gray and white mat-ter in axial dynamic contrast-enhanced images demonstrated better SNRs when reconstructed by IR than by FBP, except those in the lentiform nucleus in group A. Our explanation is that the enhanced lenticulostriate arteries within the se-lected ROIs increased the SD in the com-parison of means and thereafter resulted in a trend of better SNR, which nonethe-less failed to achieve significance. During the deconvolution algo-rithm, the signal intensity reflecting the concentration of contrast in the ROIs was the dependent variable in the formula, which theoretically could change the values of CBV and CBF.23Our
study demonstrated that the changes were not significant and showed good correlation between the 2 algorithms. The differ-ences were even smaller than interobserver and intraobserver variabilities reported in the literature.24,25
Earlier research has shown that the SNRs of the perfusion maps can be affected by the placement of arterial and venous
FIG 4. The mean values of individual ROIs in CBV (A), CBF (B), and MTT (C) reconstructed by IR and FBP (x-axis: mean value of IR; y-axis: mean value of FBP).
[image:4.594.57.372.55.293.2] [image:4.594.56.372.340.577.2]ROIs.18The superior sagittal sinus is close to the skull and thus its
image can be potentially degraded by beam-hardening artifacts when low kilovolt(peak) and milliampere-second settings are used. This phenomenon is more evident in the skull base or the higher convexity due to greater skull thickness. In our study, we did not find similar correlations in CBF and CBV maps. However, MTT maps seem to be the most susceptible of the 3 parameters to different factors in our and other studies.15,16,18We also found
more oscillating time-attenuation curve waves and lower SNRs in the superior sagittal sinus when 80-mAs tube current was used, but the difference between the standard and low mAs groups did not reach significance. Age is another factor that should be taken into consideration because osteosclerotic changes in the skull are more common in the aged population. Manual check of the proper position of VOF to avoid such influence of artifacts should be carefully performed in the setting of lower dose CTP.
IR algorithms are increasingly used in CT imaging due to con-tinuous improvement in computer hardware and software. The advantage of this technique is its noise reduction. In general, the higher percentage of IR (the higher level of iDose4) with which
the dataset is reconstructed, the higher SNR it achieves. Its major drawback is a smoothing effect near the boundaries, producing an “oil-painting” appearance.26,27As a result, 100% IR is not used in
daily practice due to its unrecognized imaging texture. However, in CTP, the hemodynamic parameters rather than the regional tissue characteristics are the major concerns. Thus, this algorithm is increasingly being adopted to enhance the performance of lower dose CTP.28
The moderate correlations of the SNRs in CBV, CBF, and MTT were lower than expected, probably due to the region-of-interest selection bias. Currently available software in our institu-tion cannot provide automatic side-by-side region-of-interest comparison of 2 different perfusion datasets; thus, manual selec-tion was required, which may have increased the intra- and inter-observer variabilities. This effect was most profound in the
arte-rial and venous ROIs due to relatively high noise caused by concentrated iodine, which led to different arterial input func-tions and thus changed the subsequent variables, including CBV, CBF, and MTT.
Our case number was relatively small, and further investiga-tion with a larger patient populainvestiga-tion is needed. Our sample con-sisted of patients undergoing post– carotid stent placement fol-low-up procedures. Two cases of restenosis were successfully confirmed by perfusion maps. However, clinical applications of lower dose CT in acute stroke with color-coded perfusion imag-ing deserve further validation. It should be feasible because the difference between normal and infarcted tissues is more evident than that between normal and oligemic tissue.
To our knowledge, this is the first study to explore the rela-tionship between IR and perfusion parameters in CTP. In our initial experience, lower dose CTP can save up to 20% of the dose with the same perfusion parameters regardless of the reconstruc-tion algorithm used. It will potentially enhance its applicareconstruc-tions in peritherapeutic monitoring of hemodynamic changes while treat-ing neurovascular disorders. For example, it may be of use in selecting patients with cerebrovascular insults who will poten-tially benefit from thrombolytic therapy beyond current thera-peutic windows or in predicting clinical outcome so as to tailor further management.29,30Furthermore, the improved SNRs from
the lower dose CTP dataset may diminish the noise of reformatted CTA in selected patients with acute ischemic insults. However, its accuracy in detecting aneurysms or other vascular anomalies de-serves further investigation.31The sequential hemodynamic
in-formation may further trim the performance of 3D-DSA by elim-inating the unwanted venous structures. This may open a door to reducing the radiation dose for the comprehensive CT protocols in patients with neurovascular disorders.32On the other hand,
although IR algorithms increased the SNRs of axial imaging, they did not restore imaging quality in cases in which the original da-taset was deteriorated by artifacts when further low milliampere-seconds were attempted. Other methods to improve imaging quality should be explored.
CONCLUSIONS
[image:5.594.55.533.63.153.2]Use of IR algorithms can achieve better SNRs in dynamic enhanc-ing imagenhanc-ing with a 20% reduction in radiation dose and is a prom-ising approach to improve the imaging quality of reformatted CTA. Meanwhile, it does not alter the absolute values or increase the SNRs in the CBF, CBV, and MTT color maps. The subjective
Table 2: General linear regression of SNR in CBV, CBF, and MTT values among different tube currents, locations, reconstructive algorithms, and peak arterial and venous enhancement
SNR of CBF SNR of CBV SNR of MTT
Standardized
Estimate PValue
Standardized
Estimate PValue
Standardized
Estimate PValue
80 mAsa 0.043 .412 0.016 .747 ⫺0.121 .031d
IR reconstructionb ⫺0.008 .872 0.002 .655 0.007 .887
Gray matterc 0.443 ⬍.001d 0.515 ⬍.001d ⫺0.203 ⬍.001d
Peak enhancement of arterial ROI 0.055 .286 0.064 .195 ⫺.178 .001d
Peak enhancement of venous ROI 0.017 .754 0.043 .408 ⫺0.163 .005d
aThe control group has a tube current of 100 mAs.
b
The control group is processed by FBP.
cThe control group is ROI white matter, including ROI1 and ROI5; the experimental group is ROI gray matter including ROI2, ROI3, and ROI4.
d
Statistically significant (P⬍.05).
Table 3: Mean imaging score of CBV, CBF, and MTT reconstructed by IR and FBP in groups A and B
CBV Score CBF Score MTT Score
IR
Group A (100 mAs) 5.5⫾1.7 4.2⫹2.0 3.5⫾1.4 Group B (80 mAs) 5.5⫾1.9 4.1⫾2.1 3.5⫾1.5 FBP
[image:5.594.53.284.216.293.2]imaging quality of CBF in lower dose CTP was slightly worse compared with that in standard CTP. Lower dose CTP can render peritherapeutic monitoring of hemodynamic changes more fea-sible for patients with neurovascular disorders. Further effort to lower the radiation dose should be pursued with other methods because IR cannot eliminate beam-hardening artifacts caused by skull and contrast due to the photon-starvation effect.
REFERENCES
1. Kalra MK, Prasad S, Saini S, et al.Clinical comparison of standard-dose and 50% reduced-standard-dose abdominal CT: effect on image quality.
AJR Am J Roentgenol2002;179:1101– 06
2. Hara AK, Paden RG, Silva AC, et al.Iterative reconstruction tech-nique for reducing body radiation dose at CT: feasibility study.AJR Am J Roentgenol2009;193:764 –71
3. Kilic K, Erbas G, Guryildirim M, et al.Lowering the dose in head CT using adaptive statistical iterative reconstruction.AJNR Am J Neu-roradiol2011;32:1578 – 82
4. Kligerman S, Mehta D, Farnadesh M, et al.Use of a hybrid iterative reconstruction technique to reduce image noise and improve image quality in obese patients undergoing computed tomographic pul-monary angiography.J Thorac Imaging2013;28:49 –59
5. Rapalino O, Kamalian S, Kamalian S, et al.Cranial CT with adaptive statistical iterative reconstruction: improved image quality with concomitant radiation dose reduction. AJNR Am J Neuroradiol
2012;33:609 –15
6. Korn A, Fenchel M, Bender B, et al.Iterative reconstruction in head CT: image quality of routine and low-dose protocols in comparison with standard filtered back-projection. AJNR Am J Neuroradiol
2012;33:218 –24
7. Funama Y, Taguchi K, Utsunomiya D, et al.Combination of a low-tube-voltage technique with hybrid iterative reconstruction (iDose) algorithm at coronary computed tomographic angiogra-phy.J Comput Assist Tomogr2011;35:480 – 85
8. Wintermark M, Lev MH.FDA investigates the safety of brain per-fusion CT.AJNR Am J Neuroradiol2010;31:2–3
9. Trojanowska A, Drop A, Jargiello T, et al.Changes in cerebral hemo-dynamics after carotid stenting: evaluation with CT perfusion stud-ies.J Neuroradiol2006;33:169 –74
10. Waaijer A, van Leeuwen MS, van Osch MJ, et al.Changes in cerebral perfusion after revascularization of symptomatic carotid artery stenosis: CT measurement.Radiology2007;245:541– 48
11. Konstas AA, Wintermark M, Lev MH.CT perfusion imaging in acute stroke.Neuroimaging Clin N Am2011;21:215–38
12. Mishra N, Albers G, Davis S, et al. Mismatch-based delayed thrombolysis: a meta-analysis.Stroke2010;41:e25– e33
13. Abels B, Klotz E, Tomandl BF, et al.CT perfusion in acute ischemic stroke: a comparison of 2-second and 1-second temporal resolu-tion.AJNR Am J Neuroradiol2011;32:1632–39
14. Hirata M, Murase K, Sugawara Y, et al.A method for reducing radi-ation dose in cerebral CT perfusion study with variable scan sched-ule.Radiat Med2005;23:162– 69
15. Hom J, Dankbaar JW, Schneider T, et al.Optimal duration of acqui-sition for dynamic perfusion CT assessment of blood-brain barrier
permeability using the Patlak model. AJNR Am J Neuroradiol
2009;30:1366 –70
16. Wintermark M, Smith WS, Ko NU, et al.Dynamic perfusion CT: optimizing the temporal resolution and contrast volume for calcu-lation of perfusion CT parameters in stroke patients.AJNR Am J Neuroradiol2004;25:720 –29
17. Wintermark M, Maeder P, Verdun FR, et al.Using 80 kVp versus 120 kVp in perfusion CT measurement of regional cerebral blood flow.
AJNR Am J Neuroradiol2000;21:1881– 84
18. Kealey SM, Loving VA, Delong DM, et al.User-defined vascular input function curves: influence on mean perfusion parameter val-ues and signal-to-noise ratio.Radiology2004;231:587–93
19. Greitz T.A radiologic study of the brain circulation by rapid serial angiography of the carotid artery.Acta Radiol Suppl1956;140:1–123 20. Lin CJ, Hung SC, Guo WY, et al.Monitoring peri-therapeutic cere-bral circulation time: a feasibility study using color-coded quanti-tative DSA in patients with steno-occlusive arterial disease.AJNR Am J Neuroradiol2012;33:1685–90
21. Kudo K, Sasaki M, Ogasawara K, et al.Difference in tracer delay-induced effect among deconvolution algorithms in CT perfusion analysis: quantitative evaluation with digital phantoms 1.Radiology
2009;251:241– 49
22. Kudo K, Sasaki M, Stergaard LO, et al.Susceptibility of Tmax to tracer delay on perfusion analysis: quantitative evaluation of vari-ous deconvolution algorithms using digital phantoms. J Cereb Blood Flow Metab2011;31:908 –12
23. Konstas AA, Goldmakher GV, Lee TY, et al.Theoretic basis and tech-nical implementations of CT perfusion in acute ischemic stroke. Part 1. Theoretic basis.AJNR Am J Neuroradiol2009;30:662– 68 24. Waaijer A, van der Schaaf IC, Velthuis BK, et al.Reproducibility of
quantitative CT brain perfusion measurements in patients with symptomatic unilateral carotid artery stenosis.AJNR Am J Neuro-radiol2007;28:927–32
25. Fiorella D, Heiserman J, Prenger E, et al.Assessment of the repro-ducibility of postprocessing dynamic CT perfusion data.AJNR Am J Neuroradiol2004;25:97–107
26. Wang G, Snyder DL, O’Sullivan JA, et al.Iterative deblurring for CT metal artifact reduction.IEEE Trans Med Imaging1996;15:657– 64 27. McCollough CH, Primak AN, Braun N, et al.Strategies for reducing
radiation dose in CT.Radiol Clin N Am2009;47:27– 40
28. Fardanesh M, Wang Q, Mehta D, et al.Evaluation of the impact of major dose reduction for quantitative brain perfusion studies using a low dose simulation algorithm.In:Proceedings of the Annual Meet-ing of Radiological Society of North America,Chicago, Illinois. Novem-ber 27–DecemNovem-ber 2, 2011
29. Nogueira RG, Schwamm LH, Hirsch JA.Endovascular approaches to acute stroke. Part 1. Drugs, devices, and data.AJNR Am J Neuro-radiol2009;30:649 – 61
30. Paciaroni M, Caso V, Agnelli G.The concept of ischemic penumbra in acute stroke and therapeutic opportunities. Eur Neurol
2009;61:321–30
31. Morhard D, Wirth CD, Fesl G, et al.Advantages of extended brain perfusion computed tomography.Invest Radiol2010;45:363– 69 32. Smith AB, Dillon WP, Gould R, et al.Radiation dose-reduction
strategies for neuroradiology CT protocols.AJNR Am J Neuroradiol