Copyright 0 1987 by the Genetics Society of America
A Test of Neutral Molecular
Evolution
Based
on
Nucleotide Data
Richard
R.
Hudson, Martin Kreitman' and Montserrat AguadG'
National Institute of Environmental Health Sciences, Research Triangle Park, North Carolina 27709
Manuscript received August 28, 1986 Revised copy accepted January 30, 1987
ABSTRACT
The neutral theory of molecular evolution predicts that regions of the genome that evolve at high rates, as revealed by interspecific DNA sequence comparisons, will also exhibit high levels of polymorphism within species. We present here a conservative statistical test of this prediction based on a constant-rate neutral model. The test requires data from an interspecific comparison of at least two regions of the genome and data on levels of intraspecific polymorphism in the same regions from at least one species. The model is rejected for data from the region encompassing the Adh locus and the 5' flanking sequence of Drosophila melanogaster and Drosophila sechellia. The data depart from the model in a direction that is consistent with the presence of balanced polymorphism in the coding region.
NE of the appealing features of the neutral the-
0
ory of evolution is that it makes predictions not only about properties of gene frequencies but also about rates of molecular evolution. Indeed, as KIMURA (1983) has stated, "Eventually, it will be found, if the neutral theory is valid, that molecules or parts of one molecule which are more important in function, and which therefore evolve more slowly, will show a lower level of heterozygosity." This is because, under the neutral model, the rate of fixation of mutations and the level of standing variation within populations are both increasing functions of the neutral mutation rate. In fact, under the neutral theory, polymorphism is regarded as a transient phase of molecular evolution. Despite this feature of the theory, most attempts to evaluate the neutral theory have focused on testing only one aspect of the theory, either its predictions about levels of polymorphism, primarily from allo- zyme data, or its prediction about the mean and variance of molecular divergences (e.g., WATTERSON 1978; NEI, FUERST and CHAKRABORTY 1976; LANG- LEY and FITCH 1974; KIMURA 1983; GILLESPIE 1986).Exceptions are the studies of SKIBINSKI and WARD (1982) and WARD and SKIBINSKI (1985). A lack of interest in the development of tests based on the combined predictions of the neutral theory has un- doubtedly resulted from the difficulty inherent in calibrating allozyme mobility differences with num- bers of amino acid substitutions.
The advent of DNA sequence data now makes possible a quantitative comparison of levels of nucleo- tide polymorphism within populations and similar lev-
'
Permanent address: Department of Biology, Princeton University, * Permanent address: Departamento de Genitica, Universidad de Barce- Princeton, New Jersey 08544.lona, Avenida Diagonal 645, 08028 Barcelona, Spain. Genetics 116 153-159 (May, 1987)
els of sequence divergence between populations (spe- cies). Thus it is now important to consider statistical tests of the neutral theory that are based on both kinds of data. For example, one might ask, given different levels of nucleotide divergence between spe- cies in two or more regions of DNA, whether the levels of within-species polymorphism in the corre- sponding regions differ in the appropriate way, as predicted by the neutral theory.
In this paper, we present a conservative statistical test of a neutral model based on its predictions about the relationship between levels of nucleotide polymor- phism within species and patterns of sequence diver- gence between species. The test requires data from an interspecific comparison of at least two regions of the genome and data on levels of intraspecific poly- morphism (as measured by the number of nucleotide sites segregating in a sample) in the same regions from at least one of the species. The statistic used to carry out the test is a goodness-of-fit statistic that is de- scribed in the next section. Also described in the next section is the specific neutral model upon which the test is based. The test is then applied to data from the region encompassing the Adh locus and the 5' flanking sequence of the locus of Drosophila melanogaster and Drosophila sechellia.
T H E MODEL AND T H E TEST STATISTIC
154 R. R. Hudson, M. Kreitman and M. Aguadi
sites that are polymorphic at locus
i
in the sample ofnA gametes from species A . Similarly, let S: denote the number of polymorphic sites at locus i in the sample of nB gametes from species B. Let D,,
i
= 1,.
.
-
, L ,denote the number of differences at locus
i
between a random gamete from the sample from species A and a random gamete from the sample from species B . T h e 3L observations, S:', S:, and D,,(i
= 1, -e- , L )constitute the data with which the test is carried out. The observations S:' and Sf are measures of the within-species variation, and the D, are measures of the between-species divergence. We now consider a constant-rate neutral model which allows us to test whether the differences between species are statisti- cally consistent with the levels of polymorphism within the species. Under our model estimates of the ex- pected values of these observed quantities can be calculated and thus a goodness-of-fit statistic, to be described later in this section, can be calculated. This statistic, which measures the deviation of the observed from the expected values, can be used to test the neutral model, once the critical values of the statistic are determined.
Under our model, it is assumed that: (1) generations are discrete, (2) all mutations are selectively neutral,
( 3 ) the number of nucleotide sites at each locus is very large, so that each mutation occurs at a previously unmutated site, (4) in each generation, mutations occur independently in each gamete and at each locus, ( 5 ) at locus
i,
the number of mutations per gamete in each generation is Poisson distributed with mean ut,and (6) no recombination occurs within the loci. Un- der these assumptions each locus evolves according to the standard neutral WRIGHT-FISHER infinite-sites model. [See, for example, WRIGHT'S model of WAT- TERSON (1975)l. In addition, we make the following assumptions:
(7)
all loci are unlinked, (8) species A and B are at stationarity at the time of sampling with population sizes 2N and 2NJ respectively, and (9) the two species were derived T' generations ago from a single ancestral population, and the ancestral popula- tion was at stationarity at the time of the split, with population size of 2N(1 +f)/2 gametes, i.e., the av- erage of the population sizes of species A and B . Assumptions (6) and(7),
as described in the DISCUS- SION, are the most conservative assumptions one can make concerning linkage of sites.As a measure of the goodness-of-fit of the observa- tions to the model, we propose the statistic, X 2 , defined as follows:
1= 1
L
+
(Di-
i(Di))*/ear(Di), i= 1where I?( ) and c a r ( ) denote estimates of expectation and variance, respectively. T h e estimated expecta- tions and variances of D,, S:' and SB are obtained using the following properties of this neutral model:
E(St) eic(nA),
i =
1 , - * * , L (1)nA- 1
Var(Sf) =I E(S:')
+
8,' l/j2,i
= 1,...,
L (2)1=1
E ( D J = U T
+
(1 + f ) / 2 ) ,i
= 1,.
*.,
L (3) andVar(D,) = E ( D , )
+
(8,(1 +f)/2)',i
= 1 ,- .
.,
L (4)where E ( ) and Var( ) denote expectation and vari- ance, respectively, and 8, = NU,, T = T ' / 2 N and where
n- 1
j = 1
(WATTERSON 1975; GILLESPIE and LANGLEY 1979).
T h e equations for the mean and variance of S? are the same as for S! except that 0; and nA are replaced byfBi and nB, respectively. T h e estimates of the ex- pectations and variances of the observations needed to calculate X 2 are obtained from (1)-(4) by replacing the unknown parameters O i , J and T , with estimates of these parameters. These parameters could be esti- mated in a number of ways. For example, estimates could be obtained by minimizing the squared devia- tions of the observed values from their expectations or by minimizing the value of
p.
Dr. B. S . WEIR, who pointed out to us the possibility of using least squares estimates, has shown that simple algebraic expressions for the least squares estimates are obtainable (B. S. WEIR, personal communication). T h e estimates that we have investigated most thoroughly areii,
f,
andf,
obtained by solving the following system of L+
2
equations:L L
c
S:' = C(n,)di,
i= 1 i = l
L L
s:
= f C ( n , ) di,i= 1 i= 1
L
(5)
L
c
Di =(f
+
(1+
f)/2)c.
di,i= 1 i= 1
S:'
+
S:+
Di =d i ( f
+
(1 + f ) / 2+
+ f C ( n , ) Li = 1 , . . e , L - 1 .
Test of Neutral Model 155
DL will necessarily be satisfied when the system (5) is satisfied.
If the quantities S:’, S;”, D, are stochastically inde- pendent of each other, are normally distributed, and the L
+
2
parameters are appropriately estimated, then the statistic X 2 should be approximatelyx2
dis- tributed with 2L-
2
degrees of freedom. For n A , nBand T sufficiently large, all the observations are ap- proximately normally distributed (WATTERSON 1975;
GILLESPIE and LANGLEY 1979). Since the loci are unlinked, S:’ is independent of S;’ and Sf’, and S;” is independent of Sf, for i # j . Also, S:’ is essentially independent of S:, i = 1 ,
-
.,
L, as long as T is not too small, so that there are no shared polymorphisms in the two species. However, a small positive correla- tion is expected between S:’ and D,, and between S;”and D,, because a fraction of mutations that contribute to polymorphism also contribute to between-species differences.
Our choice of D, as a measure of the divergence between species requires some comment. An obvious alternative is the average of the number of differences in all pairwise comparisons between the two species at locus i . This alternative has the same expectation as D, and has a lower variance. Our choice of D, was based only on the availability of a simple expression for its variance, equation (4). In practice, it appears from simulations that replacing D, with this alternate measure of divergence has negligible effect on the distribution of X 2 .
Monte Carlo simulations were used to examine the distribution of
P,
under each of the estimation meth- ods. For the cases examined, the statistic X 2 calculated with the estimatesiZ,
1,
andf,
has an approximatelyx2
distribution with the expected degrees of freedom. T h e simulations are described in detail in the SIMU-LATIONS section.
AN APPLICATION
We applied this test of neutrality to data on silent variation in the Adh locus and in a 4-kb Adh 5’ flanking region of D. melanogaster and
D.
sechellia. D. sechellia is an island endemic species closely related to Drosoph- ila simulans (COYNE and KREITMAN 1986) and belongs in the D . melanogaster sibling species group. T h e silent sites in the Adh locus are taken to be those in the translated portions of the three exons (192 sites in255 codons) and the two small introns (135 sites) (KREITMAN 1983). T h e polymorphism data are from a four-cutter restriction enzyme survey of 8 1 isochro- mosomal lines of D. melanogaster (KREITMAN and AGUADE 1986a,b). Nine polymorphic restriction sites were identified in the flanking region and eight in the Adh locus. T h e “effective” number of silent sites in the two regions are estimated to be 4 14 in the flanking region and 79 in the Adh locus, numbers which reflect
the fact that only a fraction of all possible silent changes are detectable by this four-cutter method (KREITMAN and A G U A D ~ 198613; COYNE and KREIT-
MAN 1986). T h e interspecific data are based on a
sequence comparison of one D. melanogaster gene ( A f S ) (KREITMAN 1983; COYNE and KREITMAN 1986)
and one D. sechellia gene (COYNE and KREITMAN 1986;
M. AGUADE and M. KREITMAN, unpublished sequence available on request from M. KREITMAN). T h e D. sechellia sequence is the only available complete se- quence of the flanking and Adh region among the D. melanogaster sibling species. This comparison reveals
210 differences in the 4052 bp aligned flanking se- quences and 18 differences in the 324 Adh silent sites
(192 silent coding sites plus 132 aligned intron sites) (COYNE and KREITMAN 1986). T h e data are summa- rized in Table 1 . These data indicate an approxi- mately equal amount of divergence between species for the two regions (210/4052 = 0.052 us. 18/324 =
0.056), but an approximately fourfold higher level of polymorphism in the A d h locus relative to the flanking region (8/79 = 0.101 us. 9/414 = 0.022).
Our test must be modified slightly to accommodate these data since there is polymorphism data only from one species and since there are different numbers of sites for the within-species data and for the between- species data. Let locus 1 denote the 5’ flanking region, and locus 2 denote the silent sites of the Adh locus. D . melanogaster and D. sechellia correspond to species A and species B , respectively. We assume that the neutral mutation rate for a locus is proportional to the num- ber of sites. Thus in ( 1 ) and
(2),
the equations for the within species polymorphism, we replace B1 by 4146,’,where 19: is 4 N times the mutation rate per nucleotide site in locus 1 , and we replace d2 by 7904, where 0; is
4 N times the per nucleotide site mutation rate at locus
2. Similarly, in equation (3) and (4), O 1 is replaced by
40520; and 02 is replaced by 32404. Since we have no polymorphism data from species
2,
we cannot estimatef.
We assume therefore that the ancestral population had the same population size as species A. System (5)becomes
S;’
+
S$ = C(nA)(4148*;+
7984)D1
+
0 2 = (40528;+
32484)(f+
1) (6)D1
+
Sf = 4 0 5 2 & ( f+
1 )+
C(nA)4148,‘.T h e observed values of D 1 , D 2, S;’ and S$ are 2 10, 18,
156 R. R. Hudson, M. Kreitman and M. AguadS
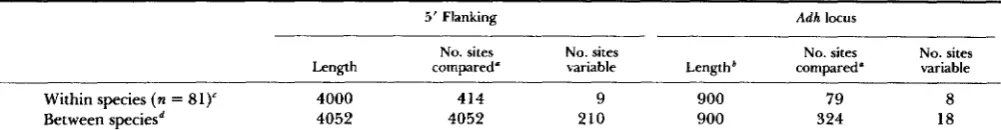
TABLE 1
Distribution of polymorphism around the Adh locus in D. mclanogaster and between D. melanogaster and D. sechellia
5' Flanking Adh locus
No. sites No. sites No. sites No. sites Length compared" variable Lengthb compared' variable
Within species ( n = 81)" 4000 414 9 900 79 8
Between speciesd 4052 4052 210 900 324 18
~ ~
Within-species: estimated from the product of the length of the region and the fraction of all possible nucleotide changes in a known D.
melanogaster sequence (African slow allele, Af-s) that would be detected by the set of restriction enzymes (e.g., all loss of restriction site changes and all single-site changes leading to a gain of a restriction site).
'Includes three coding regions (765 bp) and two introns (65 bp and 70 bp).
'Based on "fourcutter" restriction data using six different enzymes to generate the 5' data and ten enzymes to generate the Adh locus
*Based on complete sequence comparison of one D. melunogaster sequence (African slow allele, Afs) and one D. sechellia sequence.
data.
indicates a significant departure from the expectations of the neutral model.
SIMULATIONS
Monte Carlo simulations were used to examine the distribution of
x2
calculated with each of the three types of estipators 2f the parameters: (1) the esti- mators,$,,
f,
and T,(2)
the minimum chi-square estimates, and (3) the least-squares estimates. Some properties of the estimators themselves were also ex- amined. Due to the high dimension of the parameter space, no attempt was made to examine the distribu- tion ofx2
throughout the parameter space. Monte Carlo simulations were carried out for a few cases with two and three loci and showed th?t f?r those cases,x2,
calculated with the estimates d,,f,
andf
obtained with the system of equations ( 5 ) , does indeed have an approximatelyx2
distribution with the ex- pected degrees of freedom. Extensive Monte Carlo simulations were carried out with parameter values compatible with the data described in the previous section. For this case, we expect thatx2
will be ap- proximatelyx 2
with one degree of freedom.In these simulations, the random variables D1, D 2 ,
Si, and Si were generated completely independently of each other, by the method of HUDSON (1983a), ignoring the correlation between Sf and
Di.
We expect that the effect of the correlation is small and that ignoring it leads to a conservative test. (A small num- ber of simulations were done which correctly incor- porate the correlation between these random varia- bles, and the results, for the cases examined, con- firmed our expectations.) Some results are given in Table2
and Figure 1. T h e parameter values used in Table 2 are values estimated by each of the three estimation methods using the data presented in the previous section.T h e simulation results indicate that all three meth- ods of estimation perform about equally well in esti- mating the parameters. However, the distribution of X 2 is quite sensitive to the method of estimation, at
least for parameters in the range compatible with the data that we analyzed.
X2
calculated with the least- squares estimates does not appear to be useful as a test statistic for our data, having a distribution that is quite sensitive to the parameter values. T h e distribu- tion of X 2 calculated with the minimumx2
estimates is relatively independent of the parameters but does not have ax 2
distribution, so significance levels must be determined by simulation. T h e distribution ofX2
calculated with
di,
84, andf,
is also relatively inde- pendent of the parameters and has a distribution that is quite close tox 2
with one degree of freedom, as shown by the 0.05 and 0.01 critical values (see Table2) and the cumulative probability curve for unlinked loci shown in Figure 1. Thus we prefer the use of
x2
calculated with
&, &
andf.
DISCUSSION
T h e idea underlying the test presented here was outlined by KREITMAN and A G U A D ~ (1986b) in an analysis of within- and between-species nucleotide var- iation around the Adh locus. Their analysis and rejec- tion of a neutral model was based on the assumption that all nucleotide sites (both within and between regions) evolve independently, an assumption which allowed them to use conventional tests of independ- ence. However, it is well known that tightly linked nucleotide sites, such as those comprising small re- gions of the DNA, are not evolutionarily independent. As a consequence of the linkage between sites, the observed quantities have larger variances than when independence is assumed. This means that rejections based on the test of KREITMAN and A G U A D ~ may be due to the linkage among sites rather than other more interesting departures from the neutral model. These considerations motivated us to develop a conservative statistical test based on different biological assump- tions.
Test of Neutral Model 157
TABLE 4
Simulation results concerning estimates of
e;,
04, and T, and the statistic x‘ calculated with these estimatesResultsb Parameters
Estimates of
e: x 103 e; x io’ T Method“ el x 10’ e; x 103 T xp P (3.84)’ P (6.63)’
6.6 9.0 6.73 1 6.6 (5.2) 9.0 (12.0) 7.8 (15.0) 1.01 (2.10) 0.045 0.01 1
6.6 9.0 6.73 2 7.0 (5.6) 9.6 (13.0) 7.2 (13.0) 0.85 (1.08) 0.022 0.001
6.6 9.0 6.73 3 6.6 (5.8) 9.0 (1 5.0) 8.1 (22.0) 1.56 (11.1) 0.088 0.043
11.5 15.0 2.9 1 11.5 (12.0) 15.1 (32.0) 3.3 (2.8) 1.12 (2.99) 0.060 0.0 17
11.5 15.0 2.9 3 11.4 (14.0) 15.1 (44.0) 3.4 (3.9) 1.97 (20.6) 0.120 0.060
5.0 5.5 9.4 1 5.0 (3.7) 5.5 (5.3) 11.4 (50.0) 1.01 (2.21) 0.042 0.013
5.0 5.5 9.4 3 5.0 (4.2) 5.5 (6.8) 11.7 (56.0) 1.59 (14.3) 0.085 0.046
11.5 15.0 2.9 2 12.0 (13.0) 16.0 (34.0) 3.0 (2.2) 0.81 (1.10) 0.023 0.001
5.0 5.5 9.4 2 5.4 (4.1) 6.0 (6.4) 10.4 (37.0) 0.85 (1.04) 0.020 0.001
~ ~~ ~ ~ ~ ~~
In these simulations, n, the sample size for the within-species polymorphism observations, is always 8 1. The number of nucleotide sites examined was set equal to the numbers examined in the data presented in AN APPLICATION, namely, 4052 and 414 for the between-species comparisons at locus 1 and locus 2, respectively, and 324 and 79 for the within-species comparisons for locus 1 and 2, respectively.
“ T h e method used ,to ptimatejhe parameters and then calculate the statistic
*
is indicated by the number in this column. Method 1 refers to the estimates el, f34, and T. Method 2 refers to the minimum x e estimation method. Method 3 refers to the least-squares estimation method.*
Results are based on 100,000 independent replicates. For the estimates and p, the first number is the mean for the 100,000 replicates, and the number in parentheses is the variance.P(x) is the proportion of the replicates with x2 greater than x. For a x2 statistic with one degree of freedom P (3.84) = 0.05 and P (6.63)
= 0.01.
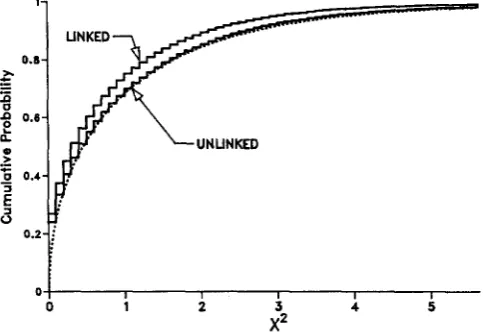
FIGURE 1 .-Cumulative prob?bil$y distribution of p, where is calculated with the estimates el, 04, and T, obtained using (6).
The dotted curve is the x4 distribution with one degree of freedom. The step functions are estimates of the distribution of from
100,000 replicates with 0; = 6.6 X lo-’, 04 = 9.0 X lo-’, T = 6.73,
n = 81, and the numbers of nucleotide sites as in Table 2 and AN APPLICATION. The step function labeled LINKED is for the model with locus 1 and 2 completely linked. The step function labeled
UNLINKED is for the model with locus 1 and 2 completely unlinked.
to assure a conservative test. Recombination will not effect the expectations of
D 1 ,
D p , S;”, or S;, but intra- locus recombination will reduce the variance of these quantities (HUDSON 1983b). The reduced variance of these quantities will result in typically smaller values ofp.
Thus rejection of the neutral model that as- sumes no intralocus recombination would imply that a more realistic model with some intralocus recombi- nation should also be rejected. Interlocus linkage willnot affect the marginal distributions of the observa- tions but will result in a positive correlation of Sf with S$ and of
D1
with Dp (GRIFFITHS 1981). This positive correlation that results from interlocus linkage will also shift the distribution ofx2
toward smaller values and make rejections based on our model conservative. This is because when S? and S$ both exceed their expectation by a similar multiplicative factor, then the estimates of 81 and O2 are larger than the true value and the estimate of T is smaller than the true value, but the value ofx2
tends to remain small. It is whenSf
and SG differ from their expectations in opposite directions thatx2
is large. Similarly, it is when D and0 2 differ from their expectations in opposite direc-
tions that
x2
is large. Thus, interlocus linkage by producing a positive correlation of S;” and S$ and of D1 and Dp, results in typically smaller values ofx2.
The effect on
x2
of complete linkage between the two loci is shown in Figure 1, where the cumulative prob- ability curves are shown for the case of two completely linked loci and for the case of two unlinked loci. Simulation results (not shown) indicate that the cu- mulative probability distributions ofp
with interme- diate levels of recombination fall between the two curves shown in Figure 1.Certain departures from statistical stationarity could make the large value of
X2
observed in AN158 R. R. Hudson, M. Kreitman and M. Aguadi
0.1-
0.0-
0.4-
0.2-
0 ,
.W. I
...
i
im
i
.Me
. . . e
F“.*
..
)...*.#.*PI’I I I I I 1 1 1 1 I I I I I I 1 1 1 I 1 1 1 1
0.001 0.01 0.1
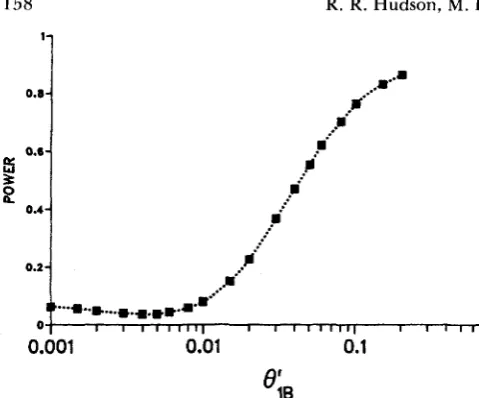
FIGURE 2.-Simulation estimates of the probability of rejecting the constant rate neutral model employing the criteria, > 3.84, as a function of O i B , the mutation rate at locus 1 in the lineage leading to species E . The other parameters are as estimated for the data of A N APPLICATION (6iA = 6.6 X lo-’, 8; = 9.0 X lo-’, and
T = 6.73). The actual estimated points are shown with squares which are connected by an arbitrary smooth curve.
example, if the ancestral population was much bigger than the present day population of D. melanogaster,
the between-species divergence,
DI
and D 2 , might have variances sufficiently high to account for the observations. However, systematic effects in the direc- tion of the observed departures from expectations cannot be created by population size changes. Recent population bottlenecks, for example, would tend to decrease the amount of polymorphism in all regions, not just the flanking region.T h e observations could also be explained by suffi- ciently large changes in the neutral mutation rate in specific regions at the right time in the evolutionary history of the populations. For example, if the neutral mutation rate in the coding region in
D.
melanogaster had increased by a factor of five, say, about 4 N gen- erations ago, levels of polymorphism would be in- creased in the coding region, but the between-species differences would still be mostly due to evolution at the slower rate.To get some information about the sensitivity of the test to changes in the mutation rate, the following alternative hypothesis was considered. Suppose that the neutral mutation rate at locus 1 was not the same in the line of descent to species A as the neutral mutation rate in the line of descent to species B. Let BiA and denote 4 N times the mutation rates at locus 1 in species A and B , respectively. We assume that these two rates were different since the most recent common ancestor of the two samples. In Figure 2 is shown a power c u r v e for the test as a function of
BiB,
with the other parameters held constant at the values estimated from the data presented earlier. When
e;,
is 6.6 X lo-’, and withe;,
anywhere in the range 1.0X lo-’ to 10.0 X the test is virtually unaffected. Clearly, the test is quite insensitive to minor changes in the mutation rate that take place at the time of speciation. Not until the rate in species B is more than six times the rate in species A does the probability of rejection (at the 0.05 level) of the constant rate model attain a value of 0.50. Note that a change in the rates at all loci of the species will not result in an increased probability of rejection of the constant-rate model. T h e probability of rejection increases only when a
change occurs in the relative rates of mutation at different loci in a species.
Under a slightly deleterious mutation model, changes in the neutral mutation rate can occur as a result of population size changes (OHTA 1976). This is because slightly deleterious mutations are effectively neutral in small populations (in which they are fixed just as strictly neutral mutations are), but in large populations selection is effective in eliminating the slightly deleterious mutations. Thus, the effective neu- tral mutation rate is higher in small populations than in large populations under this model. Note that a large value of will occur by this mechanism only if the distribution of selective effects is quite different for the two regions so that the change in mutation rate due to the population size change is different in the two regions. It is not clear whether the slightly deleterious mutation model can plausibly account for the large mutation rate change that is required in our application.
With only the data presented in AN APPLICATION, it is impossible to attribute the rejection of the model to any one of the four observed quantities, or to any combination of the observations. It could be that the bad fit is due to a very reduced level of polymorphism in the 5’ flanking region, to an excessive amount of polymorphism in the coding region, a very reduced amount of divergence in the coding region, or an excessive amount of divergence in the 5’ flanking region. Any combination of these is also possible. However, before examining the data, we expected both the 5’ flanking sites and the silent sites of the coding region to be relatively unconstrained and therefore we expected that both regions would evolve at about the same rate and show comparable levels of
Test of Neutral Model 159
in the 3' flanking region of Adh, which apparently contains coding sequence of another gene (COHN
1985; SHAEFFER 1985), the frequency of segregating sites is about one third that in the Adh coding region
(KREITMAN AND A G U A D ~ 1986b). Clearly, more data from other coding regions and other flanking regions are needed, but these two observations suggest that the silent sites of Adh locus, in particular in the third exon, are unusually polymorphic.
T h e presence of a balanced polymorphism in the coding region of Adh could explain the relatively high level of polymorphism observed in that region. T h e existence of a balanced polymorphism at a single site can lead to higher levels of neutral polymorphism at linked sites (STROBECK 1983). T h e reason this can occur is that during the time that the balanced poly- morphism is maintained by selection, new mutations will tend to accumulate in the region tightly linked to the selected site. STROBECK (1983) has shown that the excess polymorphism decreases with genetic map dis- tance from the balanced polymorphism. A candidate for a balanced polymorphism is the amino acid substi- tution that produces the fast-slow electrophoretic var- iation. In support of this hypothesis, OAKESHOTT et
al. (1982) have suggested that selection is operating on this polymorphism and maintaining geographic clines in allozyme frequency across different conti- nents.
We note here that the exon containing the amino acid change also has the highest level of polymor- phism. However, the analysis of HUDSON and KAPLAN
(1 986) suggests that a simple two-allele polymorphism is not indicated by the Adh sequence data of KREITMAN
(1983). Similarly, KREITMAN and A G U A D ~ (1986b) point out that the same high level of polymorphism exists in a sample of only slow alleles. A three-or-more allele balanced polymorphism is possible, but in this case one is forced to accept that at least one silent nucleotide polymorphism is being selectively main- tained.
T h e neutral model is unique among evolutionary models in that it makes specific quantitative predic- tions about the relationship of within-species levels of polymorphism and between-species divergence. It is this feature of the neutral model that allows us to construct a statistical test. T h e expected accumulation of additional data for other loci and more species should encourage the development of alternative models that make similar quantitative predictions and thus can be evaluated using tests such as ours.
We thank C. LANGLEY for suggesting the basic form of the test presented here and N. KAPLAN, G. SIMMONS, C. LANGLEY, B. WEIR, H. TACHIDA and several reviewers for comments on the manuscript.
LITERATURE CITED
COHN, V. H., 1985 Organization and evolution of the alcohol dehydrogenase gene in Drosophila. Ph.D. thesis, University of Michigan.
Evolutionary genetics of two sibling species, Drosophila simulans and D . sechellia. Evolu- tion 40: 673-691.
GILLFSPIE, J. H., 1986 Variability of evolutionary rates of DNA. Genetics 113: 1077-1091.
GILLESPIE, J. H. and C. H. LANGLEY, 1979 Are evolutionary rates really variable? J. Molec. Evol. 13: 27-34.
GRIFFITHS, R. C., 1981 Neutral two-locus multiple allele models with recombination. Theor. Popul. Biol. 1 9 169-186. HUDSON, R. R., 1983a Testing the constant-rate neutral allele
model with protein sequence data. Evolution 37: 203-217. HUDSON, R. R., 198313 Properties of a neutral allele model with
intragenic recombination. Theor. Popul. Biol. 23: 183-20 1.
HUDSON, R. R. and N. L. KAPLAN, 1986 On the divergence of alleles in nested subsamples from finite populations. Genetics
The Neutral Theory of Molecular Evolution.
Cambridge University Press, Cambridge.
Nucleotide polymorphism at the alcohol dehydrogenase locus of Drosophila melanogaster. Nature 304:
4 12-4 1 7.
KREITMAN, M. and M. ACUAD~, 1986a Genetic uniformity in two populations of Drosophila melanogaster as revealed by filter hybridization of four-nucleotide-recognizing restriction en- zyme digests. Proc. Natl. Acad. Sci. USA 83: 3562-3566. KREITMAN, M. and M. ACUAD~, 1986b Excess polymorphism at
the Adh locus in Drosophila melanogaster. Genetics 114: 93- 110.
An examination of the constancy of the rate of molecular evolution. J. Molec. Evol. 3:
161-177.
Testing the neutral mutation hypothesis by distribution of single locus heterozygosity. Nature 262: 491-493.
OAKESHOTT, J. G., J. B. GIBSON, P. R. ANDERSON, W. R. KNIBB, D. G. ANDERSON and G. K. CHAMBERS, 1982 Alcohol dehydro- genase and glycerol-3-phosphate dehydrogenase clines in Dro- sophila melanogaster on three continents. Evolution 36: 86-96.
Role of very slightly deleterious mutations in molecular evolution and polymorphism. Theor. Popul. Biol.
Ph.D. thesis, Department of Genetics, Uni- versity of Georgia.
Correlations between heterozygosity and evolutionary rate of proteins. Nature 298:
STROBECK, C., 1983 Expected linkage disequilibrium for a neutral locus linked to a chromosomal arrangement. Genetics 103:
545-555.
Observed relationships between protein heterozygosity and protein genetic distance and comparisons with neutral expectations. Genet. Res. 45:
3 15-340.
On the number of segregating sites in genetical models without recombination. Theor. Popul. Biol.
7: 256-276.
WATTERSON, G. A., 1978 The homozygosity test of neutrality. Genetics 88: 405-417.
COYNE, J. A. and M. KREITMAN, 1986
113: 1057-1076. KIMURA, M., 1983
KREITMAN, M., 1983
LANGLEY, C. H. and W. M. FITCH, 1974
NEI, M., P. A. FUERST and R. CHAKRABORTY, 1976
OHTA, T., 1976
L O 254-275. SHAEFFER, S., 1985
SKIBINSKI, D. 0. F. and R. D. WARD, 1982 490-492.
WARD, R. D. and D. 0. F. SKIBINSKI, 1985
WATTERSON, G. A., 1975