Performance and Reliability Analysis of a
Mobile Robot Using Cara
Fault Tree
Manjish Adhikari[1], Vishal Mandal[2]
U.G. Student, Department of Electronics and Communication Engineering, UCEK, Jawaharlal Nehru Technological
University, Kakinada, A.P, India[1]
U.G. Student, Department of Mechanical Engineering, UCEK, Jawaharlal Nehru Technological University, Kakinada,
A.P, India[2]
ABSTRACT: This paper collects a number of considerations on problems and challenges of current reliability engineering research. This work is the expansion of Panagiotis and Fourlas’s analysis where using a simpler approach of analysis by Cara Fault Tree, reliability of wireless mobile robot is accessed. The reliability data at both component level and system level is calculated from the experiment conducted on the wireless mobile robot. Critical components of the robot with respect to failure frequency and reliability are identified. The focus on reliability engineering is with respect to its role within the current developments of system safety and risk analysis.
KEYWORDS: Reliability, MTBF, MTTR, Availability
I. INTRODUCTION
Reliability is a broad term that focuses on the ability of a product to perform its intended function. Reliability engineering consists of the systematic application of time-honored engineering principles and techniques throughout a product lifecycle and is thus an essential component. The goal of reliability engineering is to evaluate the inherent reliability of a product or process and pinpoint potential areas for reliability improvement. Realistically, all failures cannot be eliminated from a design, so another goal of reliability engineering is to identify the most likely failures and then identify appropriate actions to mitigate the effects of those failures. Reliability engineering checks the reliability and fault analysis of any system.
Reliability engineering has a wide scope and thus can be used in almost all fields. Be it, Civil engineering, computer science, electrical or mechanical, it’s found a unique place in almost all the fields. Reliability engineers check the durability and lifelong capacity of systems. It also helps engineers and business investors to think of different parameters which can lead to system failure and the ways from which those failures can be eliminated to certain extent. It’s a discipline associated with planning and coordinating to achieve a technological objective. It’s a measure of performance of many systems, subsystems and components. Reliability is a fundamental attribute for the safe operation of any modern technological system. Focusing on safety, reliability analysis aims at the quantification of the probability of failure of the system and its protective barriers.
II. DESCRIPTION OF THE ROBOT
The robot used in carrying out the experiment was a four wheeled mobile robot consisting of an on-board computer. The robot used was for ordinary operations but the operation or the experiment can be conducted with a large scale computer aided robots as well.
The reliability of a robot including the rate at which the operation is done plus the failure rate and availability were also recorded. As per Panagiotis and Fourlas [1], the records include the failures occurring per day, the action taken to repair the failure, the down time, and the exact time of failure. They used the classical use of analysis using the mathematical approach while this paper delves in the analysis using a simpler approach of using Cara Fault Tree.
For the wireless mobile robot, four main failures were recorded namely, 1. Fault in Encoder Reading, F1 (Failure chances 45%)
2. Gradual loss of tire pressure, F2 (Failure chances 30%)
3. Loss of wireless communication between the robot on board computer and the base station, F3 (Failure chances 17%) 4. Gradual Discharge of Battery, F4 (Failure chances 6%)
5. Malfunction of motor, F5 (Failure chances 2%)- Since the frequency of failure was low, it wasn’t used for further analysis.
III. CARA FAULT TREE SOFTWARE
Fault tree analysis techniques were first developed in the early 1960's. Since this time they have been readily adopted by a wide range of engineering disciplines as one of the primary methods of performing reliability and safety analysis. There are different types of software which can help to analyze or check out the reliability of system; here we used Cara Fault Tree to analyze the performance of a robot system. Fault trees graphically represent the interaction of failures and other events within a system. Basic events at the bottom of the fault tree are linked via logic symbols (known as gates) to one or more TOP events. These TOP events represent identified hazards or system failure modes for which predicted reliability or availability data is required. Fault tree diagrams represent the logical relationship between sub-system and component failures and how they combine to cause system failures. The TOP event of a fault tree represents a system event of interest and is connected by logical gates to component failures known as basic events.
After creating the diagram, failure and repair data is assigned to the system components. The analysis is then performed, to calculate reliability and availability parameters for the system and identify critical components. Mean Time before failure (MTBF), Mean Time To Repair (MTTR) and Availability were calculated using the standard formulas after retrieving the failure data.
IV. OBSERVATIONS
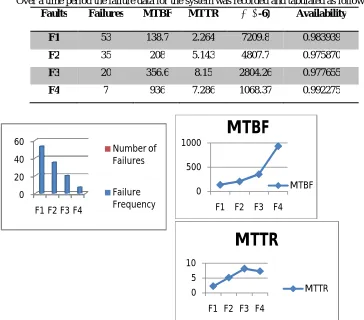
Over a time period the failure data for the system was recorded and tabulated as follows: Faults Failures MTBF MTTR λ (E-6) Availability
F1 53 138.7 2.264 7209.8 0.983939
F2 35 208 5.143 4807.7 0.975870
F3 20 356.6 8.15 2804.26 0.977655
F4 7 936 7.286 1068.37 0.992275
The above diagram shows the various data in the graph with F1 having highest frequency.
Figure 1: Observations on Graph
V. SIMULATIONS
In this paper, the reliability analysis is performed using CARA Fault Tree Analysis software that helps to construct and analyze fault tree diagrams. Owing to the simplicity of the recorded data, the fault tree constructed was a simple one with OR gate as the top level event denoting the failure of the robotic system. The four failures were represented using the basic event as shown in the figure.
0 500 1000
F1 F2 F3 F4
MTBF
MTBF
0 5 10
F1 F2 F3 F4
MTTR
MTTR 0 20 40 60F1 F2 F3 F4
Number of Failures
The analysis was performed for a time period of 8760 hours with 10 intervals. Hence the unavailability of the system was calculated using the upper bound approximation.
The system availability was calculated using the Monte Carlo Simulation with time period of 8760 hours with 100 simulations.
The mean time to first failure was calculated using numerical integration method and was found to be:
The component importance was observed using the upper bound approximation as follows:
VI. ANALYSIS
From the CARA Fault Tree Analysis the system availability over a time period of 8760 hours was found to be 0.931358 after Monte Carlo Simulation. The expected number of failure was found to be 129.824. The expected number of failures per unit time was observed as 0.0148201. Similarly, the mean time to first failure was 248.525. The maximum cut size taken into account was four in number and OR gate was taken as a top event. The number of simulations performed was roughly over 100. The standard error while calculating the system availabilty was 0.000697399.
VII. CONCLUSION
The reliability of the system is accessed using CARA Fault Tree and a lot flaws in ensuring the system reliability was observed. The system is further open to extensive improvement. One task which has gained significant relevance is maintenance, for its important fall backs to both productivity and safety.
VIII. ACKNOWLEDGEMENT
We would like to send our sincere gratitude to Prof. Dr. G. Ranga Janardhana, Director, Institute of Science and Technology (IST), JNTU Kakinada, who guided us in writing this paper.
REFERENCES
[1] Reliability Analysis of Mobile Robot: A case study Panagiotis H. Tsarouhas and George K. Fourlas.
[2] N. Kumar, J.-H. Borm, A. Kumar, “Reliability analysis of waste clean-up manipulator using genetic algorithms and fuzzy methodology”, Computers & Operations Research, Vol. 39, 2012, pp. 319-319.
[3] S.E. Rigdon, A.P. Basu, Statistical methods for the reliability of repairable systems. John Wiley and Sons, Inc, 2000, pp. 73-110.
[4] (Vinnem, 2007) Vinnem J.E., Seljelid J., Haugen S., Sklet S., Aven T., Generalised Methodology for Operational Risk Analysis, Proceedings of ESREL 2007, Stavanger, Norway, 25-27 June 2007, Volume 1, pp. 61-68.
[5] (Zio, 2007c) Zio E., An Introduction to the Basics of Reliability and Risk Analysis, World Scientific Publishing, 2007.
[6] (Zio et al., 2006) Zio E., Baraldi P., Patelli E., Assessing the Availability of an Offshore Installation by Monte Carlo Simulation, International Journal of Pressure Vessel and Piping, 83, 2006, pp. 312- 320.
[7] Aggrawal, K.K. and Gupta, J.S. (1975) „On minimising the cost of reliable systems‟, IEEE Transactions on Reliability, Vol. R-24, No. 3, p.205.
[8] Pecht, Michael 1995, Product Reliability,