~ 25 ~ WWJMRD 2017; 3(7): 25-29
www.wwjmrd.com Impact Factor MJIF: 4.25 e-ISSN: 2454-6615
Heavendeep Kaur Department of Computer Science and Engineering Guru Kashi University, Talwandi Sabo punjab, India
Dr. Sandeep Kautish Department of Computer Science and Engineering Guru Kashi University, Talwandi Sabo punjab, India
Correspondence: Heavendeep Kaur Department of Computer Science and Engineering Guru Kashi University, Talwandi Sabo punjab, India
A review on stock data prediction using predictive
data mining techniques
Heavendeep Kaur, Dr. Sandeep Kautish
Abstract
Prediction system of stock market is very crucial and essentially important because it deals with the huge amount of money and in today‟s growing and forward time, money is the first priority. The predicted value directly affects the stock price and no one take risk to drop down in stock market index. So due to money involvement and the reputation of the shares, stock market needs to be a perfect or more accurate prediction about their upcoming market trends. Various machine learning algorithms are used for stock data set and the objective is to predict the stock market. In this paper the different problems are reviewed, these are defined in the problem formulation and it is resolved with the help of multiple learning algorithms with NN and ensembling method that is implemented in the research work.
Keywords: Stock, Data, NN, prediction
Introduction
Classification is a predictive data mining technique, makes prediction about values of data using known results found from different data [1]. Predictive models have the specific aim of allowing us to predict the unknown values of variables of interest given known values of other variables. Predictive modelling can be thought of as learning a mapping from an input set of vector measurements to a scalar output [4]. Classification maps data into predefined groups of classes. It is often referred to as supervised learning because the classes are determined before examining the data. Prediction models that include all personal, social, psychological and other environmental variables are necessitated for the effective prediction of the performance of the students. The prediction of student performance with high accuracy is beneficial for identify the students with low academic achievements initially.
Stock market is the bone of fast emerging economies such as India. Major of capital infusion for companies across the country was made possible only through shares sold to people. So our country growth is tightly bounded with the performance of our stock market. Almost all the developing nations rely on their stock market for further strengthening of their economy. Any way in developing economies less than 10% of people are engaging themselves with stock market investment fearing the volatile nature of stock market. Many people felt that buying and selling of shares is an act of gambling which is a wrong notion. The applied techniques must yield consistent accurate results with certain level of accuracy always in order change the mindset of passive investors. By examining the literature stock
market prediction techniques can be grouped into four types [5]. 1) Technical analysis approach,
2) Fundamental analysis approach 3) Time series prediction
4) Machine learning algorithmic methods
~ 26 ~ Finally Machine learning methods consider set of samples in order to generate linear and nonlinear patters. The aim is to find out an expression that can generate the data [6].
Role of Data Mining in Stock Market
Many researchers attempts to predict stock prices by applying statistical and charting approaches. But those methods lacks behind heavily due to human biased decisions on stock market based on day to day mind set of human behaviour. By applying data mining in a suitable way hidden patterns can be uncovered which was not possible by traditional approaches. Also by applying business intelligence future price prediction with increased accuracy levels are possible with data mining techniques. The huge amount of data generated by stock markets forced the researchers to apply data mining to make investment decisions. The following challenges of stock market can be effectively addressed by mining techniques [1] [4].
1) Future stock price prediction
2) To generate effective patterns of past data for further analysis.
3) To optimally utilize the capital of share holders. 4) For the growth of country economy.
5) 5) To bring more investors to stock market who are lacking in analysis.
6) To stabilize the market.
7) To increase transparency in the market. 8) To check corruptive practices [5].
9) To bring more lazy and tech savvy investors into market.
All variants of prediction techniques can be classified into five significant types
Technical charting approach
Variable model
Fundamental analysis approach
Machine learning algorithm based methods Time series prediction
Technical charting approach
The charting approach is basically categorized as technical approach. It deals with voluminous historical data of stock prices of the concerned stocks [6].
Variable Model
This approach is working on examining the selected parameters analysis to predict the future price of stocks.
Fundamental analysis approach
This approach is alternately referred as true or real price prediction which primarily focuses on fundamentals of the company instead of price movement. It gives weightage to true value prediction instead of current price movement.
Machine learning algorithms
This method attempts to predict the movement of stock prices based on training given with the past value movements.
Time Series analysis
This method considers the time as important parameter to generate series of stock price movement.
Significance of Data mining for Stock price predictions: Several works are done to predict stock price movements based on charting historical values. The data mining techniques can address such issues. The hidden patterns can be discovered by applying data mining pattern matching techniques. It serves as the preliminary stage for gathering business information to estimate future needs. Many of the conventional methods failed to deliver in this issue[6]. Data mining techniques effectively addresses the challenges in which the traditional methods failed to deliver promising results. Some of them are:
Stock price prediction
Pattern generation with historical data Effective utilization of business capital
The economic development
Investor friendly analysis
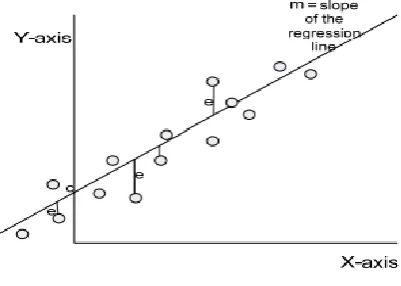
Overview of the Predictive Data Mining Algorithms Having discussed the data acquisition, and some data preprocessing techniques, an overview of the predictive techniques to be compared is given in this section. There are many predictive data-mining techniques (regression, neural networks, decision tree, etc.) but in this work, only the regression models (linear models) are discussed and compared. Regression is the relation between selected values of x and observed values of y from which the most probable value of y can be predicted for any value of x [12]. It is the estimation of a real value function based on finite noisy data. Linear Regression was historically the earliest predictive method and is based on the relationship between input variables and the output variable. A linear regression uses the dynamics of equation of a straight line (Figure 1.2) where y = mx + c (m being the slope, c the intercept on the y axis, and x is the variable that helps to evaluate y). In the case of the linear regression, Showing Data Points and the Prediction Line model, there is allowance for noise in the relationship and hence we can write the relationship thus:
Fig. 1: Regression Diagram.
Data Classification Preliminaries
In general, data classification is a two-step process. In the first step, which is called the learning step, a model that describes a predetermined set of classes or concepts is built by analyzing a set of training database instances. Each instance is assumed to belong to a predefined class. In the second step, the model is tested using a different data set that is used to estimate the classification accuracy of the model. If the accuracy of the model is considered acceptable, the model can be used to classify future data instances for which the class label is not known. At the end, the model acts as a classifier in the decision making process. There are several techniques that can be used for classification such as decision tree, Bayesian methods, rule based algorithms, and Neural Networks. Decision tree classifiers are quite popular techniques because the construction of tree does not require any domain expert knowledge or parameter setting, and is appropriate for exploratory knowledge discovery. Decision tree can produce a model with rules that are human-readable and interpretable. Decision Tree has the advantages of easy interpretation and understanding for decision makers to compare with their domain knowledge for validation and justify their decision. Some of decision tree classifiers are C4.5/C5.0/J4.8, NB Tree, and others. The C4.5 technique is one of the decision tree families that can produce both decision tree and rule-sets; and construct a tree for the purpose of improving prediction accuracy. The C4.5 / C5.0 / J48 classifier is among the most popular and powerful decision tree classifiers. C4.5 creates an initial tree using the divide-and-conquer algorithm. The full description of the algorithm can be found in any data mining or machine learning books such as (10).
WEKA toolkit (Witten et al., 2011) is a widely used toolkit for machine learning and data mining originally developed at the University of Waikato in New Zealand. It contains a large collection of state-of-the-art machine learning and data mining algorithms written in Java. WEKA contains tools for regression, classification, clustering, association rules, visualization, and data pre-processing. WEKA has become very popular with academic and industrial researchers, and is also widely used for teaching purposes. WEKA toolkit package has its own version known as J48. J48 is an optimized implementation of C4.5 rev. 8.
Data Acquisition
In any field, even data that seem simple may take a great deal of effort and care to acquire. Readings and measurements must be done on stand-alone instruments or
captured from ongoing business transactions. The instruments vary from various types of oscilloscopes, multi-meters, and counters to electronic business ledgers. There is a need to record the measurements and process the collected data for visualization, and this is becoming increasingly important, as the number of gigabytes generated per hour increases. There are several ways in which data can be exchanged between instruments and a computer. Many instruments have a serial port which can exchange data to and from a computer or another instrument. The use of General Purpose Instrumentation Bus (GPIB) interface boards allows instruments to transfer data in a parallel format and gives each instrument an identity among a network of instruments [11]. Another way to measure signals and transfer the data into a computer is by using a Data Acquisition board (DAQ). A typical commercial DAQ card contains an analog-to-digital converter (ADC) and a analog-to-digital-to-analog Converter (DAC) that allows input and output to analog and digital signals in addition to digital input/output channels [8]. The process involves a set-up in which physical parameters are measured with some sort of transducers that convert the physical parameter to voltage (electrical signal) [11]. The signal is conditioned (filtered and amplified) and sent to a piece of hardware that converts the signal from analog to digital, and through software, the data are acquired, displayed, and stored.
Data Filtering and Smoothing
Sometimes during data preprocessing, there may be a need to smooth the data to get rid of outliers and noise. This depends to a large extent, however, on the modeler‟s definition of "noise." To smooth a dataset, filtering is used. A filter is a device that selectively passes some data values and holds some back depending on the modeler‟s restrictions [13]. There are several means of filtering data. Moving Average: This method is used for general-purpose filtering for both high and low frequencies [12]. It involves picking a particular sample point in the series, say the third point, starting at this third point and moving onward through the series, using the average of that point plus the previous two positions instead of the actual value. With this technique, the variance of the series is reduced. It has some drawbacks in that it forces all the sample points in the window averaged to have equal weightings.
Median Filtering: This technique is usually used for time-series data sets in order to remove outliers or bad data points. It is a nonlinear filtering method and tends to preserve the features of the data [11]. It is used in signal enhancement for the smoothing of signals, the suppression of impulse noise, and the preserving of edges. In a one-dimensional case, it consists of sliding a window of an odd number of elements (windows 3 and 5) along the signal, replacing the center sample by the median of the samples in the window. Median filtering gets rid of outliers or noise, smoothes data, and gives it a time lag.
Peak-Valley Mean (PVM): This is another method of removing noise. It takes the mean of the last peak and valley as an estimate of the underlying waveform. The peak is the value higher than the previous and next values and the valley is the value lower than the last and the next one in the series [14].
~ 28 ~ data and the data set [15]. Most models work well with normalized data sets. The measured values can be scaled to a range from -1 to +1. This method includes both the decimal and standard deviation normalization techniques. For the purpose of this work, the latter is used. This method involves mean-centring (subtracting the column means from the column data) the columns of the data set and dividing the columns by the standard deviation of the same columns. This is usually used to reduce variability (dispersion) in the data set. It makes the data set have column means of zero and column variances of one, and it gives every data sample an equal opportunity of showing up in the model.
Literature Review
Pankaj Kumar et al. (2016) have studied Cloud
computing is the one of the admired paradigms of current era, which facilitates the users with on demand services and pay as you use services. It has tremendous applications in almost every sphere such as education, gaming, social networking, transportation, medical, business, stock market, pattern matching, etc. Random forest have been consider as the most effective model as it yield the highest accuracy of 54.12% whereas decision tree and linear model gives the accuracy of 51.87% and 52.83% respectively.[1]
G. S. Navale et al. (2016) have studied Predicting anything is very hard where the relationship between inputs and outputs are non-linear in nature. The prediction of stock market values is one of a challenging task of financial time series. They proposed the system which will study the database of shares and will give predictions according to it. With the help of study of neural networks the system will be designed and based on. For prediction particularly ARMA (autoregressive-moving average) algorithm is used. Hence the system will be able to give highest probability predictions for particular shares.[2]
Shashaank D.S et al. (2015) have investigated various existing classification algorithms to predict the turnover of different companies based on the Stock price. The authorized dataset for predicting the turnover was taken from www.bsc.com and included the stock market values of various companies over the past 10 years. The algorithms were investigated using the „R‟ tool. An accuracy rate of 95% was achieved by the above prediction process. Moreover, the importance of the stock market attributes was established as well.[3]
Ruchi Desai et al. (2014) have studied Data mining is well founded on the theory that the historic data holds the essential memory for predicting the future direction. This technology is designed to help investors discover hidden patterns from the historic data that have probable predictive capability in their investment decisions. It uses different techniques and strategies to predict ups and downs in stock market. In this paper, we present a model that predicts the changes of stock trend by analyzing the influence of non- quantifiable information namely the news articles which are rich in information and superior to numeric data. [4]
S.Prasanna et al. (2013) have studied Stock market data analysis needs the help of artificial intelligence and data
mining techniques. The volatility of stock prices depends on gains or losses of certain companies. Data mining techniques can be applied on past and present financial data to generate patterns and decision making algorithms. In this paper we have discussed several attempts made by researches for stock price prediction. These works show that data mining techniques can be applied for evaluation of past stock prices and acquire valuable information by estimating suitable financial indicators.[5]
Research Problem
In the research topic Stock Data Prediction using Predictive Data Mining the different problems are faced from the above literature survey.
One problem is a binary classification problem with output values as 0 and 1.
There is set of prediction problem. Another problem is the accuracy problem.
The problem of stock trading as do not know which stocks to buy and which to sell in order to gain more profits.
There is a problem of stock price forecasting.
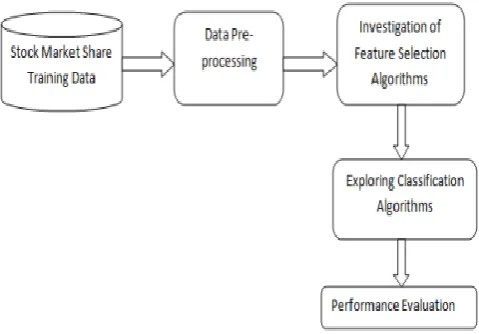
Proposed Stock Turnover Prediction Framework The stock turnover prediction framework proposed is shown in Figure 4.1. The basic methodology involved Data Collection, Pre-processing, Feature Selection and Classification, each of which is explained below.
The dataset utilised for predicting the turnover was taken from www.bsc.com which included the stock market values of companies including Infosys, HDFC, Apollo Hospitals and Sintex, over the past 10 years. While performing any experiment it is necessary to have a dataset and a proper methodology as to how to work on that dataset so that a proper prediction could be made in lieu of future decisions to be made. In our experiment of prediction of stock market, we have a stock dataset with 21 features, 57772 data entries and target at 22nd position. It is a binary classification problem [15] with output values as 0 and 1; so therefore we have to apply classification models of machine learning [5]. Before using any model with the dataset, we must ensure that our data is pre-processed; it means that dataset should be in. CSV (comma separated values) format, there should be no null values or any noisy data in the dataset.
Fig. 2: Stock Turnover Prediction framework
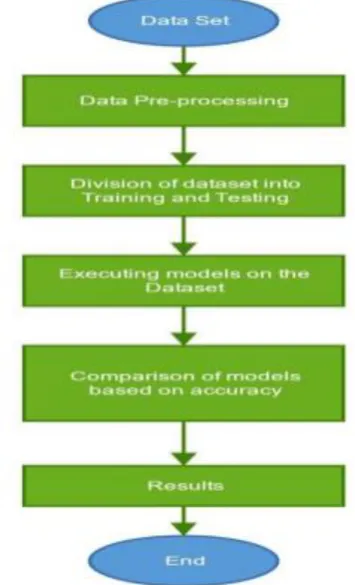
data subset (normally it is in 70:30 ratio but it could be changed as per the experimenter's requirements or as per the performance of the model). Once the dataset is divided into training and testing data subsets, classification models are executed on the dataset and results are generated in the form of evaluation parameters such as H, Gini, AUC, F-measure, Sensitivity, Specificity, TPR, FPR, Error Rate, Recall, Precision, Accuracy and Time. Any of the above mentioned parameters can be chosen to compare the results, we have chosen accuracy parameter to compare the classification models and choose the best one giving the most accurate results. Confusion Error matrix show the true positive rate and false positive rate.
Fig. 3: Approach to solve Classification problem
Conclusion
In this paper I have reviewed the stock prediction and concluded the problems like, three machine learning models have been used. These models are: Decision tree model, linear model and Random forest model. We make two divisions of data, first is training data and second is testing data. Firstly these models train the data then after completion of training, test the data and find all the evaluation parameters of all models. We also find the accuracy of these models. It is implemented in the future.
References
1. Pankaj kumar et al. (2016) “Intelligent Stock Data Prediction using Predictive Data Mining Techniques” IEEE, pp.-1-5.
2. G. S. Navale et al. (2016) “Prediction of Stock Market using Data Mining and Artificial Intelligence” International Journal of Computer Applications (0975 – 8887) Volume 134 – No.12, January 2016.
3. Shashaank D.S et al.(2015) “Turnover Prediction Of Shares Using Data Mining Techniques: A Case Study” IEEE,pp.-1-8
4. Ruchi Desai et al. (2014) “Stock Market Prediction Using Data Mining” IJEDR | Volume 2, Issue 2 | ISSN: 2321-9939, 2014.
5. S.Prasanna et al. (2013) “An analysis on Stock Market Prediction using Data Mining Techniques” S.Prasanna et al./ International Journal of Computer Science & Engineering Technology (IJCSET), ISSN : 2229-3345 Vol. 4 No. 02 Feb 2013.
6. Qasem A. Al-Radaideh et al.(2012) “Using Data Mining Techniques to Build a Classification Model for Predicting Employees Performance” (IJACSA) International Journal of Advanced Computer Science and Applications, Vol. 3, No. 2, 2012.
7. Shou-Hsiung Cheng, ―Forecasting the Change of Intraday Stock Price by Using Text Mining News of Stock‖, IEEE,2010.
8. Klibanoff, P., Lamont, O., and Wizman, T.A., 1998. Investor Reaction to Salient News in Closed-end Country Funds. Journal of Finance, 53(2), pp.673-699. 9. Mitchell, M.L., Mulherin, J.H., 1994. The Impact of Public Information on the Stock Market. Journal of Finance, 49(3),pp.923-950.
10. Berry, T.D., Howe, K.M., 1994. ―Public Information Arrival.‖ Journal of Finance, 49(4), pp.1331–1346. 11. Wuthrich, B., Permunetilleke, D., Leung, S., Cho, V.,
Zhang, J., and Lam, W., Daily Stock Market Forecast from Textual Web Data. In IEEE International Conference on Systems, Man, and Cybernetics (San Diego, California, October 11-14, 1998). IEEE Press, Vol.3, pp.2720-2725.