Analysis and Optimization Of
Performance Parameters of Diesel Engine
Using Biodiesel
K.Dharma Teja
Graduate, Department of Mechanical Engineering, G.Pulla Reddy Engineering College, Kurnool, India1
ABSTRACT: In the present scenario of automobiles, an engine has to satisfy the strict environmental constraints and fuel economy standards. As the world is facing crisis due to the dwindling resources which is a matter of serious concern for the mankind. So there is a necessity to find alternate fuels or fuel additives. In the present paper, palm oil &Nano fuel
additive are used as additives to run diesel engine and check its performance. The present work aims at optimizing the
total fuel consumption and brake thermal efficiency of a diesel engine with various proportionate blends of Diesel, palm
oil &Nano fuel additive. This is a statistical method used to optimize the input parameters to get the maximum results.
Response surface design with user defined data is considered for modelling, analysing and optimizing the performance of the engine. A proven response has been extracted with improved efficiency and compensated fuel consumption.
KEYWORDS: Alternate Fuels, palm oil ,Nano fuel additive, Response Surface Design, Total Fuel Consumption, Brake Thermal Efficiency.
I. INTRODUCTION
Diesel Engine plays a dominant role in the field of power, propulsion and energy. The diesel engine is a type of internal combustion engine; more specifically it is a compression ignition engine in which the fuel is ignited solely by the high temperature created by compression of air fuel mixture. The engine operates using the diesel cycle. The diesel engine is more efficient than the petrol engine since the spark ignition engine consumes more fuel than compression ignition engine.Palm oil, traditionally prepared from sun flower trees. Till today’s knowledge, palm oil is used in food items. Due to its thermal properties like flash point, fire point, etc., palm oil satisfies all the properties of a fuel. Palm oil is proposed to be environment friendly oil, which produces harmless exhaust to the environment. Nano fuel additive is
prepared from Palmyrah tree. This additive is used in automobile vehicles. It is used for enhancement of the
combustion and also reduces the emissions. The present study is an experimental test and analysis of a diesel engine with partial addition of palm oil, nano additive with diesel.
TABLE I.FUEL CHARACTERISTICS OF DIESEL PALM OIL &NANO ADDITIVE
Properties Diesel Palmoil Nano additive
Specific gravity (kg/l) at 150C 0.8527 0.880 0.867
viscosity (p oise) 0.830 0.506 0.811 Calorific value (KJ/kg) 42000 17750 12000
Flash Point (0C) 41 250 60
II. LITERATUREREVIEW
Experimental Investigation of Performance and Emission Characteristics of Mahua Biodiesel in Diesel Engine :
S. Savariraj, T. Ganapathy and C. G. Saravanan presented the results of investigation of performance and emissions characteristics of diesel engine using Mahua biodiesel and found that, the blends of varying proportions of Mahua biodiesel and diesel were prepared, analyzed compared with the performance of diesel fuel, and studied using a single cylinder diesel engine. The tests showed decrease in the brake thermal efficiencies of the engine as the amount of Mahua biodiesel in the blend increased. The maximum percentage of reduction in BTE (14.3%) was observed for B-100 at full load. The exhaust gas temperature with the blends decreased as the proportion of Mahua increases in the blend. The smoke, Co, and No emissions of the engine were increased with the blends at all loads. However, Hc emissions of Mahua biodiesels were less than that of diesel.
Effect of diesel addition on the performance of cottonseed oil fuelled DI diesel engine :
Leenus Jesu Martin, Edwin Geo, Prithviraj's investigation on the viscosity of cottonseed oil, which has been considered as an alternative fuel for the compression Ignition (C.I) engine was decreased by blending with diesel. The blends of varying proportions of cottonseed oil and diesel were prepared, analyzed and compared with the performance of diesel fuel and studied using a single cylinder C.I. engine. Significant improvement in engine performance was observed compared to neat cottonseed oil as a fuel. The brake thermal efficiency, specific fuel consumption, volumetric efficiency, peak cylinder pressure, smoke, CO, HC, NO and the exhaust gas temperatures were analyzed. The tests showed increase in the brake thermal efficiencies of the engine as the amount of diesel in the blend increased. The volumetric efficiency of the engine also increased when compared with that of neat cottonseed oil and the exhaust gas temperature with the blends decreased. The smoke, CO and HC emissions of the engine ware also less with the blends. From the engine test results it has been established that 20–40% of cottonseed oil can be substituted for diesel without any engine modification as a fuel.
III.PROPOSEDWORK
The present work is to blend palm oil and nano additive with diesel in various proportions and observed performances on diesel and Bio diesel by varying injector pressure, finding out the performance measures (TFC and BTE) for each combination by running on 5HP Diesel engine and optimization of the same simultaneously.
A. Experimental Setup:
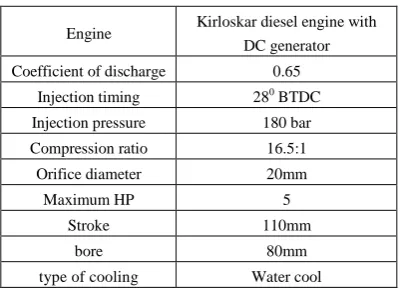
A single cylinder 4-stroke water cooled diesel engine having 5HP as rated power at 1500rpm was used for the experimentation & the table shows Engine Specifications
TABLE II. ENGINE SPECIFICATIONS:
Engine Kirloskar diesel engine with DC generator Coefficient of discharge 0.65
Injection timing 280 BTDC
Injection pressure 180 bar Compression ratio 16.5:1
Orifice diameter 20mm
Maximum HP 5
Stroke 110mm
bore 80mm
B. Experimentation and plan of investigation:
The following points are to be considered for investigating the experimentation:
o Develop the design matrix and Conduct the experiments as per the design matrix.
o Record the responses, viz. Brake Thermal Efficiency (BTH) and Specific fuel consumption (SFC).
o Develop the mathematical model.
o Test the adequacy of the mathematical model.
o Validate the mathematical model and get the optimized set of parameters.
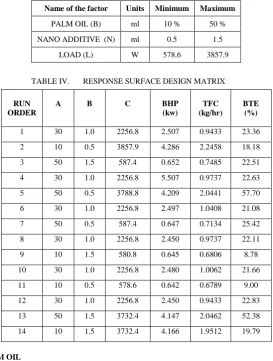
Below are the Max & Min range of input values along with the Short designations & units used for constructing the Response surface design matrix
TABLE III. EXPERIMENTAL RANGE FOR THE CONSIDERED PARAMETERS
Name of the factor Units Minimum Maximum
PALM OIL (B) ml 10 % 50 % NANO ADDITIVE (N) ml 0.5 1.5
LOAD (L) W 578.6 3857.9
TABLE IV. RESPONSE SURFACE DESIGN MATRIX
A -- BLEND IN ‘%’ OF PALM OIL B-- NANO ADDITIVE IN ‘ML’ C-- LOAD IN ‘W’
RUN ORDER
A B C BHP
(kw)
TFC (kg/hr)
BTE (%)
IV.EXPERIMENTALANALYSISOFBTE
Based on the results obtained during the experimentation, Graphs are plotted by considering the Blend, Nano Additive & Loads on the X -Axis and Brake thermal efficiency on the respective Y-Axis. As shown in below
Fig.2. Performance chart for Brake Thermal Efficiency, BTE. From the above graph, it can be experimentally analysed that:
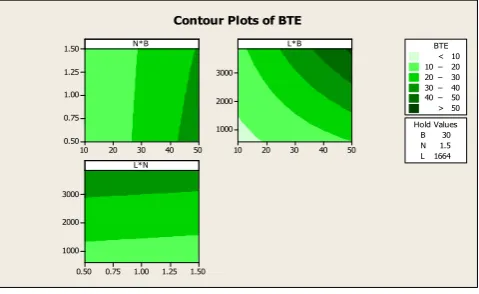
With the increase in percentage of palm oil, Brake thermal efficiency has been increased and at 50% blend,
BTE showed its peak value of around 41%.
With the increase 0.5-1.0 ml of nano additive, Brake thermal efficiency has been reduced and the nano
additive is increased from 1.0-1.5 ml of nano additive, Brake thermal efficiency has been increased and at 1.5 ml of nano additive, BTE showed its peak value of around 25%.
With increase in load, Brake thermal efficiency has been increased and at 3788.7 W of load, BTE showed its
peak value of around 58% and further the load is increased the Brake thermal efficiency has been reduced.
V. EXPERIMENTALANALYSISOFTFC
Based on the results obtained during the experimentation, Graphs are plotted by considering the Blend, Nano Additive & Loads on the X -Axis and Total Fuel Consumption on the respective Y-Axis. As shown in below
Fig.3. Performance chart for Total Fuel Consumption, TFC.
With increase in percentage of palm oil, Total fuel consumption has been reduced, further the blend is increased, Total fuel consumption has been increased and at 50% blend, TFC showed its lowest value of around 1.325 kg/hr.
With increase the 0.5-1.0 ml of nano additive, total fuel consumption has been reduced, further the nano additive
is increased, Total fuel consumption has been increased and at 1.5 ml of nano additive, TFC showed its lowest value of around 1.315 kg/hr.
With increase the load, Total fuel consumption has been increased, at no load (578.6W) condition, TFC showed
its lowest value of around 0.625 kg/hr.
The above observations drawn from a sample of experiments lead to the statistical analysis for enhancement of performance of the engine with the optimal set of input
parameters. This includes the conductance of ANOVA to test the significance of the conducted experiments.
A. ANOVA (Analysis Of Variance):
ANOVA is conducted for testing the significance of the input factors to influence the performance measures of the experiment. The empirically developed mathematical model form the regression process links a quantitative dependent variable BTE, TFC to the selected independent variables or the design and control parameters (Average load and Blend) selected. The statistical tool MINITAB is used for this. Regression analysis provides a method of linking the performance variable with the design parameters through a mathematical model if more than one design parameter affecting the response parameters are there still linear regression can be used to mathematically link the dependent variable to the independent ones. This is termed as multiple regressions. The typical regression model is given as,
Y=β0+ β1X1+ β2X2+ β3X3+ β4X4+ β5X5+C.--- (1)
Where, Ydependent variable,
β0, β1,.. model coefficients,
X1, X2, .... independent variables and
C constant (intercept of the predicted model).
This model is natural extension of the simple linear regression model.
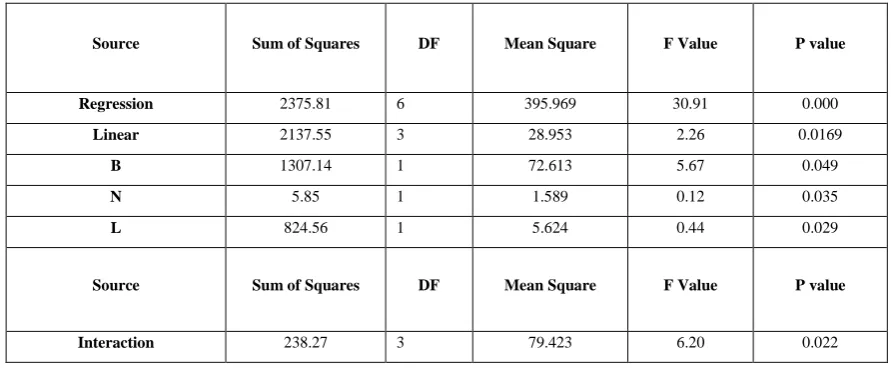
TABLE V. ANOVA TABLE FOR BRAKE THERMAL EFFICIENCY
ANOVA results for the BTE are tabulated and based on these values analysis and formation of mathematical equation is carried ahead
Source Sum of Squares DF Mean Square F Value P value
Regression 2375.81 6 395.969 30.91 0.000
Linear 2137.55 3 28.953 2.26 0.0169
B 1307.14 1 72.613 5.67 0.049
N 5.85 1 1.589 0.12 0.035
L 824.56 1 5.624 0.44 0.029
Source Sum of Squares DF Mean Square F Value P value
B*N 12.61 1 11.163 0.87 0.0382
B*L 225.65 1 225.608 17.61 0.004
N*L 0.00 1 0.002 0.00 0.0990
Residual Error 89.68 7 12.811 - -
Lack-of-Fit 86.23 2 43.117 62.59 0.000
Pure Error 3.44 5 0.689
- -
Total 2465.49 13 - - -
The Model F-value of 30.91 implies the model is significant. Values of "Prob > F" (p-value) less than 0.0500 indicate model terms are significant. In this case B, N, L, B*N, B*L and N*L are significant model terms.
TABLE VI. R-SQUARED RESULTS FOR BRAKE THERMAL EFFICIENCY :
R-squared is a statistical measure of how close the data are to the fitted regression line. It is also known as the coefficient of determination, or the coefficient of multiple determination for multiple regression.
R-Squared 0.9636 Adj R-Squared 0.9324 Pred R-Squared 0.4909 Adeq Precision 72.186
The "Pred R-Squared" of 0.4909 is in reasonable agreement with the "Adj R-Squared" of 0.9325. "Adeq Precision" measures the signal to noise ratio. Adequate precision of 72.18 is a satisfactory value for which 4 is the
required.
The results can be expressed in 2D or 3D models, Here 2D contour plot is used for visualization of result for BTE taking B,N,L on the required axis.
Fig. 4:Contour plot for Brake thermal efficiency Mathematical Equation:
Finally the approximate Mathematical equation for the Input variables & Responses can be expressed as
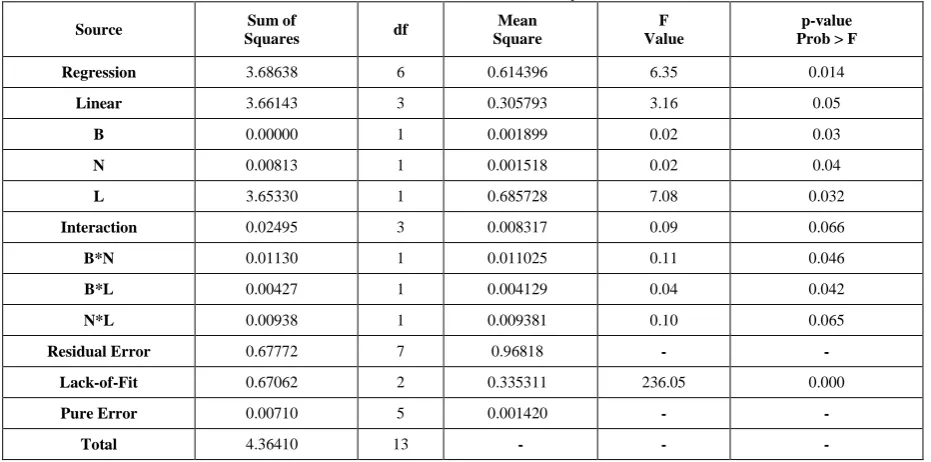
TABLE VII. ANOVA TABLE FOR TOTAL FUEL CONSUMPTION, TFC
ANOVA results for the TFC are tabulated and based on the values analysis is carried ahead
Source Sum of
Squares df
Mean Square
F Value
p-value Prob > F
Regression 3.68638 6 0.614396 6.35 0.014
Linear 3.66143 3 0.305793 3.16 0.05
B 0.00000 1 0.001899 0.02 0.03
N 0.00813 1 0.001518 0.02 0.04
L 3.65330 1 0.685728 7.08 0.032
Interaction 0.02495 3 0.008317 0.09 0.066
B*N 0.01130 1 0.011025 0.11 0.046
B*L 0.00427 1 0.004129 0.04 0.042
N*L 0.00938 1 0.009381 0.10 0.065
Residual Error 0.67772 7 0.96818 -
-Lack-of-Fit 0.67062 2 0.335311 236.05 0.000
Pure Error 0.00710 5 0.001420 -
-Total 4.36410 13 - - -
The Model F-value of 6.35 implies the model is significant. Values of "Prob > F"(p-value) less than 0.0500 indicate model terms are significant. In this case B, N, L, B*N, B*L and N*L are significant model terms. Values greater than 0.1000 indicate the model terms are not significant.
TABLE VIII. R-SQUARED RESULTS FOR TOTAL FUEL CONSUMPTION, TFC
R-squared is a statistical measure of how close the data are to the fitted regression line. It is also known as the coefficient of determination, or the coefficient of multiple determination for multiple regression.
The "Pred R-Squared" of 0.000 is in reasonable agreement with the "Adj R-Squared" of 0.7116. "Adeq Precision" measures the signal to noise ratio. A ratio greater than 4 is desirable. A ratio of 26.908 indicates an adequate signal.
The results can be expressed in 2D or 3D models here 2D contour plot is used for visualizing the result obtained for TFC taking B,N,L on the required axis.
Fig. 5Contour plot for Total fuel consumption MathematicalModel:
Finally the approximate Mathematical equation for the Input variables & Responses can be expressed as
TFC = 0.29088-0.002030B-0.062413N+0.000486L +0.003713B*N-0.000001B*L-0.000043N*L
VI. OPTIMIZATION
In the present study, the goal is to be set to improve the brake thermal efficiency while decreasing the total fuel consumption for the better performance of engine. But simultaneous optimization results in a compensative work which tends to move the dependent factors towards the target. i.e., a combination of factors for maximum BTE may not give the minimum value of TFC and vice versa. So, the multi objective optimization comes into picture which makes a compensative work for both the performance measures. The following are some of the combination of input factors (Nano additive (ml), Load (w) and Blend (%)) for targeted dependent variables (TFC and BTE) based on desirability function. Desirability pertains to a multiple response method. The method makes use of an objective function, D(X),
called the desirability function. It reflects the desirable ranges for each response (di). The desirable ranges are from zero
to one (least to most desirable, respectively). The simultaneous objective function is a geometric mean of all transformed responses:
D= (d1Xd2Xd3Xd4X----X dn)1/n ---(2)
Where, n is the number of responses in the measure. If any of the responses or factors fall outside their
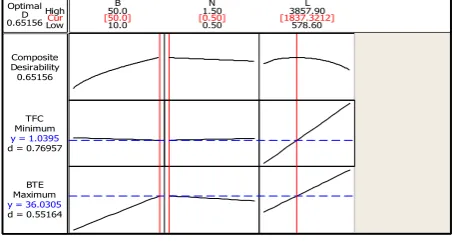
desirability range, the overall function becomes zero. fig.6 shows the Optimization plot for TFC & BTE & Table IX
shows the optimal set of input and output values.
Fig 6.Optimization plot for TFC & BTE
TABLE IX. OPTIMAL SET OF INPUT AND OUTPUT VALUES N*B 50 40 30 20 10 1.50 1.25 1.00 0.75 0.50 L*B 50 40 30 20 10 3000 2000 1000 L*N 1.50 1.25 1.00 0.75 0.50 3000 2000 1000 B 30 N 1.5 L 1664 Hold Values > – – – – – < 0.50 0.50 0.75 0.75 1.00 1.00 1.25 1.25 1.50 1.50 1.75 1.75 TFC
Contour Plots of TFC
Cur
High Low 0.65156D Optimal
d = 0.76957 MinimumTFC
y = 1.0395
d = 0.55164 MaximumBTE
y = 36.0305
0.65156 DesirabilityComposite 578.60 3857.90 0.50 1.50 10.0
50.0B N L
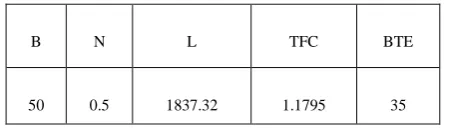
Based on the plot the optimal values for the carried experiment can be concluded as 50% blend with 0.5 nano additive will give maximum BTE and reasonable TFC under load of 1837.3212
B (%) Nano Additive (N) Load (V*I) TFC (kg/hr) BTE (%)
50 0.5 1837.3212 1.0395 36.0305
A. Confirmatory Tests
After selecting the optimal levels of the engine, the final step is to verify the results using the optimum design parameter levels in comparison with standard engine parameters with biodiesel fuel. A Confirmation test for the combined objective is conducted by choosing the five design and control parameters as given in Table-5. This setting is for the combined objective with 25% weighted assigned for each output response variable. The results are which runs are well than any of the other combinations in the test. Thus for the engine the optimum set for conditions may be stated as A3 B1 C3 D4 and E1 which is the optimum for the combined objective of minimizing both the fuel
consumption and emissions. The confirmation test was conducted with optimized parameters given in Table-
x
.TABLE X. CONFORMATORY SET OF INPUT AND OUTPUT VALUES
Cost analysis:
With pure diesel the engine we get 12.56% Brake thermal efficiency and it takes 1.43 kg/hr diesel where diesel costs about Rs.60 but on use of Bio diesel, the engine gives 35% Brake thermal efficiency and it takes 1.179 kg/hr. Bio diesel Costs Approximately Rs.65. There by though 8% of cost is increased but the BTE is increased by 140% and Total fuel consumption can be reduced by 17%.
For the same amount of energy output, Less biodiesel is required. Hence the cost of fuel can be reduced around Rs.30.
B. Result and Discussion:
Brake Thermal Efficiency and Total Fuel Consumption are related individually to the independent variables (blend, nano additive and load) with a cubic mathematical model. Also required combination of values of the-engine and oil parameters can be determined by substituting the values of Brake Thermal Efficiency and Total Fuel Consumption values. The effect of engine and oil parameters on Brake Thermal Efficiency and Total Fuel Consumption were determined quantitatively using models and are represented in graphs. These graphs show generally convincing trends between cause and effect.
VII. CONCLUSIONS
From above results it can be concluded that Brake Thermal Efficiency has increased doubled and Total Fuel
Consumption can be decreased.
From the optimal values of Total Fuel Consumption and Brake Thermal Efficiency, the required values of inputparameters can be selected in order to reduce fuel consumption and increase the brake thermal efficiency.
B N L TFC BTE
When diesel blended with palm oil and nano additive it forms a feasible and homogeneous mixture. Though the blend is not economical but literally gives double the efficiency. Hence there is scope for analysis on optimization of cost.
After optimal setup of the design matrix, the compromised and satisfactory inputs are extracted as 1837.32 W, 50%palm oil and 0.5 ml of nano additive giving a better BTE (35%) with reasonable TFC (1.179kg/hr).
With use of optimal values the cost of fuel is reduced around Rs.30 and 8% of the cost is increased 140% of Brakethermal efficiency is increased, and 17% of the fuel is reduced.
Among different blends reasonable values for HC is obtained for the blend B4, except HC all the parameters got
same values at different blends. Therefore reduced emissions and other harmful pollutants with use of B4 (50% palm oil.0.5ml nano additive and 50% diesel).
REFERENCES
[1] S. Savariraj, T. Ganapathy and C. G. Saravanan, “Experimental Investigation of Performance and Emission Characteristics of Mahua Biodiesel in Diesel Engine”, ISRN Renewable Energy, Volume 10, August, 2011.
[2] S. Ashfaque Ahmed, S. Prabhakar, Binu, K. Soloman and M. Irshad Ahmed, “Performance Test For Lemon Grass Oil In Twin Cylinder Diesel Engine”, ARPN Journal of Engineering and Applied Sciences, Vol. 8, No. 6, PP 435-437,June 2013.
[3] E. Lang, S. J. Wagner, D. Clark, and M. Schrock, “Effects of soybean oil esters on the performance, lubricating oil and wear of diesel engines,” SAE Paper, Tech. Rep. 841385, 2001.
[4] K. P. Mcdonell, S. M. Ward, P. B. Menulty, and H. R. Howard, “Results of engine and vehicle testing of semi refined rapeseed oil,” Transactions of American Society of Agricultural Engineers, vol. 43, no. 6, pp. 1309–1316, 2000.
[5] V. S. Yaliwal, S. R. Daboji, N. R. Banapurmath, and P. G. Tewari, “Production and utilization of renewable liquid fuel in a single cylinder four stroke direct injection compression ignition engine” International Journal of Engineering Science and Technology, vol. 2, no. 10, pp. 5938– 5948, 2010.
[6] M. Leenus Jesu Martin, V. Edwin Geo, and D. Prithviraj, “Effect of diesel addition on the performance of cottonseed oil fuelled DI diesel engine,” International Journal of Energy and Environment, vol. 2, no. 2, pp. 321–330, 2011.
[7] T. Ganapathy and A. Senthil Kumar, “Rice bran oil methyl ester as fuel in compression ignition engines,” Engineering Today, no. 11, pp. 27– 28, 2003.
[8] T. Ganapathy, K. Murugesan, and R. P. Gakkhar, “Performance optimization of Jatropha biodiesel engine model using Taguchi approach,” Applied Energy, vol. 86, no. 11, pp. 2476–2486, 2009
[9] T. Ganapathy, R. P. Gakkhar, and K. Murugesan, “An analytical and experimental study of performance on Jatropha biodiesel engine,” Thermal Science, vol. 13, no. 3, pp. 69–82, 2009.
[10] M. Mani, C. Subash, and G. Nagarajan, “Performance, emission and combustion characteristics of a DI diesel engine using waste plastic oil,” Applied Thermal Engineering, vol. 29, no. 13, pp. 2738–2744, 2009.
[11] J. T. Song and C. H. Zhang, “An experimental study on the performance and exhaust emissions of a diesel engine fuelled with soybean oil methyl ester,” Journal of Automobile Engineering, vol. 222, no. 12, pp. 2487–2496, 2008.