T H E INHERITANCE OF DIFFERENCES I N T H E LYSOZYME LEVEL OF HENS’ EGG WHITE
F. H. WILCOX, JR.’ AND R. K. COLE
Department of Poultry Husbandry, Cornell University Agricultural Experiment Station, Ithaca, New York
(Received November 27, 1956)
YSOZYME is an enzyme first described by FLEMING (1922) which lyses many
L
nonpathogenic bacteria by depolymerization of an acetylated amino-polysac- charide of their cell wall. Many of its chemical and physical attributes are now known; it is characterized by a relatively low molecular weight (about 15,000) and an un- usually high isoelectric point (pH 10.8). Further details can be found in the excellent reviews by THOMPSON (1940) and HARTSELL (1949).The occurrence of lysozyme is much wider than is generally realized. FLEMING’S original paper described its presence in nearly all tissues and secretions of the human body. It is present in the tissues of most vertebrates and in some bacteria, but is ab- sent in most plants tested. The highest concentration yet demonstrated is in the albumen of birds’ eggs. FLEMING and ALLISON (1924), SMOLELIS and HARTSELL
(1951), WETTER et al. (1953), and MACDONNELL et al. (1954) have reported large differences in lysozyme concentration in the albumens of different species of birds. The chicken ranked higher than all other tested species except the quail, whereas the duck and goose ranked among the lowest. Highly significant differences between strains of domestic fowl have been demonstrated both by COTTERILL and WINTER (1954) and by WILCOX (1956).
This report deals with the mating results of birds selected for differences in the lysozyme level of their egg white. The primary aim has been the elucidation of the genetic nature of such differences, but a secondary aim has been a clarification of the function of lysozyme in egg white. The amount of lysozyme found therein (4.5 mg/ml) is approximately 250 times as much as that required for maximal activity against susceptible bacteria; indeed, the enzyme is inactive a t these high concen- trations (WILCOX and DANIEL 1954). This seeming paradox suggests that lyso- zyme of egg white might have an additional function besides lysis of bacteria.
The procedure for investigation of these relationships has included the establish- ment and subsequent crossing of lines that differ genetically in respect to the lysozyme concentration of their egg white. An additional function of lysozyme might possibly be revealed by degree of association with differences in other traits in these lines. To offset the probable occurrence of chance differences unrelated to lysozyme concentra- tion, this procedure was followed with two strains instead of one. Even so, it is realized that the occurrence of similar differences within both strains would provide little more than a hint, and that supporting evidence from additional sources would be required for proof of another function of lysozyme.
LYSOZYME LEVEL OF EGG WHITE 265
Strain Sire Dam Within dam
MATERIAL AND METHODS
On the day after an egg was laid, its albumen was mixed for five seconds in a War- ing blendor and stored in a corked shell vial a t -20°C until analyzed for lysozyme. In no case did the period of storage prior to analysis exceed one month. Analysis for lysozyme was made by using the method of WILCOX and COLE (1954), which com- pares the amount of clearing of a suspension of bacteria by known amounts of egg white to that obtained by known amounts of crystalline lysozyme.
The general procedure followed was to analyze two dilutions of egg white from one egg laid when the bird was between 10 and 12 months of age. The basis for this pro- cedure has been detailed elsewhere (WILCOX 1956). Deviations from the general pro- cedure included: the use of only one dilution for each egg white in the survey of two strains; the analysis of two eggs laid two weeks apart for third generation birds; and an analysis of an additional egg from each of the second generation birds a t seven months of age. All eggs from a given experiment or generation were always analyzed in a random sequence.
1 2 . 5 3
4 0.453
24 1.305
120 0 . 6 2 6
RESULTS
Variation within two strains
Although strains were known to differ in the lysozyme level of their egg white, it appeared that differences within a strain would lend themselves better to genetic analysis. An experiment was therefore performed for detection of exceptional families with respect to lysozyme level within two strains (C and K) of White Leghorn fowl maintained a t Cornel1 University. Five birds were selected a t random from each of
51 dam-families and an egg from each bird subsequently analyzed.
An analysis of variance of the results is given in table 1. Because of the dispropor- tionate number of dam-families per sire, it was necessary to select five of them for use in the statistical analysis, but since this selection was at random the results can be extended to the survey as a whole. This analysis shows that there are highly sig- nificant differences due to dam, but that the differences between the six sires and be- tween the two strains are not significant.
Selection of individuals for matings
After establishing that differences between dam-families exist it was a simple matter to select a high and a low family from each strain. Then, eggs from all hens in these
TABLE 1
Analysis of variance of data from a j o c k survey on the lysozyme concentration i n egg white
Source
I
d.f.I
Mean sq.I
F.266 F. H. WILCOX, JR. AND R. K. COLE
C High
4 . 6 5 . 9 5.7 5 . 1 6 . 5
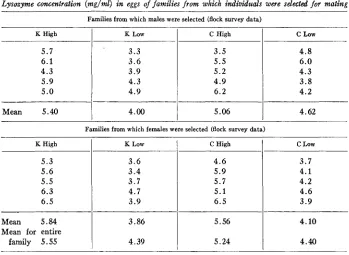
TABLE 2
Lysozyme concentration (mglml) in eggs o j jamilies from which individuals were selected for mating
Families from which males were selected (flock survey data)
c Low
3 . 7 4 . 1 4 . 2 4 . 6 3 . 9
K High
I
K Low 5 . 76 . 1 4 . 3 5 . 9 5 . 0
3 . 3 3 . 6 3 . 9 4 . 3 4 . 9
I
High3 . 5 5 . 5 5 . 2 4 . 9 6 . 2
c Low
4 . 8 6 . 0 4 . 3 3 . 8 4 . 2
Mean 5.40
I
4.001
5.06I
4.62Families from which females were selected (flock survey data) K High
5 . 3 5 . 6 5 . 5 6 . 3 6 . 5
K Low
3 . 6 3 . 4 3 . 7
4.7
3 . 9
Mean 5.84
Mean for entire family 5.55
3.86
4.39
5.56
5.24
4.10
4.40
families were subsequently tested to select extreme individuals to be used in test mat- ings. The average for all females of the lowest family of K strain was much too high; consequently eggs from all females of the next lowest family were analyzed. The av- erage for this family proved to be sufficiently low for use, and it was selected to be used as the low family of the K strain from this point on. Females from the four selected dam-families that were used for breeding had 5.6 and 5.2 mg lysozyme/ml egg white, or more, in the K High and C High families, respectively, and 3.8 and 4.3 mg/ml, or less, in the K Low and C Low families, respectively. Males were selected on the basis of the performance of five full sisters and were from different sire-families than the females to which they were mated. Four males were used in matings, one for each respective family of females. The families selected will henceforth be referred t o as the first generation of the K High, K Low, C High, and C Low lines. Data used as a basis of selection of these lines are summarized in table 2.
The female progeny from these matings (second generation) were checked for lyso- zyme concentration by analysis of an egg laid a t seven months of age. Birds with a lysozyme concentration of 5.8 mg/ml or more were selected in both of the High lines as parents for the third generation, whereas birds with 4.4 and 4.6 mg/ml or less were selected in the K Low and C Low lines, respectively. I t should be noted that the lysozyme concentration in eggs laid a t seven months of age is about 0.5 mg/ml greater than in eggs laid a t ten months of age. Males were selected on the basis of an analysis of blood serum a t eight weeks of age and on the performance of their sisters.
LYSOZYME LEVEL O F EGG W H I T E 267
as much as possible first generation dams as well as full sisters of selected males were used only in line crosses.
All birds within each generation were reared together. They were wing-badged before commencement of laying, and the badge number for a bird was assigned with- out regard to date of hatch, strain, or family. The different lines and crosses were never segregated, except for a special mating of 1 2 third generation K-strain females made during the seventh through ninth months of age.
Phenotype of the progenies
For a comparison of the lysozyme concentration of different lines and generations the data for eggs laid when the birds were between 10 and 12 months of age are con- sidered. Most of the C strain data are not shown because of the great variation within both lines and the small numbers in the third generation. The differences between these lines were always small; the average lysozyme concentrations for the birds of the first, second, and third generations were 6.30, 4.88, and 5.39 mg/ml for the High line and 4.10, 4.39, and 4.49 mg/ml for the Low line.
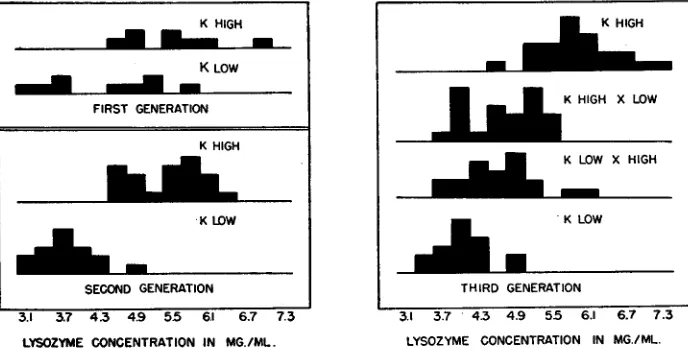
Most of the discussion which follows will be concerned with the K strain. I n this strain the average lysozyme concentrations for the birds of the first, second, and third generations were 5.96, 5.44, and 6.09 mg/ml for the High line and 3.60, 3.78, and 4.08 mg/ml for the Low line. The average for the K High X K Low cross was 4.65 mg/ml and for the K Low X K High cross was 4.73 mg/ml. Neither of these lines changed much in three generations. The slightly higher averages in the third genera- tion may be an effect due to year or season, since birds of all the pure-line matings of both strains showed this increase. The average age a t which the birds of this genera- tion started to lay differed somewhat from that of the second generation, which was probably a consequence of the different dates of hatch (August and April for the second and third generations, respectively). This might have influenced the lysozyme
K LOW
-
FIRST GENERATIONK HIGH
K U I W
SECOND GENERATION
3.1 37 4 3 4.9 55 61 6.7 7.3
LYSOZYME CONCENTRATION IN MG./ML.
K niGn
.
.
-
K HIGH X LOWI
-
'
L
K LOW
I
THIRD GENERATION
3.1 3.7 4.3 4.9 55 6.1 6.7 7.3
LYSOZYME CONCENTRATION IN MG./ML.
268 F. H. WILCOX, JR. AND R. K . COLE
__
TABLE 3
Performance of the High and Low lines in respect to other characteristics
3rd 9 46 196 21 0 2042 56, 76 - 131 -
Characteristic _ _ _
2nd _ _ _ 17 43 177 4 12 - 55 78 8.46 - 0.11: No. of birds whose eggs were analyzed for lysozyme
No. eggs 9 through 11 months of age (5-day trap period)a
Age at first egg (days)a
Mortality to 210 days of age (%)
Body weight at 11 months of age (grams)& Egg weight at 10 months of age (grams). Albumen quality (Haugh units)a
Total solids of egg white (mg/ml)b Total normality of K and Na of egg whitec Mortality from 210 days of age to 12 months of
age (%)
pH of egg whiten
2nd 21 42 181 0 11 - 58 8.38 0.llC 84 - 3rd 23 46 200 14 11 L973 59 95 - 129
-
2nd 3rd 2nd _ _ _ _ _ _
16 17 18 41 39 43
187 227 173 8 10 12 23 8 0
- 1878 -
55 56 56
85 83 72 8.52 - 8.43
- 121 -
0.116, - 0.11;
- 3rd
-
11 48 218 14 0 2280 57 79 128 - - -a Average of birds whose eggs were analyzed for lysozyme a t ten months of age.
Average of four eggs per line.
0 Average of five eggs per line.
concentration a t ten months of age. The other striking change was the decrease in lysozyme concentration in the second generation of the K High line. Histograms of the lysozyme concentration for all three generations of the K strain are presented in figure 1, where these data have been arranged in 0.3 mg/ml groupings.
Data collected to detect any relationship between lysozyme level and other traits are shown in table 3 . There appears to be little relationship between differences in lysozyme concentration and the number of eggs laid in a three month period, mortal- ity, body weight, or total normality of K and Na (which are activators of lysozyme). Differences in age a t production of first egg are probably not related to lysozyme since there was no regression within lines of lysozyme concentration on this characteristic. Eggs from the K High line weighed more than those from the K Low line, a relation- ship which has been observed before (WILCOX 1956). A positive regression of albumen quality on lysozyme concentration has been shown (WILCOX 1955), and is evident in the K strain but not in the C strain. There may be a slight association of lysozyme concentration with total solids as well as with pH of egg white, but there is no further evidence bearing on this.
Genetic considerations
LYSOZYME LEVEL OF EGG WHITE 269
TABLE 4
A comparison of daughters from the same dam which had been mated to a High and a Low line male
Line
K High K Low C High
c
LowDam
5 . 6 6 . 9 3 . 7 3 . 3 6 . 7 6 . 3 4 . 3 3 . 8
Lysozyme concentration in mg/ml
Mean for daughters mated to male of Same line
I
Opposite line5.85 (4) 5.42 (5) 3.52 (6) 3.80 (6) 4.93 ( 7 )
5.10 (3) 4.46 ( 7 )
4.51 ( 7 )
4.34 ( 7 )
4.25 (2) 4.98 ( 5 ) 4.88 (4) 4.78 ( 8 )
4.58 (5) 4.97 ( 7 )
4.47 (3)
( ) Indicates number of daughters on which mean is based.
matings involving the same K Low male to both types of females. Data from crosses of the C High and Low lines showed a similar trend.
An influence of the sire on the lysozyme level of the egg white in eggs laid by his progeny is illustrated in table 4, which shows the performance of progeny of first generation females that had been mated to males of their line to produce the second generation, and then to males of the opposite line to produce crosses in the third generation. It is evident that there is a large influence of the male on the progeny from each female in the K strain, but there is apparently much less of this influence in the C strain. The poor success in breeding for differences in lysozyme level in the C strain may be due either to use of genetically similar males or to an insignificant influence of the sire on the lysozyme level of his daughters’ eggs. The former seems more likely to be true since dams of the C strain tended to produce daughters whose ayerage lysozyme level was closer to the strain average than were their own eggs, a tendency which was very much reduced in the K strain.
Although there were large differences between the mean lysozyme level of the egg white of the K High and Low lines, there was a considerable variation within each line. Certain observations suggested that this variation might be nongenetic in nature. These were the small change in the lysozyme level of the two lines in three genera- tions, suggesting homozygosity, and the similar performance of progenies from dams of the same line with differing phenotypes.
270 F. H. WILCOX, JR. AND R. K . COLE
TABLE 5
Results of mating the same K High line male to females ofthe K High and K Low lines m*th an unusually high or low lysozyme level f o r their line
Line
K High
K Low
Position of dam’s phenotype in histogram
for third generation
Upper End
Mean
Lower End
Mean
Upper End
Mean
Lower End
Mean
Lysozyme concentration in mg/ml Dam
7 . 4 6 . 3 6 . 3 6.67 5 . 3 5 . 2 4 . 7 5.08 4 . 9 4.4 5 . 0
__
4.77 3 . 6 3 . 7 3 . 3 3.53
Mean for daughtersa 5.47 (3) 5.30 (1) 4.90 (1) 5.32 (5) 5.13 (6) 5.25 (2) 5.19 (8) 5.18 (16) 5.00 (4) 5.44 (8) 4.75 (4) 5.16 (16) 4.27 (3) 4.93 (4) 5.10 (1) 4.70 (8)
a Followed by number of daughters on which mean is based.
dams of the two lines that were nearly identical phenotypically produced daughters nearly identical in the lysozyme concentration of their eggs. Matings of a K Low male of the third generation to similar females produced four daughters with an average lysozyme level of 4.08 mg/ml.
A number of gene pairs probably effect the lysozyme level of egg white, as indicated by the presence of genetic differences within two lines which themselves differ in their average lysozyme level. The inheritance is apparently nuclear and autosomal since there was no difference between reciprocal crosses.
Mating results suggest partial dominance of low lysozyme concentration. This rela- tionship may be spurious, since the K Low females started to lay nearly 30 days later than females of the K High line and the reciprocal crosses. This difference in time may have influenced the lysozyme concentration of eggs laid a t ten months of age. Evidence in favor of dominance of low lysozyme concentration versus an additive effect is therefore somewhat tenuous.
DISCUSSION
LYSOZYME LEVEL OF EGG WHITE 271
functioning enzyme is governed by a single pair of alleles. The genetic differences obtained in lysozyme concentration might well be the result of modifying genes af- fecting synthesis or secretion of the enzyme, or the presence of additional genes for lysozyme. I t has been found that these genetic differences are evidently not associated with changes in utilization of vitamin A or tryptophan. Knowledge of what other sub- stances are increased to give a greater weight of total solids in the egg white of High lines might be enlightening.
The significance of the genetic differences in lysozyme concentration of egg white is not fully understood. The only definite associations with other characteristics that have been shown to date are the positive regression of both egg weight and albumen quality on lysozyme concentration. Thus on the basis of present knowledge on the subject, hens with high levels of lysozyme in their egg white have an advantage from the standpoint of artificial selection in respect to these characteristics. One would expect that any selection for high egg weight or albumen quality will favor hens with higher amounts of lysozyme in their eggs, but actually only a minority of the eggs analyzed in the flock survey were high in their lysozyme level. Two possible explana- tions for lack of genetic fixation are heterosis and random distribution. Heterosis could be the underlying factor if there were an advantage of low lysozyme concentra- tion for the expression of some other trait or traits, whereby the heterozygote might be the best compromise from the standpoint of all associated traits. Such an advan- tage of low lysozyme concentration has yet to be demonstrated. Random variation remains a possibility; there has been little selection for albumen quality in the stock studied, but there has been some for egg weight.
This study provides a rather interesting case of genetic variation in concentration of an enzyme. However, one should be cautious in using these reported results to draw inferences concerning other enzymes. Lysozyme is not a typical enzyme in respect to its stability, molecular weight, and isoelectric point, and particularly in respect to its extremely high concentration in egg white.
SUMMARY
Eggs from a large number of families of two different strains of White Leghorns were analyzed for lysozyme. Two families from each strain were selected for high or low lysozyme concentration in their egg white, and exceptional hens from each were mated with males from comparable families. The eggs from their daughters and granddaughters were subsequently analyzed for lysozyme.
In the K strain little change in the lysozyme concentration of the egg white was found following the initial selection in both High and Low lines, whereas in the C strain a substantial regression towards the flock mean resulted. The lysozyme levels of reciprocal crosses were intermediate to those of the parental lines.
It has been concluded that in the K strain both parents exerted a substantial influ- ence on the lysozyme concentration shown by their daughters through action of autosomal genes. The available evidence has suggested a number of gene pairs con- trolling the level of this enzyme in albumen, probably without dominance. In the C strain there was some influence of the dam but very little of the sire.
272 F. H . WILCOX, JR. AND R. K. COLE
weigh more and to possess firmer albumen. The biological significance of the genetic differences in lysozyme concentration and the reason for genetic heterogeneity in the stock studied remains unclear.
ACKNOWLEDGMENT
The Authors are grateful to DR. M. PEECH and MR. H. T. GREWELING of the Agronomy Dept. a t Cornel1 University for assaying egg white for sodium and potas- sium with the Beckman flame photometer.
LITERATURE CITED
COTTERILL, 0. J., and A. R. WINTER, 1954 Egg white lysozyme. 1. Relative lysozyme activity in fresh eggs having low and high interior quality. Poultry Sci. 33: 607611.
FLEMING, ALEXANDER, 1922 On a remarkable bacteriolytic element found in tissues and secretions. Proc. Roy. Soc. London B. 93: 306-317.
FLEMING, ALEXANDER, and V. D. ALLISON, 1924 On the antibacterial activity of egg-white. Lancet 1: 1303-1307.
HARTSELL, S: E., 1949 The newer knowledge of lysozyme and bacteria. Proc. Ind. Acad. Sci. 67: 44-53.
MACDONNELL, L. R., E. D. DUCAY, T. F. SUGIHARA, and R. E. FEENEY, 1954 Proteins of chicken, duck, and turkey egg white. Biochim. et Biophys. Acta 13: 140-141.
SMOLELIS, A. N., and S. E. HARTSELL, 1951 Occurrence of lysozyme in bird egg albumins. Proc.
Soc. Exp. Biol. Med. 76: 455-456.
THOMPSON, R., 1940 Lysozyme and its relation to antibacterial properties of various tissues and secretions. Arch. Path. 30: 1096-1134.
WETTER, L. R.,. M. COHN, and R. F. DEUTSCH, 1953 Immunological studies of egg white proteins. V. The cross-reactions of egg white proteins of various species. J. Immunol. 70: 507-513. WILCOX, F. H., JR., 1955 Evidence for an association between the lysozyme level and the quality
of egg white. Poultry Sci. 34: 1170-1172.
1956 Factors influencing the lysozyme level of hens’ egg white. Poultry Sci. 36: 278-284. WILCOX, F. H., JR., and R. K. COLE, 1954 Studies on the lysozyme concentration in the egg white
of the domestic fowl. Poultry Sci. 33: 392-397.