Abstract
SALAS ARAUJO, CARLOS LUIS. Soy-based Polymers for Surface Modification and Interactions with Lignocellulosic Materials. (Under the direction of Orlando J. Rojas and Lucian Lucia).
Recent environmental concerns about the use of synthetic materials that are often used to maintain our quality of life has triggered a significant amount of research to develop new technologies and to adopt sustainable, bio-based materials. Cellulose, lignin and other plant-derived macromolecules including proteins from soybeans have witnessed recent, renewed interest by the industrial and scientific communities. For example, soybean proteins have been proposed for a variety of applications, including wood adhesives, bio-plastics, composites and functional materials that may include synthetic polymers. Despite its importance in such systems or materials, very little is known about the fundamental nature of the interactions between soy proteins and other polymers. Therefore, this work addresses this issue by a systematic investigation of the interactions between soy proteins with the two most abundant macromolecules in the biosphere, namely, cellulose and lignin and with the most widely used synthetic polymer, polypropylene (PP).
The adsorption of the main soy protein globulins, glycinin (11S) and β-conglycinin (7S), was
and cellulose (by 89%) was observed with the increased ionic strength of the aqueous solution, from 0 to 0.1 M NaCl. This highlights the relevance of electrostatic interactions in the adsorption process. In contrast, the adsorption of β-conglycinin was reduced (by 25 and
57 % on silica and cellulose, respectively). Similarly, the addition of 10 mM of 2-mercaptoethanol (a denaturing agent) reduced the mass adsorbed for both proteins.
The amounts of 11S and 7S adsorbed on lignin and self-assembled 1-dodecanethiol monolayers were higher when the protein was in the native state if compared to that after chemical denaturation (by using urea and 2-mercaptoethanol). Urea-denatured proteins adsorbed more extensively onto the hydrophobic SAM monolayes. The reduction in water contact angle after protein adsorption (40 and 35 for native 11S and 7S, respectively)
suggests strong nonspecific interactions between the protein and the substrates, favoring conformational changes at the interface that contribute to exposure and rearrangement of hydrophobic and hydrophilic amino acid residues.
The adsorption on polypropylene thin films and nonwovens of different grades of soy proteins in their native as well as thermally-denatured states, including purified glycinin and β-conglycinin as well as commercial soy flour and isolate was investigated at 25 C in PBS
Soy-based Polymers for Surface Modification and Interactions with Lignocellulosic Materials
by
Carlos Luis Salas Araujo
A dissertation submitted to the Graduate Faculty of North Carolina State University
in partial fulfillment of the requirements for the degree of
Doctor of Philosophy
Forest Biomaterials
Raleigh, North Carolina 2013
APPROVED BY:
_______________________________ ______________________________ Prof. Orlando J. Rojas Prof. Lucian Lucia
Co-Chair of Advisory Committee Co-Chair of Advisory Committee
________________________________ ________________________________ Prof. Martin A. Hubbe Prof. Michael Dickey
Dedication
I would like to dedicate this dissertation to my loved family, my wife Dairy and my children Luis Alejandro and Carlos Daniel for giving me joy, love, support and for having a lot of patience, you are my motivation, I love you. To my mother Maria Elena, for her endless love, support and encouragement, for teaching me and my siblings good values, honesty and the importance of work hard to accomplish our goals. To my siblings Willian, Johnny, Yenny and Yaneth.
Biography
I was born in Santa Isabel, Trujillo,Venezuela. I moved to Mérida, Venezuela where I attended Universidad de Los Andes (ULA) and received a B.S. in Chemical Engineering in 2000. In 2001 I joined the Department of Chemical Engineering Department of ULA as a lecturer in undergraduate courses. In 2006 I received a M.S. in Chemical Enginering from ULA and joined the Chemical Engineering Department as Assistant Professor. In August 2009 I joined the PhD program at NC State University, Department of Forest Biomaterials, working in the Colloids and Interfaces group under the advising of Drs. Orlando Rojas and Lucian Lucia. During my doctoral studies I was invited to the Advanced Institute of Industrial Science and Technology in Hiroshima, Japan (Summer 2012). During this time I worked with Drs. Takashi Endo and Seung-Hwan Lee as part of a joint collaboration with Dr. Rojas’s group to explore new uses of nanocellulose in plastic materials.[Insert your
Acknowledgments
First I would like to express my sincere appreciation and thanks to Dr. Orlando Rojas for all the support, guidance and encouragement to accomplish my goals during my doctoral studies, also for being a great role model; for all the enthusiasm, passion and effort he puts on the research and discussions, which easily proliferates among the students, this triggered even more my motivation to accomplish my goals. I would also like to thank Dr. Lucia for the encouragement and support, for the research discussions and suggestions provided. To Dr Martin Hubbe for the research discussions and guidance, for his prompt response to research questions comments and suggestions and his contributions to our research papers. I want to thank Dr. Michael Dickey for the instruction and discussions provided, especially during my preliminary examination. Also, Dr. Jan Genzer is thanked for his contributions in drafting our joint research papers and for allowing me access to the facilities in his lab. Also Dr. Kirill Efimenko for the help and assistance in ellipsometry measurements.
My sincere gratitude to Dr. Steve Kelley and Dr. Ilona Peszlen for their support and encouragement. Also to Mrs. Melissa Rabil for the help with paperwork related aspects of the graduate program.
I want to acknowledge and thank the support of Universidad de Los Andes, Venezuela through the program of scholarships for faculty members.
I want to express my gratitude to Drs. Takashi Endo and Seung-Hwan Lee at Advanced Institute of Industrial Science and Technology in Hiroshima, Japan for the research opportunity and support provided, also to Dr. Mariko Ago for the help and support during my stay in Japan.
The United Soybean Board (USB) is acknowledged for the funding provided to pursue this research studies. Drs.Robina Hogan and Connie Howe (OmniTech International, Ltd) and Tom Theyson (Tens Tech) are also acknowledged and thanked for their valuable feedback and research discussions.
I also want to express my gratitude to Drs. Ronalds Gonzalez and Omar Carrero for their friendship and personal collaboration provided since the beginning of my studies at NC State.
Last but not least I want to thank my loved family, my wife Dairy, my sons Luis Alejandro and Carlos Daniel for all their love and patience during this stage of our life, this is our goal. I love you. I want to thank my mother Maria Elena for her endless love, for emphasizing me and my siblings since our early life the importance of study and work hard to achieve our goals. My appreciation and gratitude to my aunt Magaly for the support she gave me from the beginning of my doctoral studies.
Table of Contents
List of Tables ... xii
List of Figures ... xiv
List of Publications and Contributions ... xx
1 Introduction ... 1
1.1 Proteins ... 1
1.2 Intermolecular forces and other factors that affects protein structure ... 2
1.2.1 Hydrogen bonding ... 2
1.2.2 van der Waal Forces... 3
1.2.3 Hydrophobic effect and hydrophobic interactions ... 4
1.3 Soybean proteins ... 4
1.3.1 Industrial uses of soybean proteins ... 7
1.4 Adsorption of proteins at solid surfaces ... 7
1.5 Monitoring of protein mass adsorbed at solid/liquid interfaces ... 11
1.5.1 Quartz crystal microbalance (QCM) ... 11
1.5.2 Surface Plasmon Resonance (SPR) ... 14
1.5.3 Circular dichroism ... 16
1.6 Preparation of model surfaces for adsorption studies ... 18
1.6.2 Spin coating ... 19
1.7 Surface modification: Wetting and contact angle ... 20
1.8 Biopolymers applications to produce nanocomposites: Electrospinning technique 23 1.9 References ... 24
2 Research objectives ... 31
3 Adsorption of Glycinin and -Conglycinin on Silica and Cellulose: Surface Interactions as a Function of Denaturation, pH, and Electrolytes ... 33
3.1 Abstract ... 33
3.2 Introduction ... 34
3.3 Materials and Methods ... 37
3.3.1 Soybean globulins: fractionation, purification and characterization. ... 37
3.3.2 Circular Dichroism... 39
3.3.3 Adsorption by QCM. ... 39
3.4 Results and Discussion ... 41
3.4.1 Fractionation and characterization of soybean proteins. ... 41
3.4.2 Dynamics of protein adsorption. ... 43
3.4.3 Adsorption isotherms and effect of ionic strength. ... 45
3.4.4 Effect of pH and denaturation on soy protein adsorption. ... 53
3.5 Conclusions ... 60
3.6 Acknowledgements. ... 61
3.7 Supporting Information document. ... 61
3.7.1 Kinetics of adsorption. ... 61
3.8 References ... 68
4 On the surface interactions of proteins with lignin ... 73
4.1 Abstract ... 73
4.2 Introduction ... 74
4.3 Materials And Methods ... 77
4.3.1 Lignin films. ... 78
4.3.2 Reference self-assembled monolayers of dodecanethiol. ... 78
4.3.3 AFM imaging. ... 79
4.3.4 Quartz crystal microgravimetry. ... 79
4.3.5 Surface Plasmon Resonance. ... 80
4.3.6 Water Contact Angle... 81
4.4 Results And Discussion ... 82
4.4.1 Soy proteins adsorption onto lignin films. ... 82
4.4.2 Change in surface wettability after adsorption. ... 95
4.6 Acknowledgements ... 98
4.7 Supporting Information Document ... 98
4.7.1 Protein content of 11S and 7S ... 98
4.7.3 Johannsmann model for calculation of adsorbed mass ... 101
4.8 References ... 102
5. Water-wettable Polypropylene Fibers by Facile Surface Treatment Based on Soy Proteins ... 106
5.1 Abstract ... 106
5.2 Introduction ... 107
5.3 Materials and Methods ... 110
5.3.1 Preparation of thin PP films. ... 110
5.3.2 Quartz crystal microgravimetry (QCM). ... 110
5.3.3 Surface Plasmon Resonance. ... 111
5.3.4 Adsorption on PP nonwoven surfaces. ... 112
5.3.5 Water Contact Angle... 112
5.3.6 FITC labeling of soy proteins and fluorescence imaging. ... 113
5.4 Results and discussion ... 113
5.4.1 Adsorption of soy proteins on flat PP thin films. ... 113
5.4.3 Water contact angle... 122
5.4.4 Wicking test. ... 126
5.4.5 Fluorescence analysis... 128
5.5 Conclusions ... 129
5.6 Acknowledgments ... 130
5.7. Supporting Information Document ... 130
5.8 References ... 132
6 Synthesis of Soy Protein-Lignin Nanofibers ... 136
6.1 Abstract ... 136
6.2 Introduction ... 136
6.3 Materials and Methods ... 139
6.3.1 Solutions for nanofiber preparation ... 140
6.3.2 Electrospun Nanofibers and Characterization ... 141
6.4 Results and Discussion ... 143
6.4.1 Rheological behavior of electrospinning solutions ... 143
6.4.2 Nanofiber production and morphology ... 144
6.4.3 Thermal properties of soy protein-lignin fibers ... 148
6.4.4 FTIR analysis ... 151
6.5 Conclusions ... 156
6.6 References ... 156
List of Tables
Table 1.1. Amino acid composition of soybean proteins.10 ... 5
Table 3.1. Binding constant kobs (in min-1) for soy globulins adsorbed onto silica surfaces from aqueous solutions of different ionic strengths (see Supporting Information document for details). ... 45 Table 3.2. Maximum experimental adsorbed massmax of glycinin and -conglycinin at
various pH and ionic strength conditions studied. The theoretical values are provided in the last two rows for side-on (side on) and end-on (end on) protein
adsorption. ... 51
Table 3-S1. Values of apparent constants for adsorption of glycinin onto silica surface at pH 7 after fitting to Eq. (M). ... 64 Table 3-S2. Values of apparent binding constants for adsorption of conglycinin onto silica
surface at pH 7. ... 64
Table 3-S3. Values of apparent binding constants for adsorption of glycinin onto cellulose surface at pH 7. ... 65
Table 3-S4. Values of apparent binding constants for adsorption of conglycinin onto cellulose surface at pH 7. ... 65
Table 3-S5. Values of apparent binding constants for adsorption of glycinin onto cellulose surface at pH 3. ... 66
Table 3-S6. Apparent binding constants and Langmuir constant for adsorption of soy globulins onto silica surface at pH 7. ... 67
Table 3-S8. Values of apparent binding constants and Langmuir constant for adsorption of soy glycinin onto cellulose surface at pH 3. ... 68
Table 4.1. Amount of soybean proteins adsorbed onto lignin films under different aqueous conditions. The values are determined after adsorption from 1 mg/ml protein solution concentration. ... 88
Table 4.2. Amount of coupled water upon adsorption on lignin of proteins from 1 mg/ml aqueous solution concentration. ... 90
Table 4. 3. Comparison of soybean protein adsorption onto lignin and cellulose model upon adsorption from 1 mg/ml aqueous solutions (isotherm plateau). ... 91
Table 4.4. Amount of coupled water upon adsorption of soybean proteins from 1 mg/ml solutions onto hydrophobic SAM. ... 94
Table 5.1. Coupled water mass of adsorbed soy protein layers after exposing PP thin films to 1 mg/ml protein solutions. ... 116
Table 5.2. Comparison of adsorbed mass on polypropylene surfaces (with and without DODA treatment) from 1 mg/ml solution of denatured protein. ... 121
Table 5.3. Water contact angle results for adsorption of denatured proteins onto polypropylene thin films after treatment with DODA surfactant. ... 122
Table 6.1. Component ratio , surface tension and conductivity of aqueous polymer solutions used as precursors of electrospun fibers. The proteins consisted of glycinin (G) and isolate (I). ... 141
Table 6.2. Diameter of electrospun fibers produced from precursor solutions containing soy protein (P) (glycinin and isolate) and lignin (L). ... 145
List of Figures
Figure 1.1. Simple schematic illustration of the kinetic process involved in protein adsorption. ks, ka, kd, kc represent the rate constants for irreversible adsorption,
adsorption, desorption, and spreading (reconformation), respectively. If proteins adsorb following ks pathway, the process is irreversible. If adsorption follows ka
and kd pathways the adsorption is assumed slightly reversible but changes in
conformation (kc pathway) will turn it irreversible. Concentration at the interface
is indicated by “ci”. Adapted from Ramsden.57 ... 11
Figure 1.2. Top: Illustration of the gold-coated quartz crystals used in QCM experiments. Bottom left: Change in oscillation frequency as a function of time when mass is adsorbed on the surface. Bottom right: Change in frequency as a function of time as the adsorption proceeds. ... 14
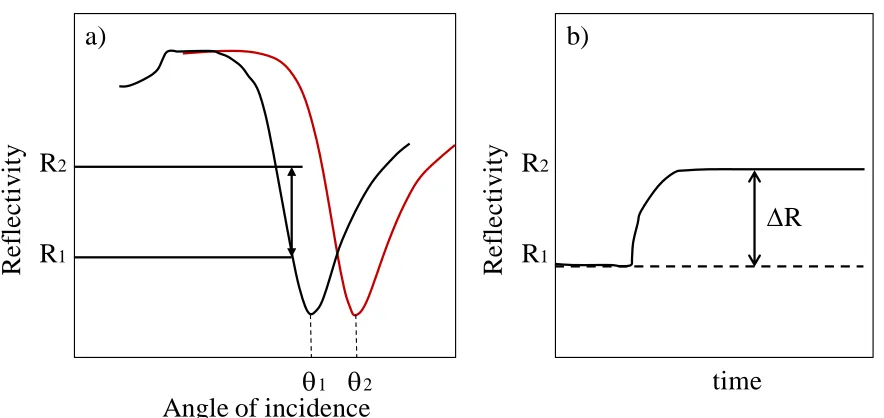
Figure 1.3. SPR curves after adsorption from solution. a) Shift in angle (from 1 to 2) upon adsorption from solution as monitored in angular scan mode. b) Shift in intensity after adsorption from solution when SPR is operated at a fixed angle (suitable for studies of adsorption kinetics). Adapted from Sinner et al.65 ... 15
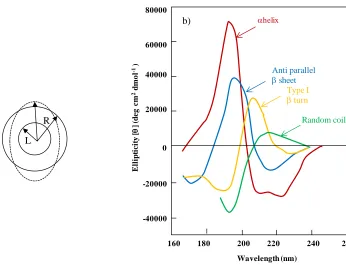
Figure 1.4. a) Illustration of the two components of polarized light (L and R) showing the elliptical polarization. b) Circular dichroism signal of different structures in protein. Values of the ellipticity at 208 nm and 222 nm are usually used as a rough indication of the helix content of the protein. Adapted from Johnson 67 and Sinner 65. ... 17
Figure 1.5. Illustration of the contact angle at three phase junction point. ... 20
Figure 1.6. Illustration of the Wenzel regime (a) and the Cassie-Baxter regime (b) ... 22
Figure 3.1. Solubility of soy protein globulins at 25 C. No background electrolyte was added to the dispersions. % of soluble proteinwas determined as protein in the supernatant/ protein in the starting solution. Concentration of protein in starting solution was 10 mg/ml. ... 42
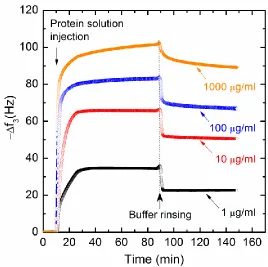
Figure 3.2.QCM shift of frequency (3rd overtone) as a function of time upon injection of soy glycinin (11S) solution on a silica surface after 10 minutes stabilization in phosphate buffer (pH 7 and 25 °C). Protein solutions with same background electrolyte were used at the indicated concentrations. Rinsing with phosphate buffer at pH 7 was performed after 83 minutes. ... 44
Figure 3.3. Adsorption isotherms for glycinin (a) and β-conglycinin (b) adsorbed on silica and cellulose at various equilibrium solution concentrations at pH 7 and 25 °C. The open and closed symbols indicate adsorption on silica and cellulosic surfaces, respectively. The concentrations of background electrolyte are indicated (0 and 100 mM NaCl). The mass was calculated from plateau data obtained after rinsing with buffer and the values reported represent averages of at least three measurements (see error bar for experimental deviation). Circular Dichroism measurements for glycinin (c) and β conglycinin (d) at different ionic strength studied. ... 47
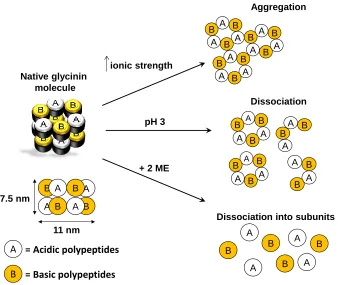
Figure 3.4. Schematic representation of soy glycinin changes under different physicochemical environments as discussed by Badley et al.5and Martin et al.45
... 49
Figure 3.6. Adsorption isotherms from aqueous solutions of glycinin (a) and -conglycinin (b) at pH 7 onto silica and cellulose surfaces after reduction with 2-mercapto-ethanol.Open symbols correspond to silica and filled symbols to cellulose substrates. All experiments were carried out at pH 7 and 25 C. Circular dichroism measurements for glycinin (c) and β conglycinin (d) showing the ellipticity signal after reduction with 2-ME. ... 56
Figure 3.7. D-f curves for glycinin in the absence (a) and in the presence of 0.1 M NaCl (b). The curves for β-conglycinin are also included in (c) and (d) (with or without 0.1 M NaCl, respectively). Note the different scale used in (a), from 0 to 10 units of energy dissipation, which indicates that a high viscoelastic glycinin layer is adsorbed in absence of background electrolytes. ... 58
Figure 3.8. Schematic illustration of the glycinin adsorbed molecules on negatively charged substrate. ... 60 Figure 4.1. (a) Schematic representation of the structure of soybean glycinin 11S (a) and β-conglycinin, 7S (c) (See Refs 2, 24, 25 for related information. A schematic illustration of the distribution of hydrophobic residues in soybean glycinin and β-conglycinin is also included in (b) (see also Ref. 26) ... 78
Figure 4.2. Shift in QCM frequency upon adsorption of 11S (left) and 7S (right) on lignin. 83
Figure 4.3. Adsorption isotherms of soybean proteins 11S (left) and 7 S (right) onto lignin films as determined by QCM-D. Error bars represent standard deviation of three repetitions. ... 84
Figure 4.5. Dissipation frequency plots for adsorption of soybean proteins 11S (left) and 7S (right) onto lignin model films from 1 mg/ml solutions. ... 87
Figure 4.6. AFM Images of lignin substrates of a) bare lignin film (0.47 nm roughness), b) after adsorption from 1 mg/ml solution of 11S (0.87 nm roughness) and c) after adsorption from 1 mg/ml solution of 7S (1.50 nm roughness). The dimension of each image is 1 x 1 µm2. ... 89
Figure 4.7. Adsorption isotherms for soybean proteins 11S and 7S onto lignin model films as determined from SPR results. Error bars represent standard deviation of three repetitions. ... 90
Figure 4.8. SPR adsorption isotherms of soybean proteins 11S and 7S onto SAM hydrophobic surface. Error bars represent standard deviation of three repetitions. ... 93
Figure 4.9. Changes in dissipation upon adsorption of soybean proteins 11S (left) and 7S (right) onto SAM hydrophobic surfaces from 1 mg/ml aqueous solutions. ... 95
Figure 4.10. Water contact angle change upon adsorption of soybean proteins (11S and 7S) at different concentrations on lignin model films (a) and on 1-dodecanethiol self-assembled monolayers before and after denaturation (2-ME or urea) (b). Error bar represent standard deviation of three repetitions. ... 96
Figure 4-S2. Non contact mode AFM height (1x1 µm2) images of polystyrene support (left) and lignin films (right). ... 100
Figure 4- S3. Water contact angle images of polystyrene (left) and lignin film (right) ... 100
Figure 4-S4. Water contact angle images of lignin film before (left) and after (right) 11S adsorption. ... 101
Figure 4-S6. Plot to determine true mass mo. ... 102
Figure 5.1. Adsorption of soy proteins on flat PP thin films determined by the frequency shift as a function of time upon injection of 1 mg/ml protein solutions in QCM experiments (a) and changes in optical intensity (arbitrary units) signal from SPR experiments, also after adsorption form 1 mg/ml protein solution (b). The obtained adsorbed mass isotherms for soy proteins on flat PP thin films are also indicated from QCM (c) and SPR (d) techniques. ... 114
Figure 5.2. Adsorption isotherms for native and denatured soy proteins obtained from QCM experiments with 11S (a), 7S (b), isolate (c), flour (d). ... 117
Figure 5.3. Dynamics of DODA surfactant adsorption on polypropylene thin films measured in QCM experiments (from 1 mg/ml DODA solutions in isopropanol) (a). The adsorption isotherms for the different soy proteins (1 mg/ml) on DODA-treated PP surfaces are also shown (b). ... 119 Figure 5.4. D-f profiles for adsorption of soy proteins on polypropylene without (a) and
with (b) treatment with DODA surfactant. ... 121
Figure 5.5. Time-resolved evolution of the water contact angle upon adsorption of native proteins on the surface of DODA-treated polypropylene nonwovens. Inset corresponds to the initial 50 s after water drop deposition. ... 124
Figure 5.6. Time-resolved evolution of the water contact angle upon adsorption of denatured proteins on the surface of polypropylene nonwovens. Inset shows initial 10 seconds of the experiments. ... 126
Figure 5.8. Fluorescence microscopy images for DODA-treated nonwoven substrates after adsorption of soybean proteins in native or thermally-denatured conditions. All images are shown at the same exposure of 1/50 s. Objective 4X/0.10. Scale bar corresponds to 500 m size. ... 129
Figure 6.1. Rheological behavior of electrospinning solutions obtained by using continuous flow procedure at 25 C, parallel plate geometry (40 mm steel plate). 1000 µm gap. G and I correspond to glycinin and SPI respectively. ... 144
Figure 6.2. FE-SEM images of soy protein/lignin nanofibers. Scale bar shows 5 µm. Top row: glycinin-lignin nanofibers, bottom row: SPI-lignin nanofibers. Note the increase in fiber’s diameter with increase in lignin content (from left to right). 145
Figure 6.3. SEM cross section images of films after cryo-fracture. G and I samples (see Table 6.1) are included for different protein:lignin ratios. The respective composite images include low magnification (50 m scale bar, left), medium (5 m scale bar, center) and high (1 µm scale bar, right). The top row of each image at medium and low magnification shows the upper side of the film (air-liquid interface) whereas the bottom shows the side of the film in contact with teflon petri dish. ... 147
Figure 6.4. DSC curves for nanofibers produced from and glycinin (a) and isolate (b). Note the presence of two transition peaks at 95C and 120C for samples of pure glycinin and soy Isolate ... 150
Figure 6.5. FTIR spectra of PEO, SPI, G, lignin and electrospun fiber mats of soy protein-lignin. The region between 1800-600 cm-1 is zoomed at the right. ... 152
List of Publications and Contributions
This dissertation is a summary of the following publications and each represents one chapter: Paper I: Carlos Salas, Orlando J. Rojas, Lucian Lucia, Martin A. Hubbe, Jan Genzer,
Adsorption of Glycinin and β-Conglycinin on Silica and Cellulose: Surface
Interactions as a Function of Denaturation, pH, and Electrolytes.
Biomacromolecules2012, 13, 387-396.
Paper II: Carlos Salas, Orlando J. Rojas, Lucian Lucia, Martin A. Hubbe, Jan Genzer, On the Surface Interactions of Proteins with Lignin. ACS Appied Materials & Interfaces2012, 5, 199-206.
Paper III: Carlos Salas, Jan Genzer, Lucian Lucia, Martin A. Hubbe, Orlando J. Rojas, Water-wettable polypropylene fibers by facile surface treatment based on soy proteins.Submitted to ACS Appied Materials & Interfaces2013.
Paper IV: Carlos Salas, Mariko Ago, Jan Genzer, Lucian Lucia, Martin A. Hubbe, Orlando J. Rojas, (In Preparation) Synthesis of Soy Protein-Lignin Nanofibers. Publications not included in this dissertation:
1. Liu, X., He, F., Salas, C., Pasquinelli, M., Genzer, J., Rojas, O. J., Experimental and Computational Study of the Effect of Alcohols on the Solution and Adsorption Properties of a Nonionic Symmetric Triblock Copolymer. Journal
of Physical Chemistry B2012, 116,4, 1289-1298.
1
Introduction
1.1 Proteins
Plant proteins are composed of amino acids with varying composition but typically they include about 20 amino acids the sequence of which is specified by the genetic pathways in plant biosynthesis. The amino acids are differentiated by the structure and chemistry of their side groups, which in turn affect the properties of polypeptides and
proteins as determined by OH, COO-, NH3+, SH groups.1 Due to the different hydrophobicity of the respective side group, proteins can be classified as amphiphilic macromolecules.2 The structure of the proteins also depends upon the properties of the amide linkages between the amino acid groups.
The primary structure of proteins is given by the sequence of amino acids in the protein; this sequence can be thought as a chain formed by polymerization of the amino acids where each of them forms a residue. The conformation of polypeptides chains is described by torsion angles around the -carbon of an amino acid, indicated as phi () and psi (). Since
these two angles vary depending on each amino acid residue in the protein, the number of possible conformations of the molecules is very high. The secondary structure of proteins refers to an arrangement of polypeptides stabilized by hydrogen bonds. It consists in the first place of the sheets that are formed by fully extended chains of polypeptides linked by
hydrogen bonds. The helix constitutes the second major structural element of proteins; it involves a number of amino acids and 18 residues every five turns of the helix (3.6 amino
amino acid residues in the polypeptide chain. Independent tertiary structures can combine to form the quaternary structure, which refers to an association of multiple polypeptide chains
(protein subunits). For instance helices (right handed alpha helix) can coil around each
other forming a super-helix also known as coiled structure. The sheets can also form
turns.1
1.2 Intermolecular forces and other factors that affects protein structure
The interactions that define protein structure and their behavior include van der Waals and electrostatic interactions as well as hydrogen bonding and hydrophobic effects. The electrostatic interactions are long-range interactions that occur among particles or surfaces carrying different charges (leading to attractive forces) or similar charges (leading to repulsive forces). Electrostatic forces are the strongest of all physical forces.3
In aqueous solution, the charged amino acids in the proteins locate at the surface of the protein in contact with the surrounding environment.4 The solution pH at which the charges in the molecule are balanced is called isoelectric pH or isoelectric point. At the isoelectric point the electrostatic interactions favor a more compact structure, above or below the isoelectric pH the protein structure a less compact structure is expected, however the electrostatic interactions will depend upon the distribution of charged residues in the outer surface of the protein and the presence of electrolytes in solution. 5
1.2.1 Hydrogen bonding
by the uneven distribution of charges in the molecule is a consequence of strong hydrogen bonding.3, 6 Amino acids in proteins form hydrogen bonds with one another and with surrounding water molecules, that is why it plays a prominent role in the folding of proteins and also in the hydration layer surrounding the molecules when dissolved in water. 1 The strength of most hydrogen bonds is of about 10 to 40 kJ/mol ( 4kT to 16kT respectively). 1, 3
1.2.2 van der Waal Forces
van der Waal forces include those originating between permanent dipoles (also known as Keesom interactions); between induced dipoles (London or dispersion interactions) and interactions involving permanent and induced dipoles (Debye interactions). London forces play an important role in the stability of colloidal systems as well as in the stability of the structure of proteins. In general van der Waal forces are attractive but London dispersion forces can be also repulsive.3, 6
potentials between the atoms and interacting bodies), or through the more precise Lifshitz theory that considers the interacting bodies as a continuous media, the interactions arising from the interference between the electromagnetic fields of each body. 7
1.2.3 Hydrophobic effect and hydrophobic interactions
The hydrophobic effect originates when non-polar molecules that are incapable of forming hydrogen bonds interact with water. Because of the strong internal cohesion in water structure due to the presence of hydrogen bonds, the water molecules tend to rearrange themselves around non-polar substances in such a way to minimize the overall energy of the system. This leads to high order structuring of the water molecules surrounding the non-polar solute, an effect that has been shown to be entropy-driven.1 When hydrophobic molecules are in an aqueous environment they prefer to interact with each other rather than with water, this associations are known as the hydrophobic effect, and it is the main cause of spontaneous association of amphiphilic molecules in solution,8 also responsible for the folding of globular proteins in solution.3, 4
1.3 Soybean proteins
Table 1.1. Amino acid composition of soybean proteins.10
Aminoacid Glycinin (11S) -Conglycinin
Triptophan 1.5 0.3
Lysine 5.7 7.0
Histidine 2.6 1.7
Arginine 8.9 8.8
Asparagine 13.9 14.1
Threonine 4.1 2.8
Serine 6.5 6.8
Glutamic acid 25.1 20.5
Proline 6.9 4.3
Glycine 5.0 2.9
Alanine 4.0 3.7
Cysteine 1.7 0.3
Valine 4.9 5.1
Methionine 1.3 0.3
Isoleucine 4.9 6.4
Leucine 8.1 10.3
Tyrosine 4.5 3.6
Phenylalanine 5.5 7.4
Extensive research have been carried out in the fractionation, purification and characterization of soybean storage proteins.11-22 Recently some procedures for fractionation and purification of these globulins on a pilot plant scale have been proposed.17, 18
Physicochemical properties of soybean globulins have been studied and reported,10, 13, 23-38
7S globulins exists as a monomer at pH 7.6 and 0.5 ionic strength with a molecular weight of 180-210 kDa. At lower ionic strength (0.1 M) the protein has a sedimentation constant of about 9S and a higher molecular weight of 370 kDa, which has been reported to
be a dimer.24, 26 The 7S protein is composed of three subunits (Mw 57-760 kDa), ’(Mw
weight of 320 to 350 kDa23 and its quaternary structure is formed by 12 subunits arranged in a dimer of six units each. Three of these subunits are acidic (denoted as A1, A2,A3) with reported molecular weight of 34.8 to 40 kDa and the remaining three are basic (denoted B1,B2,B3) with molecular weight of 19.6 to 20 kDa.25 The acidic subunits contains only leucine, isoleucine and phenylalanine as N-terminals and the basic ones contain glycine.25 The content of glutamic acid, half cysteine and proline aminoacids is higher in the acidic subunits compared to the basic ones. It has been reported that 11S contains eight glycine, two phenylalanine and two leucine amino terminal residues per mole.23, 25 The isoelectric point of soy globulin 7S is of 4.924 whilst that for 11S is of 4.64.23 The reported isoelectric point of the acidic subunits is between 4.7 to 5.4 and between 8 to 8.5 for the basic subunits. Both of these proteins can form disulfide linkages; however glycinin have a larger amount of half cysteine per mole of protein (48 mol/mol23) compared to 7S globulins (4 mol/mol of protein24). The presence of disulfide linkages has an important role on the physical properties of soybeans, but particularly their solubility. 11S protein forms reversible association polymers at pH 7.5 when ionic strength (NaCl) decreases from 0.5 to 0.1M.
Soybean proteins polypeptides are tightly folded with some un-structured regions. Both 7S and 11S proteins show a high content of random coil structure and a low content of
ordered structure.7S protein contain a 5% helix, 35 % β structure and 60 % random coil.
11S proteins show a secondary structure with 5.2 % helix, 34.8 % β structure and 60 %
1.3.1 Industrial uses of soybean proteins
Some of the industrial uses of soy proteins include the manufacture of plastics, adhesives, binders in paper, paint coatings and composites.40 Applications of soy proteins on uses other than foods require a good knowledge of their physicochemical and thermal properties.
Soy protein products commercially available include soy flours, concentrate and isolates with protein content of 56, 65 and 90 wt%, respectively. Due to their high protein content and their thermal behavior, soy protein isolates have been used for the manufacture of adhesives and films.41 Optimum film formation from soy protein isolates was possible by changes in pH.42, 43 Plastic molding from soy isolate and soy concentrate have been studied since as early as the 1930s.40, 44-46 Since then, several blends of soy proteins with synthetic polymers have been tested and reported, also with current special attention on cellulose-reinforced composites. Recently cellulose nanocrystals were used to reinforce soy protein isolate plastics.47, 48 Paper coatings and surface treatments are among the largest industrial applications of soy proteins40.
1.4 Adsorption of proteins at solid surfaces
For a better understanding of the behavior of proteins at interfaces it is necessary to consider the role of protein structure and protein stability upon adsorption and the factors that regulate such stability49 including hydrophobic interactions, double layer and van der Waals interactions as well as hydrogen bonding.5 Proteins that display large conformational changes upon adsorption are considered as soft whereas those displaying very limited conformational changes are referred as hard proteins.5, 49, 50
Different techniques have been used to evaluate the adsorption of proteins on solid surfaces, including but not limited to:49, 51
Depletion methods. Ellipsometry.
Fourier transform Infrared (FTIR) spectroscopy.
Enzyme-linked immune-sorbent assay (ELISA). Total internal reflection fluorescence (TIRF).
Atomic force microscopy (AFM).
Neutron reflection.
Optical waveguide light-mode spectroscopy (OWLS) Circular Dichroism
Quartz crystal microbalance (QCM).
Surface Plasmon Resonance (SPR).
process and the state and conformation of the protein molecules on the surface. Also, it important to consider the effect of variables such as solvency, pH, temperature and ionic strength. The properties of the solid surface are obviously important in the adsorption process, namely surface energy (hydrophilicity, hydrophobicity), morphology (homogeneous/heterogeneous), surface charge density, topography of the surface (roughness), etc.51, 52
In this work the techniques used to monitor protein adsorption were mainly quartz crystal microbalance, surface plasmon resonance and circular dichroism. Atomic Force microscopy, contact angle and ellipsometry were also used as complementary techniques.
The reversibility of protein adsorption has been the subject of intensive research. The high affinity of proteins toward solid surfaces usually leads to very low desorption rates after dilution of the system. Although the debate still remains, at least within experimental time scales used during reported studies, the desorption process is much slower than the adsorption one.5, 50, 53 Norde et al.54 pointed out the convenience of distinguishing between irreversibility depending upon different effects: dilution of the solution, pH changes, the presence of low molecular weight substances (surfactants, electrolytes), and exchange or displacement of the adsorbed protein by other proteins dissolved in solution.
The thermodynamics of the adsorption process indicates that adsorption occurs only if the change in Gibbs energy (defined according to equation 1.1) at constant pressure and temperature of the system is negative:2, 4, 5
where G, H, S, T refer to the Gibbs free energy, enthalpy, entropy and temperature respectively.
Although some attempts have been made to obtain meaningful values for
based on fittings of the adsorption isotherm to the Langmuir model, the results
have been a point of controversy because of the irreversibility of the adsorption process. It is well known that one of the assumptions of the Langmuir model is the reversibility of the adsorption process. If this condition is not met, as in the case of proteins, an equilibrium constant to define the adsorption on solid surfaces, even if the experimental results fit a mathematical model, has no physical meaning. Therefore, related parameters should be read carefully.5 Calorimetry has been the technique of preference to evaluate the change of
enthalpy during adsorption ( ). The values obtained after evaluation of the
properties of the proteins and the sorbent surface. Some models have been proposed to illustrate the kinetics of the adsorption process; a simple model is illustrated in Figure 1.1.
Figure 1.1. Simple schematic illustration of the kinetic process involved in protein adsorption. ks, ka, kd, kc represent the rate constants for irreversible adsorption, adsorption,
desorption, and spreading (reconformation), respectively. If proteins adsorb following ks
pathway, the process is irreversible. If adsorption follows ka and kd pathways the adsorption
is assumed slightly reversible but changes in conformation (kc pathway) will turn it
irreversible. Concentration at the interface is indicated by “ci”. Adapted from Ramsden.57
1.5 Monitoring of protein mass adsorbed at solid/liquid interfaces
As mentioned in the foregoing discussion, there are different experimental techniques to assess the adsorption of proteins on solid surfaces. A brief description of the techniques used in this work, namely quartz crystal microbalance, surface plasmon resonance and circular dichroism, is provided in the next sections.
1.5.1 Quartz crystal microbalance (QCM)
The quartz crystal microbalance is based on the response of piezoelectric quartz crystal to the application of an external electrical potential. Typically the crystal is a thin quartz disk with electrodes plated on its back. In the QCM an oscillating electric field applied to the crystal induce the propagation of a wave (an acoustic wave) through the crystal in the
Solution
Concentration: co
Transport to the surface
ka kd
ks
ci
direction perpendicular to the crystal’s surface. The crystal must have a specific orientation respect to the crystallographic axes, typically for QCM studies the quartz crystals have an AT-cut of 3515’, this cut is preferred because is less sensitive to temperature changes
around ambient temperature. The particular behavior of the AT orientation shows that when an electric field is applied it develops a shear wave along the thickness direction, leading to lateral motion of the surface.58 By including the crystal into an oscillation circuit a resonant oscillator is reached when the mechanical and electric oscillations are near the fundamental frequency of the crystal. This fundamental frequency depends on the thickness, chemical composition, mass and shape of the crystal whereas the oscillation frequency depends on the properties (density and viscosity) of the medium adjacent to the crystal and properties of the crystal itself, such as density and shear modulus of the quartz.59 The frequency range for the fundamental mode of quartz is between 5 and 20 MHz and commercial QCM devices typically operate in the 5–10 MHz range.58
The change in oscillating frequency is related to the mass adsorbed by the Sauerbrey equation 60 (equation 1.2)
(1.2)
where m refers to the change of mass adsorbed, f refers to the shift in frequency upon
adsorbed but also on the viscosity and density of the liquid. The energy dissipation D is related to the frequency f and the decay time τ by equation 1.3.:
(1.3)
Figure 1.2. Top: Illustration of the gold-coated quartz crystals used in QCM experiments. Bottom left: Change in oscillation frequency as a function of time when mass is adsorbed on the surface. Bottom right: Change in frequency as a function of time as the adsorption proceeds.
1.5.2 Surface Plasmon Resonance (SPR)
The sensitivity of the SPR technique to detect small changes in refractive index (~10 -6
) within time resolution of the order of milliseconds63 have proved useful in biosensing applications.64, 65 Surface plasmon resonance occurs in the visible spectra at the surface of free-electron metals such as gold or silver, when the thickness of the metal film is a small fraction of the incident’s light wavelength.64 The excitation of the surface plasmons occurs at a given angle, the surface plasmon resonance (SPR) angle. In this condition a sharp dip in the reflected light intensity occurs. An evanescent electric field that decays exponentially with the distance from the surface with a decay length of 0.2 to 0.3 the wavelength of the light is formed; this field interacts strongly with the surface of the metal. Even small changes
Gold
in the refractive index at the metal-surrounding medium interface will influence the SPR angle. 63, 64 In general adsorbed layers produce a shift in the SPR angle, which can be modeled through mathematical algorithms to produce an optical thickness of the coating that can be further used to calculate the thickness of the layer, provided that the refractive index of the layer is known.65 SPR instruments can run in either continuous or batch mode and also in angular scan (angle shift as a function of wavelength) or at fixed angles where the reflectivity is monitored at a given angle of incidence (see figure 1.3).
Figure 1.3. SPR curves after adsorption from solution. a) Shift in angle (from 1 to 2) upon adsorption from solution as monitored in angular scan mode. b) Shift in intensity after adsorption from solution when SPR is operated at a fixed angle (suitable for studies of adsorption kinetics). Adapted from Sinner et al.65
1
2R
2R
1Re
fl
e
c
ti
vi
ty
The response (change in reflectivity) of the sensor to adsorbed mass (SPR signal) is expressed in resonance units or angle shift (Δθ).63 The thickness of the adsorbed protein layer can be determined by using equation 1.4.63
(1.4)
where d is the thickness of adsorbed layer, ld is a characteristic evanescent electromagnetic
field decay usually estimated to be around 0.37 times the wavelength of the incident light (240 nm), m is a sensitivity factor for the sensor obtained by calculating the slope of a Δθ calibration curve for a series of solutions of different concentrations and known refractive indices.63 o is the refractive index of the bulk solution and a is the refractive index of the
adsorbed species (protein). The surface excess concentration can be determined by using equation 1.5.
(1.5)
where is the bulk density of the adsorbed species.
1.5.3 Circular dichroism
Circular dichroism (CD) is a technique that allows the determination of the secondary structure of the proteins in solution ( helices and sheets) and inspection of the tertiary
and R), however the results are reported as ellipticity (), defined as where b is the
minor axis and a is the major axis of the resulting ellipse (see figure 1.4)
The CD signal is observed in optically active chromophores (chiral). The CD of proteins is due to the peptide bond (absorption below 240 nm), disulphide bonds (around 260 nm) and aromatic residues (adsorption between 260 to 320 nm). 66The amide chromophore starts absorbing light in the far UV region, displaying the first band at 220 nm.67 Values of
the ellipticity at 208 nm and 222 nm are usually used as a rough indication of the helix content of the protein.
Figure 1.4. a) Illustration of the two components of polarized light (L and R) showing the elliptical polarization. b) Circular dichroism signal of different structures in protein. Values of the ellipticity at 208 nm and 222 nm are usually used as a rough indication of the helix content of the protein. Adapted from Johnson 67 and Sinner 65.
0 20000 40000 60000 80000 -20000 -40000
160 180 200 220 240 260
1.6 Preparation of model surfaces for adsorption studies
Preparation of homogeneous and reproducible substrates is very important for adsorption studies. Functionalized surfaces and thin solid films of polymeric materials can be used as model substrates to study the interactions, for example polymers in solution, polyelectrolytes, surfactants, nanoparticles, proteins, etc. The techniques used to produce such model surfaces include:
Self-assembling.
Langmuir-Blodgett deposition. Spin coating.
Dip Coating.
Spray Coating.
Chemical Vapor deposition. Atomic layer deposition.
Thermal evaporation.
Sputtering.
Self assembled monolayers and spin coating will be described briefly as they were the main techniques used in this work.
1.6.1 Self assembled monolayers (SAM)
Long-chain alkanethiols adsorb on gold from solution or vapor phase, the sulfur atoms coordinate to the gold atoms (111) on the surface to form a defined pattern of molecules on the surface with a well defined tilting from the normal to the surface (30).68
Good control of
the SAM can be achieved by using mixtures of different thiols (mixed SAMs). Some advantages of the thiol SAM include their stability toward exposure to air or ethanol and resistance to contamination for long storage time. On the other hand SAMs from alkylsilanes (alkyltrichlorosilane or akyltriethoxysilane) form when these compounds are exposed to hydroxylate surfaces that react via hydroxyl groups. These SAMs are more thermally stable than alkylthiol SAM, however their drawback is that the amount of functional groups to attach to the surface is limited compared to alkylthiol SAMs.68, 69
1.6.2 Spin coating
The spin coating technique is used to apply a uniform thin solid film onto a flat solid support. In most cases the coating material is a polymer solution from which the solvent is evaporated. 70 In a typical process, an excess of solution is applied to the substrate, then the substrate is spun at high speeds where the centrifugal force pushes the fluid outward, in the radial direction, forming a thin layer of solution from which the solvent slowly evaporates.70 The final thickness of the film depends on variables such as polymer concentration in the initial solution, viscosity and surface tension of the solution, spinning speed and polymer diffusion coefficient.
have been the technique of preference to produce lignocellulosic model surfaces. For instance the preparation of model films of cellulose has been discussed in recent reviews. 71-73
Details about different lignin film preparation has also been reported.74.75, 76
1.7 Surface modification: Wetting and contact angle
As part of this dissertation is devoted to the study of surface modifications of hydrophobic nonwoven substrates it is convenient to understand the basic principles behind wetting of solid surfaces.
Wettability is a critical property in everyday life as well as in many industrial processes as it dictates the ability of a solid surface to interact with the surrounding medium. The wettability is intimately related to the topology and composition of the surface. The contact angle measures the wettability of a surface by a given fluid. The contact angle is closely related to the surface tension of a liquid and is a key property in phenomena such as detergency and coating. The contact angle forms in the junction of the three phases, solid , liquid and gas when a droplet of liquid comes into contact with a solid surface, as shown in figure 1.5
Figure 1.5. Illustration of the contact angle at three phase junction point.
SV
LVThere are three forces that are balanced under equilibrium: surface tension of the liquid (LV),
the surface tension of the solid (SV) and the interfacial tension at the solid-liquid interface
(SL). The equilibrium forces balance in the horizontal direction, as described by equation
1.6, also known as Young equation.6, 77, 78
(1.6)
which can be rearranged to yield
The main drawback of equation 1.7 is that it assumes an atomically smooth and chemically homogeneous surface, a condition difficult to achieve for real solid surfaces because they are rough and chemically heterogeneous at the nanoscale. This factors have been accounted for separately by Wenzel79 and Cassie and Baxter80 in what are called the Wenzel and Cassie-Baxter regimes.
In the Wenzel regime, the apparent ( measured) contact angle and the true contact angle
are related by:
(1.7)
Where r is the roughness factor, defined as the ratio of the surface in contact with the liquid to the projection of this surface on the horizontal plane.78 The Wenzel regime applies to rough, chemically homogenous surfaces. Accordingly, the Wenzel equation predicts an
increase in either hydrophilicity (for hydrophilic surfaces, <90) or hydrophobicity (>90) with increase in surface roughness.7978, 81, 82
(1.8)
Where fs is the fraction of the surface in contact with the liquid and (1- fs) is the fraction of
the surface in contact with air.80 Both regimes are illustrated in figure 1.6.
Figure 1.6. Illustration of the Wenzel regime (a) and the Cassie-Baxter regime (b)
In reality both Wenzel and Cassie-Baxter regimes can be found as a combination in what is called a mixed-wetting regime. 78, 81, 82
Real surfaces exhibit an advancing A and receding R contact angle as shown in figure 1.7,
the true contact angle will lie between the two (R<<A). The difference between the
advancing and receding contact angle is known as the contact angle hysteresis, a consequence of heterogeneities of the surface and the irreversibility of the wetting-dewetting cycle.78, 81
Figure 1.7. Illustration of advancing (A) and receding (R) contact angle.
a) b)
1.8 Biopolymers applications to produce nanocomposites: Electrospinning technique
As mentioned before in section 1.3.1, there are different reported industrial uses for soybean proteins, including composite materials prepared by mixing soy proteins with different biopolymers such as cellulose. Chapter 6 of the dissertation includes the preparation of soy proteins and lignin nanofibers by electrospinning, therefore this section provides a brief description of electro spinning technique to produce nanofibers.
The use of natural polymers alone or in combination with synthetic polymers to produce nanofibers by electrospinning have gained a lot of attention, some of the polymers studied include cellulose acetate, collagen, hyaluronic acid, chitosan, polylactic acid (PLA), silk 89, 90 and soybean 91-93 proteins and lignin.93-95 One of the main challenges of using biopolymers is the variability of the properties and purity of the materials which depends on the source and previous purification processes, however the benefits of their use and final properties of electrospun mats overcome this issue.89
1.9 References
1. Metzler, D. E., Biochemistry : The Chemical Reactions of Living Cells. Second ed.; Harcourt/Academic Press: San Diego, CA, 2001; Vol. 1, p 39-95.
2. Norde, W., Clinical Materials 1992, 11, 85-91.
3. Israelachvili, J. N., Intermolecular and Surface Forces. Academic Press: San Diego, CA., 1992.
4. Norde, W., Adv. Colloid Interface Sci. 1986, 25, 267-340.
5. Norde, W., In Biopolymers at Interfaces, Second ed.; Malmsten, M., Ed. Marcel Dekker, Inc.: New York, NY, 2003; pp 21-43.
6. Hiemenz, P. C.; Rajagopalan, R., Principles of Colloid and Surface Chemistry. Marcel Dekker: 1997.
7. Claesson, P. M.; Kjellin, M.; Rojas, O. J.; Stubenrauch, C., PCCP 2006, 8, 5501-5514.
8. Tanford, C., Science 1978, 200, 1012-1018.
10. García, M. C.; Torre, M.; Marina, M. L.; Laborda, F., Crit. Rev. Food Sci. Nutr. 1997,
37, 361 - 391.
11. Wolf, W. J.; Briggs, D. R., Arch. Biochem. Biophys. 1956, 63, 40-49.
12. Koshiyama, I., Agr. Biol. Chem. 1965, 29, 885-887.
13. Thanh, V. H.; Kazuo, S., J. Agric. Food. Chem. 1976, 24, 1117-1121.
14. Thanh, V. H.; Kazuo, S., J. Agric. Food. Chem. 1979, 27, 805-809.
15. Nagano, T.; Hirotsuka, M.; Mori, H.; Kohyama, K.; Nishinari, K., J. Agric. Food.
Chem. 1992, 40, 941-944.
16. Nagano, T.; Fukuda, Y.; Akasaka, T., J. Agric. Food. Chem. 1996, 44, 3484-3488.
17. Wu, S.; Murphy, P.; Johnson, L.; Fratzke, A.; Reuber, M., J. Am. Oil Chem. Soc. 1999, 76, 285-293.
18. Wu, S.; Murphy, P. A.; Johnson, L. A.; Reuber, M. A.; Fratzke, A. R., J. Agric. Food.
Chem. 2000, 48, 2702-2708.
19. Deak, N. A.; Murphy, P. A.; Johnson, L. A., J. Food Sci. 2006, 71, C247-C254.
20. Deak, N. A.; Murphy, P. A.; Johnson, L. A., J. Food Sci. 2006, 71, C413-C424.
21. Deak, N. A.; Murphy, P. A.; Johnson, L. A., J. Food Sci. 2006, 71, C200-C208.
22. Delwiche, S.; Pordesimo, L.; Panthee, D.; Pantalone, V., J. Am. Oil Chem. Soc. 2007,
84, 1107-1115.
23. Peng, I. C., Quass, D.W., Dayton,W.R., Allen,C.E., Cereal Chem. 1984, 61, 480-490.
24. Koshiyama, I., Cereal Chem. 1968, 45, 394-404.
25. Badley, R. A.; Atkinson, D.; Hauser, H.; Oldani, D.; Green, J. P.; Stubbs, J. M.,
26. Wolf, W. J., J. Agric. Food. Chem. 1970, 18, 969-976.
27. Wolf, W., J. Am. Oil Chem. Soc. 1977, 54, A112-A117.
28. Lakemond, C. M. M.; de Jongh, H. H. J.; Hessing, M.; Gruppen, H.; Voragen, A. G. J., J. Agric. Food. Chem. 2000, 48, 1985-1990.
29. Catsimpoolas, N.; Meyer, E. W., Arch. Biochem. Biophys. 1968, 125, 742-750.
30. Ruíz-Henestrosa, V. P.; Sánchez, C. C.; Escobar, M. d. M. Y.; Jiménez, J. J. P.; Rodríguez, F. M.; Patino, J. M. R., Colloids and Surf., A 2007, 309, 202-215.
31. Kinsella, J., J. Am. Oil Chem. Soc. 1979, 56, 242-258.
32. Riblett, A. L.; Herald, T. J.; Schmidt, K. A.; Tilley, K. A., J. Agric. Food. Chem. 2001, 49, 4983-4989.
33. Maruyama, N.; Mohamed Salleh, M. R.; Takahashi, K.; Yagasaki, K.; Goto, H.; Hontani, N.; Nakagawa, S.; Utsumi, S., J. Agric. Food. Chem. 2002, 50, 4323-4326.
34. Ortiz, S. E. M.; Sánchez, C. C.; Rodríguez Niño, M. R.; Añon, M. C.; Rodríguez Patino, J. M., Colloids Surf., B 2003, 32, 57-67.
35. Rodríguez Patino, J. M.; Molina Ortiz, S. E.; Carrera Sánchez, C.; Rodríguez Niño, M. R.; Añón, M. C., J. Colloid Interface Sci. 2003, 268, 50-57.
36. Rodriguez Patino, J. M.; Molina Ortiz, S. E.; Sanchez, C. C.; Rodriguez Nino, M. R.; Anon, M. C., Ind. Eng. Chem. Res. 2003, 42, 5011-5017.
37. Kim, K. S.; Kim, S.; Yang, H. J.; Kwon, D. Y., Int. J. Food Sci. Technol. 2004, 39, 385-393.
38. Rodriguez Patino, J. M.; Carrera Sanchez, C.; Molina Ortiz, S. E.; Rodriguez Nino, M. R.; Anon, M. C., Ind. Eng. Chem. Res. 2004, 43, 1681-1689.
40. Schmitz, J. F.; Erhan, S. Z.; Sharma, B. K.; A.Johnson, L.; Myers, D. J., In Soybeans: Chemistry, Production Processing, and Utilization, Johnson, L. A.; White, P. J.; Galloway, R., Eds. AOCS PRESS: Urbana, IL, 2008; pp 539-612.
41. Swain, S. N.; Biswal, S. M.; Nanda, P. K.; Nayak, P., J. Polym. Environ. 2004, 12, 35-42.
42. Wu, L. C.; Bates, R. P., J. Food Sci. 1972, 37, 36-39.
43. Wu, L. C.; Bates, R. P., J. Food Sci. 1972, 37, 40-44.
44. Brother, G. H.; McKinney, L. L., Ind. Eng. Chem. 1939, 31, 84-87.
45. Brother, G. H.; McKinney, L. L.; Suttle, W. C., Ind. Eng. Chem. 1940, 32, 1648-1651.
46. Brother, G. H.; McKinney, L. L., Ind. Eng. Chem. 1940, 32, 1002-1006.
47. Wang, Y.; Cao, X.; Zhang, L., Macromol. Biosci. 2006, 6, 524-531.
48. Paetau, I.; Chen, C. Z.; Jane, J., J. Polym. Environ. 1994, 2, 211-217.
49. Nakanishi, K.; Sakiyama, T.; Imamura, K., J. Biosci. Bioeng. 2001, 91, 233-244.
50. Norde, W.; Anusiem, A. C. I., Colloids Surf. 1992, 66, 73-80.
51. Rabe, M.; Verdes, D.; Seeger, S., Adv. Colloid Interface Sci. 2011, 162, 87-106.
52. Andrade, J. D.; Hlady, V.; Wei, A. P.; Ho, C. H.; Lea, A. S.; Jeon, S. I.; Lin, Y. S.; Stroup, E., Clinical Materials 1992, 11, 67-84.
53. Macritchie, F., J. Colloid Interface Sci. 1972, 38, 484-488.
54. Norde, W.; MacRitchie, F.; Nowicka, G.; Lyklema, J., J. Colloid Interface Sci. 1986,
112, 447-456.
56. Lundström, I., In Surfactants, Adsorption, Surface Spectroscopy and Disperse Systems, Lindman, B.; Olofsson, G.; Stenius, P., Eds. Springer Berlin / Heidelberg:
1985; Vol. 70, pp 76-82.
57. Ramsden, J. J., Chem. Soc. Rev. 1995, 24, 73-78.
58. Casero, E.; Vazquez, L.; Parra-Alfambra, A. M.; Lorenzo, E., Analyst 2010, 135, 1878-1903.
59. O’Sullivan, C. K.; Guilbault, G. G., Biosens. Bioelectron. 1999, 14, 663-670.
60. Sauerbrey, G., Z. Phys. A 1959, 155, 206-222.
61. Rodahl, M.; Kasemo, B., Sens. Actuators, A 1996, 54, 448-456.
62. Rodahl, M.; Kasemo, B., Sens. Actuators, B 1996, 37, 111-116.
63. Jung, L. S.; Campbell, C. T.; Chinowsky, T. M.; Mar, M. N.; Yee, S. S., Langmuir 1998, 14, 5636-5648.
64. Liedberg, B.; Nylander, C.; Lundström, I., Biosens. Bioelectron. 1995, 10, i-ix.
65. Sinner, E. K.; Kobayashi, K.; Lehmann, T.; Neumann, T.; Yu, F.; Knoll, W., In
Biopolymers at Interfaces, Second ed.; Malmsten, M., Ed. Marcel Dekker, Inc.: New
York, NY, 2003.
66. Kelly, S. M.; Jess, T. J.; Price, N. C., Biochim. Biophys. Acta, Proteins Proteomics 2005, 1751, 119-139.
67. Johnson, W. C., Proteins: Struct., Funct., Bioinf. 1990, 7, 205-214.
68. Mrksich, M.; Whitesides, G. M., Annu. Rev. Biophys. Biomol. Struct. 1996, 25, 55-78.
69. Ulman, A., Chem. Rev. 1996, 96, 1533-1554.
70. Lawrence, C. J.; Zhou, W., J. Non-Newtonian Fluid Mech. 1991, 39, 137-187.
72. Maren, R., In Model Cellulosic Surfaces, American Chemical Society: 2009; Vol. 1019, pp 3-53.
73. Eero, K.; Monika, Ö., In Model Cellulosic Surfaces, American Chemical Society:
2009; Vol. 1019, pp 57-74.
74. Norgren, M.; Notley, S. M.; Majtnerova, A.; Gellerstedt, G., Langmuir 2006, 22, 1209-1214.
75. Tammelin, T.; Osterberg, M.; Johansson, L.-S.; Laine, J., Nord. Pulp. Pap. Res. J. 2006, 21, 444-450.
76. Hoeger, I. C.; Filpponen, I.; Martin-Sampedro, R.; Johansson, L.-S.; Österberg, M.; Laine, J.; Kelley, S.; Rojas, O. J., Biomacromolecules 2012, 13, 3228-3240.
77. Starov, V. M.; Velarde, M. G.; Radke, C. J., Wetting and spreading dynamics. CRC:
2007; Vol. 138.
78. Genzer, J.; Efimenko, K., Biofouling 2006, 22, 339-360.
79. Wenzel, R. N., Ind. Eng. Chem. 1936, 28, 988-994.
80. Cassie, A. B. D.; Baxter, S., Transactions of the Faraday Society 1944, 40, 546-551.
81. Nosonovsky, M.; Bhushan, B., Current Opinion in Colloid & Interface Science 2009,
14, 270-280.
82. Bormashenko, E.; Grynyov, R., Colloids Surf., B 2012, 92, 367-371.
83. Doshi, J.; Reneker, D. H., Journal of Electrostatics 1995, 35, 151-160.
84. Huang, Z.-M.; Zhang, Y. Z.; Kotaki, M.; Ramakrishna, S., Compos. Sci. Technol. 2003, 63, 2223-2253.
85. Subbiah, T.; Bhat, G. S.; Tock, R. W.; Parameswaran, S.; Ramkumar, S. S., J. Appl. Polym. Sci. 2005, 96, 557-569.
87. Burger, C.; Hsiao, B. S.; Chu, B., Annual Review of Materials Research 2006, 36, 333-368.
88. Greiner, A.; Wendorff, J. H., Angew. Chem. Int. Ed. 2007, 46, 5670-5703.
89. Schiffman, J. D.; Schauer, C. L., Polymer Reviews 2008, 48, 317-352.
90. Bhardwaj, N.; Kundu, S. C., Biotechnol. Adv. 2010, 28, 325-347.
91. Vega-Lugo, A.-C.; Lim, L.-T., Journal of Biobased Materials and Bioenergy 2008, 2, 223-230.
92. Xu, X.; Jiang, L.; Zhou, Z.; Wu, X.; Wang, Y., ACS Appl. Mater. Interfaces 2012, 4, 4331-4337.
93. Dallmeyer, I.; Ko, F.; Kadla, J. F., J. Wood Chem. Technol. 2010, 30, 315-329.
94. Ago, M.; Jakes, J. E.; Johansson, L.-S.; Park, S.; Rojas, O. J., ACS Appl. Mater. Interfaces 2012, 4, 6849-6856.
95. Ago, M.; Okajima, K.; Jakes, J. E.; Park, S.; Rojas, O. J., Biomacromolecules 2012,
2
Research objectives
The main objective of this work is to study the interactions of soybean proteins in solution with different substrates, from lignocellulosics (cellulose and lignin) model surfaces to hydrophobic synthetic polymers surfaces. The fact that proteins are amphiphilic molecules that have both hydrophilic and hydrophobic aminoacids and also amphoteric makes them suitable for applications in surface modification upon adsorption on solid substrates. To address these objectives, a set of parallel experiments was undertaken, employing complementary surface-sensitive methods. First, quartz crystal microbalance with dissipation was used to study the adsorption of soy globulins glycinin (11S) and -conglycinin (7S) onto
fractionated soy glycinin and β-conglycinin to increase the hydrophilicity and wettability of
the hydrophobic substrates was studied by assessing the adsorption onto thin films of polypropylene by using quartz crystal microbalance and surface plasmon resonance. Afterwards the proteins were adsorbed onto polypropylene nonwoven substrates. The main goal of this study is to obtain highly wettable surfaces by low-cost deposition of soybean proteins (see Chapter 5).
In the last chapter of this dissertation, the preparation and properties of electrospun nanofibers produced from soy protein and lignin is reported. The results indicate a synergistic interactions between lignin and soy proteins, as also demonstrated in chapter 4. The purpose of this work is to take advantage of these favorable interactions to produce new materials from low cost renewable sources.
3
Adsorption of Glycinin and
-Conglycinin on Silica and Cellulose:
Surface Interactions as a Function of Denaturation, pH, and Electrolytes
3.1 Abstract
Soybean proteins have found uses in different non-food applications due to their interesting properties. We report on the kinetics and extent of adsorption on silica and cellulose surfaces of glycinin and β-conglycinin, the main proteins present in soy. Quartz
crystal microgravimetry experiments indicate that soy protein adsorption is strongly affected by changes in the physicochemical environment. The affinity of glycinin and the mass adsorbed on silica and cellulose increases (by ca. 13 and 89 %, respectively) with solution ionic strength (as it increases from 0 to 100 mM NaCl) due to screening of electrostatic interactions. In contrast, β-conglycinin adsorbs on the same substrates to a lower extent and