ABSTRACT
CLARK, ALEXANDER RICH. Application of Neutron Multiplicity Counting Experiments to Optimal Cross Section Adjustments. (Under the direction of John Mattingly.)
This dissertation presents the first application of model calibration to neutron multiplicity counting (NMC) experiments for cross section optimization that utilizes adjoint-based sensitivity analysis (SA)
and first-order uncertainty quantification (UQ). We summarize previous work on SA applied to NMC
and describe notable additions. We give the procedure for first-order UQ and Bayesian-inference-based parameter estimation (PE). We then discuss model calibration applied to NMC of a 4.5-kg sphere
of weapons-grade, alpha-phase plutonium metal with a neutron multiplicity counter. For bare and
polyethylene-reflected configurations of the plutonium sphere, we discuss the sensitivity of the first- and second-moment detector responses (i.e. first and second moments of the NMC distribution, respectively)
to the cross sections. We describe the sources of uncertainty in the measured and simulated responses.
Specifically, uncertainty in the measured responses is due to both random and systematic sources of uncertainty. Uncertainty in the simulated responses is due to cross section covariances. We describe in
detail the adjustment to the cross sections and cross section covariances due to the optimization. Due to
the contribution of systematic uncertainties to the measured response uncertainties, the adjustment to the cross sections is similar in trend but larger in magnitude compared to that recommended by previous
work. We compare the measured responses to responses simulated with nominal and optimized cross
sections, demonstrating that the best-estimate cross sections produce simulations of NMC experiments that are more accurate with reduced uncertainty. We verify that the response variance due to the cross
sections computed with sampling-based uncertainty quantification (UQ) is well-approximated by that
© Copyright 2019 by Alexander Rich Clark
Application of Neutron Multiplicity Counting Experiments to Optimal Cross Section Adjustments
by
Alexander Rich Clark
A dissertation submitted to the Graduate Faculty of North Carolina State University
in partial fulfillment of the requirements for the Degree of
Doctor of Philosophy
Nuclear Engineering
Raleigh, North Carolina
2019
APPROVED BY:
Dmitry Anistratov Jeffrey A. Favorite
Ralph Smith John Mattingly
DEDICATION
This work is dedicated to all of my family, friends, colleagues, and especially my wife. My mother and grandparents recognized my interest in both the sciences and music from an early age and did their
best to foster my curiosity and creativity. Many hours were spent discussing books, answering a myriad
of questions, listening to my favorite musical works, and attending various musical performances. My friends and colleagues from all walks of life encouraged me to always ask questions and to do my best.
BIOGRAPHY
Alexander Rich Clark was born in Idaho Falls, Idaho in 1988. He grew up and spent most of his life in Southeastern Idaho, where he met the love of his life in 2012 (and married her soon after). He received a
Bachelor of Science degree in Nuclear Engineering with a minor in Music from Idaho State University in
May 2014. He began a PhD program at North Carolina State University in August 2014 with Dr. John Mattingly. He received a Consortium for Nonproliferation Enabling Capabilities (CNEC) fellowship
in August 2016. He interned at Los Alamos National Laboratory (LANL) with the Nuclear Engineering Nonproliferation Advanced Nuclear Technology (NEN-2) group during Summer 2016 and was mentored
by Mark Nelson. He returned to LANL for a year-round internship with the X-Computational Physics
ACKNOWLEDGEMENTS
I would like to thank my advisor and several of my teachers, mentors, and colleagues from North Carolina State University and Los Alamos National Laboratory for their advice and direction throughout
my PhD. In particular, I would like to thank John Mattingly for providing meaningful direction and
always encouraging me to think creatively and approach problems with curiosity. I would also like to thank Jeffrey Favorite, Denise Neudecker, Mark Nelson, Jesson Hutchinson, Ralph Smith, Dimitry
TABLE OF CONTENTS
LIST OF TABLES . . . vi
LIST OF FIGURES. . . vii
Chapter 1 INTRODUCTION . . . 1
1.1 Prior work . . . 3
1.1.1 Characteristics of neutron multiplicity counting . . . 3
1.1.2 Models of neutron multiplicity counting distribution moments . . . 5
1.1.3 Identification of over-calibration in the Pu-239ν . . . 5
1.2 Novel contributions . . . 6
1.3 Outline of this dissertation . . . 7
Chapter 2 Sensitivity analysis and uncertainty quantification applied to neutron multiplic-ity counting . . . 9
2.1 Model calibration process . . . 9
2.2 Calculation of detector response moments . . . 10
2.3 Sensitivity analysis of the detector response moments . . . 14
2.4 Multigroup approximation and Legendre polynomial expansion applied to detector response moments and their sensitivity to the cross sections . . . 15
2.5 Propagation of uncertainty through the detector response moments . . . 25
Chapter 3 Model calibration applied to neutron multiplicity counting moments. . . 28
3.1 Parameter estimation applied to neutron multiplicity counting experiments . . . 28
3.1.1 Origin of the Kalman filter . . . 29
3.1.2 Justification for the extended Kalman filter . . . 31
3.1.3 Extended Kalman filter applied to optimal adjustment of the cross sections . . . . 34
3.2 Model calibration applied to neutron multiplicity counting of the BeRP ball . . . 36
Chapter 4 Effect of systematic measurement uncertainties on optimal cross section adjust-ment . . . 53
Chapter 5 Direct sampling verification of first-order uncertainty quantification . . . 59
Chapter 6 Conclusions and future work . . . 73
BIBLIOGRAPHY . . . 75
APPENDICES . . . 80
Appendix A Propagation of uncertainty in the second factorial moment of the induced fission neutron multiplicity distribution . . . 81
LIST OF TABLES
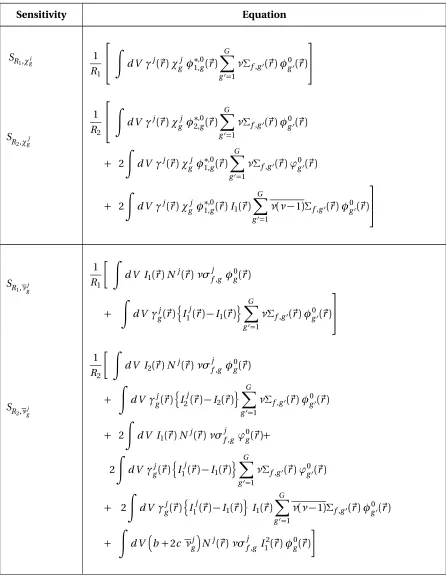
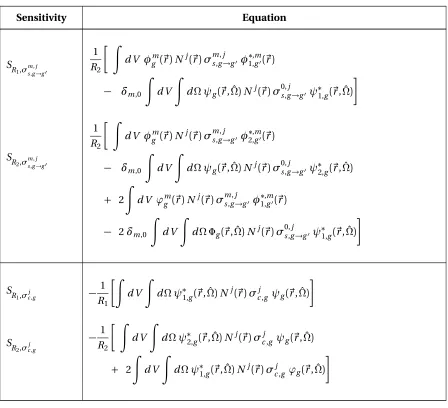
Table 2.1 Relative sensitivity of detector response momentsR1andR2to the set of cross
sectionsχgj,νgj,ν(ν−1) j g,σ
j f,g,σ
m,j s,g0→g,σ
j
c,g. . . 22 Table 2.1 (Cont.) Relative sensitivity of detector response momentsR1andR2to the set of
cross sectionsχgj,νgj,ν(ν−1) j g,σ
j f,g,σ
m,j s,g0→g,σ
j
c,g. . . 23 Table 2.1 (Cont.) Relative sensitivity of detector response momentsR1andR2to the set of
cross sectionsχgj,νgj,ν(ν−1) j g,σ
j f,g,σ
m,j s,g0→g,σ
j
c,g. . . 24
Table 3.1 Atom density of nuclides present in the assembly model. . . 38 Table 3.2 PARTISN transport solve parameters. . . 39
Table 5.1 PARTISN transport solve parameters for low-order simulations used to perform both first-order and sampling-based UQ. . . 60 Table 5.2 One-group spontaneous fission source termQand nPod neutron multiplicity
counter adjoint source termQ1∗utilized in the low-order assembly model. . . 61 Table 5.3 Atom density of nuclides present in the low-order assembly model. . . 61 Table 5.4 Comparison between the nominal cross sections and the mean of the sampled
cross section distributions. . . 64 Table 5.5 Comparison between the nominal cross section variances and the variance of
the sampled cross section distributions. . . 64
Table C.1 Summary of the measurement parametersp considered, the response sensitiv-ities ∂∂Rpq,q =1, 2 to the measurement parameters, figure and table references [37]from which the response sensitivities were estimated, the measurement pa-rameter uncertainties stdev(p)reported in the ICSBEP benchmark[47], and the response variance var(Rq),q=1, 2 due to each measurement parameter for the bare BeRP ball. . . 88 Table C.2 Summary of the measurement parametersp considered, the response
LIST OF FIGURES
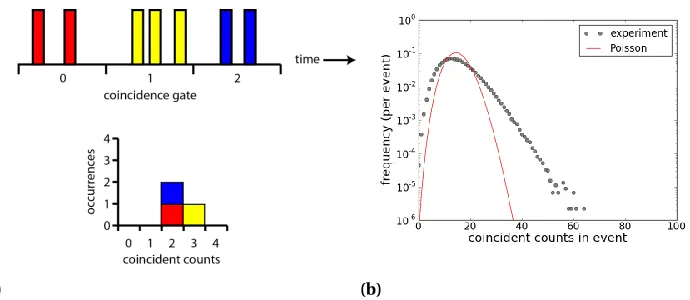
Figure 1.1 The nPod neutron multiplicity counter atop a carbon steel cart. . . 3 Figure 1.2 a) A detector pulse train is segmented into sequential, equal-width coincidence
gates and the frequency of coincident multiplet neutron counts is accumulated to obtain the NMC distribution. b) An NMC distribution accumulated with a coincidence gate widthT of 1024µs by counting a highly-multiplying sphere of weapons-grade plutonium metal reflected by polyethylene and a Poisson distribution with the same mean. The width of the NMC distribution inexcessof the Poisson distribution is characteristic of multiplying material. . . 4
Figure 2.1 Flowchart of the model calibration process. Detector response moment sensi-tivities to the cross sections and detector response moment covariances due to cross section covariances are used to inform cross section optimization via model calibration. . . 10 Figure 2.2 Fits of a quadratic model in energy to Zucker and Holden data for the U-235,
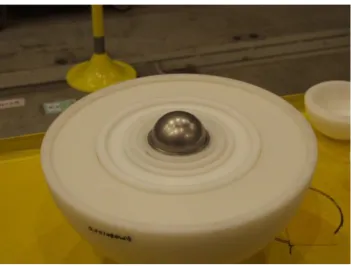
U-238, and Pu-239ν(ν−1). . . 16 Figure 3.1 The BeRP ball nested in polyethylene reflectors. . . 37 Figure 3.2 44-group Pu-240 spontaneous fission source integrated over the BeRP ball volume. 38 Figure 3.3 44-group intrinsic efficiency of the nPod neutron multiplicity counter. . . 38 Figure 3.4 Correlations between the measured responses with respect to the measurement
parameters. . . 40 Figure 3.5 Correlations between the responses simulated with the nominal cross sections. 40 Figure 3.6 Sensitivity ofR1andR2to the Pu-239νfor the bare and reflected BeRP ball
configuration. . . 43 Figure 3.7 Sensitivity ofR2to the Pu-239ν(ν−1)for the bare and reflected BeRP ball
config-uration. Note thatR1is not a function ofν(ν−1)and therefore has no sensitivity to this fission parameter. . . 43 Figure 3.8 Sensitivity ofR2to the Pu-239σf for the bare and reflected BeRP ball configuration. 44
Figure 3.9 Sensitivity ofR2to the Pu-239χfor the bare and reflected BeRP ball configuration. 44 Figure 3.10 Plot of the Pu-239χ. The majority of neutrons born from fission will have
emer-gent energies∼1 MeV. . . 45 Figure 3.11 Relative sensitivity totals ofR1andR2for the bare and reflected BeRP ball
con-figurations. . . 46 Figure 3.12 Correlation between the Pu-239 group fission parameters (χg,νg,ν(ν−1)g, and
σf,g) before (3.12a) and after (3.12b) the optimization. The dotted lines delineate individual fission parameter correlation matrices with dimensionG×G. The correlations are in transport order from left to right and from top to bottom. . . . 47 Figure 3.13 Adjustment to the Pu-239νin multiples of its nominal standard deviation. The
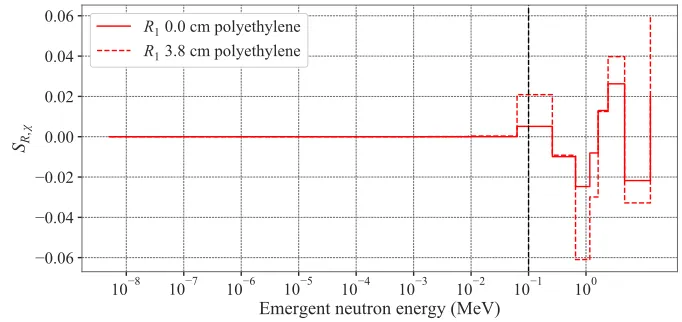
Figure 3.15 Adjustment to the Pu-239σf in multiples of its nominal standard deviation. The label “NMC; stat. & sys. unc.” refers to the adjustment made toσf by applying a EKF to NMC experiments, accounting for both random and systematic sources of uncertainty. The label “Gross neutron counting; stat. unc. only” refers to the adjustment toσf by applying Cacuci’s data assimilation process[5]to gross neutron counting experiments, accounting for random uncertainty only. . . 50 Figure 3.16 Adjustment to the Pu-239χin multiples of its nominal standard deviation. The
label “NMC; stat. & sys. unc.” refers to the adjustment made toχby applying a EKF to NMC experiments, accounting for both random and systematic sources of uncertainty. The label “Gross neutron counting; stat. unc. only” refers to the adjustment toχby applying Cacuci’s data assimilation process[5]to gross neutron counting experiments, accounting for random uncertainty only. . . 50 Figure 3.17 Measured and simulatedR1andR2for the bare and reflected BeRP ball
configu-rations. . . 51 Figure 3.18 Correlations between the responses simulated with best-estimate cross sections. 52
Figure 4.1 The SNAP gross neutron counter with its front polyethylene cover removed[12]. 54 Figure 4.2 27-group intrinsic efficiency of the SNAP gross neutron counter. . . 54 Figure 4.3 Sensitivity ofR1to the Pu-239νfor the bare and reflected BeRP ball configuration. 55 Figure 4.4 Sensitivity ofR1to the Pu-239σf for the bare and reflected BeRP ball configuration. 55 Figure 4.5 Sensitivity ofR1to the Pu-239χfor the bare and reflected BeRP ball configuration. 55
Figure 4.6 Relative sensitivity totals ofR1for the bare and reflected BeRP ball configurations. 56 Figure 4.7 Comparison between adjustments to the Pu-239νin multiples of its nominal
standard deviation. The legend “stat. unc. only” indicates that the optimal cross section adjustments applied to gross neutron counting experiments account for random uncertainty only. The legend “stat. & sys. unc.” indicates that the opti-mal cross section adjustments applied to gross neutron counting experiments accounting for random and systematic uncertainties. . . 57 Figure 4.8 Comparison between adjustments to the Pu-239σf in multiples of its nominal
standard deviation. The legend “stat. unc. only” indicates that the optimal cross section adjustments applied to gross neutron counting experiments account for random uncertainty only. The legend “stat. & sys. unc.” indicates that the opti-mal cross section adjustments applied to gross neutron counting experiments accounting for random and systematic uncertainties. . . 57 Figure 4.9 Comparison between adjustments to the Pu-239χin multiples of its nominal
standard deviation. The legend “stat. unc. only” indicates that the optimal cross section adjustments applied to gross neutron counting experiments account for random uncertainty only. The legend “stat. & sys. unc.” indicates that the opti-mal cross section adjustments applied to gross neutron counting experiments accounting for random and systematic uncertainties. . . 58 Figure 4.10 Comparison between SNAP detector measured and mean count rates adjusted in
the Denovo 3D and PARTISN 1D cases. “stat. unc. only” in each legend indicates that the optimal cross section adjustments applied to gross neutron counting experiments account for random uncertainty only. . . 58
Figure 5.1 Relative sensitivity totals ofR1andR2for low-order simulations of the bare and
Figure 5.2 Nominal cross section correlations for the Pu-239 cross sections used both to compute a first-order estimate of the nominal response variance and to sample the Pu-239 cross sections from a multivariate Gaussian distribution. . . 62 Figure 5.3 Correlation between the cross sections sampled from the multivariate Gaussian
distribution defined by the nominal cross sections and their covariances. . . 65 Figure 5.4 Pairwise plots of the sampled cross sections. The Pearson’s correlation
coeffi-cient and its standard error demonstrate which cross section correlations are statistically significant. . . 65 Figure 5.5 Incremental mean of the sampled response distributions compared to the
nom-inal responses a)R1and b)R2for the bare BeRP ball. . . 67
Figure 5.6 Incremental mean of the sampled response distributions compared to the nom-inal responses a)R1and b)R2for the 3.8 cm polyethylene-reflected BeRP ball. . 68 Figure 5.7 Incremental variance of the sampled response distributions compared to the
response variance in a)R1and b)R2computed with first-order UQ for the bare
BeRP ball. . . 70 Figure 5.8 Incremental variance of the sampled response distributions compared to the
response variance in a)R1and b)R2computed with first-order UQ for the 3.8
cm polyethylene-reflected BeRP ball. . . 71
Figure A.1 Pu-239p(ν,E)plotted as a function of bothνandE [61]. Although the mean of the distribution monotonically increases as a function of energy, the width of the distribution remains constant. . . 82 Figure A.2 Pu-239νandν(ν−1)plotted as a function of incident neutron energy[61]. The
fitted models respectively demonstrate thatνandν(ν−1)vary linearly and quadraticly with respect to energy. . . 83 Figure A.3 Pu-239ν(ν−1)plotted as a function ofν[61].ν(ν−1)is a smoothly varying
CHAPTER
ONE
INTRODUCTION
Neutron multiplicity counting (NMC) is a method for non-destructive analysis of special nuclear material
(SNM) frequently employed in nuclear nonproliferation and material safeguards[19, 48, 9, 11, 53, 36, 28]. Kinetic parameters of an SNM assembly, such as neutron multiplication and neutron lifetime, may be
inferred by fitting models of NMC distribution moments to measured neutron multiplicity counter
responses. How well the inferred kinetic parameters characterize the SNM assembly depends to a large degree on the accuracy and precision of the input nuclear cross sections (e.g. the total and scatter cross
sections) and fission parameters (e.g. the fission cross section, the fission spectrum, and the average
number of neutrons emitted per fission,ν), which for brevity’s sake are hereafter collectively referred to as cross sections.
Energy-dependent cross sections are measured from reaction-rate experiments using the
time-of-flight technique. Nuclear physics models are fit to measured cross sections from several experiments over many energy regions to obtain evaluated cross sections. High-fidelity benchmark critical experiments
are then simulated using the evaluated cross sections to obtain keff-eigenvalues (integral responses)
[54]. If the simulated responses differ significantly from measured responses, the cross sections are adjusted. Cross sections that are deemed appropriate for their intended applications (e.g. criticality
safety or reactor analysis) are then released as a library (e.g. ENDF/B-VII.0[8]).
While evaluated cross sections for plutonium isotopes typically correctly predict the keff-eigenvalue
for plutonium fast metal critical benchmarks[8], they do not adequately predict the NMC distribution
for a subcritical assembly of a highly-multiplying sphere of weapons-grade plutonium metal, which
implies that the cross sections are over-calibrated. Simulation of plutonium intermediate and thermal solution critical benchmarks are also not adequately predicted[8, 50]. Reference[37]found that the
Pu-239νin ENDF/B-VII.1 was over-calibrated to a single critical benchmark, Jezebel. Jezebel is a homogeneous bare metal spherical assembly of weapons-grade plutonium alloy[17]and is the principal critical benchmark for evaluation of plutonium fission parameters. In contrast, NMC experiments are
used to assay subcritical SNM assemblies that are sometimes reflected or moderated by hydrogenous material. Jezebel is principally sensitive to fast neutrons while assemblies with hydrogenous material are
will only inform cross section adjustments in the fast neutron region; potential inaccuracies in the
intermediate and slow region which would not affect simulation of this critical benchmark will have a significant impact on simulation of a subcritical assembly with hydrogenous material.
As shown by Muñoz-Cobo[39], each NMC distribution moment is a function of the cross sections
raised to that moment’s order; consequently, the higher-order NMC distribution moments are more sensitive to changes in the cross sections than the mean, which is equivalent to the gross neutron
count rate. The effect of over-calibration in the cross sections will therefore be more pronounced in the
higher-order NMC distribution moments than in the mean.
Cacuci derived a data assimilation procedure that leverages information theory and Bayes’ theorem
to account for all sources of computational and experimental uncertainty, and he demonstrated that
it provides best-estimate model parameters with reduced uncertainty[5]. In the present work, model calibration is the process of using sensitivity analysis (SA) and uncertainty quantification (UQ) to
perform optimal adjustment of the nuclear cross sections via parameter estimation (PE). O’Brien[41]
developed an adjoint-based SA based on Muñoz-Cobo’s[39]stochastic transport equation (STE) that is applicable to the first and higher-order NMC distribution moments. Mattingly[35]demonstrated that
each NMC distribution moment may be computed using a standard transport solver with a different
fixed, adjoint source, which makes the SA computationally feasible and enables model calibration to be applied to NMC experiments, which will provide cross sections that simulate NMC experiments more
accurately with reduced uncertainty.
Miller[37]and Evans[12]identified a discrepancy between cross section evaluations adjusted with
critical benchmarks and subcritical experiments. Bare metal critical assemblies are sensitive to fast
neutrons, while polyethylene-reflected, subcritical assemblies are sensitive to all neutron energies. The ENDF/B-VII.0 cross sections were adjusted using a bare metal critical benchmark (Jezebel) and were
consequently inaccurate for simulating an NMC experiment with polyethylene-reflected plutonium
metal. While Evans was able to more accurately predict the mean count rate for the polyethylene-reflected BeRP ball by optimizing the cross sections using a subcritical experiment, the behavior of
the subcritical fissile assembly is not sufficiently described by the first NMC distribution moment. The
NMC distribution for multiplying material requires higher-order moments to fully describe; therefore, model calibration applied to the first- and higher-order NMC distribution moments will result in cross
sections that simulate NMC experiments more accurately with reduced uncertainty.
In this dissertation, we apply a) first-order adjoint-based SA to estimate the sensitivity of the first and second NMC distribution moments to the cross sections, b) first-order UQ to estimate the uncertainties
in deterministic transport calculations of the first and second NMC distribution moments, and c)
Bayesian inference, implemented using an extended Kalman filter (EKF), to estimate adjustments to the cross sections that will minimize the error in calculation of the first and second NMC distribution
moments relative to experiment while simultaneously minimizing the uncertainty in the adjusted cross
1.1
Prior work
1.1.1 Characteristics of neutron multiplicity counting
In NMC experiments, the number distribution of coincident neutron counts is accumulated using a
neu-tron multiplicity counter. The nPod neuneu-tron multiplicity counter, pictured in Fig. 1.1, is a polyethylene-moderated array of 15 He-3 proportional counters wrapped in a 0.030-inch thick cadmium lining to
minimize room return. The top part of Fig. 1.2a depicts a detector pulse train that is segmented in
sequential, equal-width coincidence gates. The bottom part of Fig. 1.2a illustrates the accumulation of the coincident counts. Figure 1.2b is an NMC distribution accumulated with a 1024-µs coincidence
gate widthT by counting a highly-multiplying sphere of plutonium metal reflected by polyethylene. A
Poisson distribution with the same mean is shown for comparison.
Figure 1.1The nPod neutron multiplicity counter atop a carbon steel cart.
The counting distribution for independent neutron emissions (e.g. those from(α, n)reactions) is
Poisson-distributed, such that all of the higher-order moments are dictated by the mean; in particular,
the variance of the distribution is equal to its mean. However, neutrons within a fission-chain reaction are not independent of one another; they appear in bursts that are correlated in time. The counting
distribution for multiplying material is therefore a generalized Poisson distribution which requires
(a) (b)
Figure 1.2a) A detector pulse train is segmented into sequential, equal-width coincidence gates and the fre-quency of coincident multiplet neutron counts is accumulated to obtain the NMC distribution. b) An NMC distribution accumulated with a coincidence gate widthT of 1024µs by counting a highly-multiplying sphere of weapons-grade plutonium metal reflected by polyethylene and a Poisson distribution with the same mean. The width of the NMC distribution inexcessof the Poisson distribution is characteristic of multiplying mate-rial.
that is inexcessof the Poisson contribution, due to counts correlated within a fission-chain reaction.
Assay of SNM via NMC experiments therefore requires the first- and higher-order NMC distribution
moments to fully characterize the material.
The order-qNMC distribution moment is expressed as
nq= 1 N
N X
n=0
nqf(n), (1.1)
whereN=PNn=0f(n)is the total number of coincidence gates andf(n)is the NMC distribution
accu-mulated from a detector pulse train, like that shown in Fig. 1.2a. Similarly, the order-qNMC distribution central moment is
µq = 1
N N X
n=0
(n−n)qf(n). (1.2)
The NMC distribution moments are a function ofT; however, in this dissertation, we analyze the asymptotic value of the NMC distribution moments. Feynman defined a measure of variance in the
NMC distribution in excess of a Poisson distribution,
Y =µ2
n −1, (1.3)
which was initially used to measure the dispersion of the multiplicity of induced fission neutrons in U-235[19]. In Eq. (1.3),nandµ2are the mean and variance off(n); note thatY vanishes for
Poisson-distributed counts.Y is also a function ofT, exhibiting asymptotic behavior for wide coincidence
After Feynman’s work, Terrell discovered that the cumulative fission multiplicity distribution exhibits
a Gaussian shape[55]. Zucker and Holden later evaluated fission multiplicity distributions as a function of energy[61]. The induced fission multiplicity distribution moments used in this work originate from
the Zucker and Holden measurements.
1.1.2 Models of neutron multiplicity counting distribution moments
Hage and Cifarelli[9]developed a three-parameter point-kinetics model of NMC distribution moments in terms of singles, doubles, and triples rates, which are the first three reduced-factorial moments1
of the NMC distribution. Robba, Dowdy, and Atwater[48](RDA) developed a similar point-kinetics
model in terms of the FeynmanY. Hage and Cifarelli[9]demonstrated that the NMC distribution is a generalized Poisson distribution which does not explicitly depend on the mean, enabling Prasad and
Snyderman[44]to derive a point-kinetics generating function of NMC distribution moments in terms of a generating function of the fission neutron number distribution moments, which describes the
number distribution of neutrons produced from fission chains in the system.
The point-kinetics models developed by Hage and Cifarelli, RDA, and Prasad and Snyderman all assume that the neutron population behavior is separable in space and time. However, in heterogeneous
assemblies where the neutron lifetime varies by orders of magnitude in different regions, this assumption
does not hold. Consequently, this dissertation employs a more generally applicable model based on neutron transport.
Muñoz-Cobo[39]derived the stochastic transport equation (STE) using a probabilistic description
of the neutron population developed by Pál[43]and Bell[2]. The solution of the STE is a generating function whose first moment is the fixed-source adjoint Boltzmann neutron transport equation (NTE).
Higher-order moments of the STE generating function are adjoint transport equations; they have the
same adjoint transport operator but different fixed, adjoint source terms that are defined in terms of lower-order adjoint fluxes. Therefore, standard transport solvers may be used to compute the
higher-order adjoint fluxes and higher-higher-order NMC distribution moments[41]. Davis[20]computed neutron and
fission number distribution moments using Pál[43]and Bell’s[2]formalism. Mattingly[35]performed deterministic calculations with the multigroup discrete-ordinates code PARTISN[1]to obtain NMC
distribution moments by computing moments of Muñoz-Cobo’s[39]STE generating function. Humbert [26]computed the NMC distribution itself using Pál[43]and Bell’s[2]formalism via deterministic calculations with the multigroup discrete-ordinates code PANDA[25].
1.1.3 Identification of over-calibration in the Pu-239ν
Miller[37]demonstrated that continuous-energy and -angle Monte Carlo code MCNP[59] simula-tions of a 4.5-kg sphere of weapons-grade, alpha-phase plutonium metal (the BeRP ball2) consistently
1Factorial and reduced-factorial moments are respectively defined asx
q= Pxmax
x=q−1x(x−1)...(x−q+1)f(x)andrxq=
1
q!
Pxmax
x=q−1x(x−1)...(x−q+1)f(x), such thatrxq= xq q!.
2The plutonium sphere is nicknamed the “Beryllium-Reflected Plutonium (BeRP) ball” because it was originally used in
overpredicted the mean and variance of the NMC distribution for bare and polyethylene-reflected
configurations. Miller investigated and eliminated a variety of assembly and detector properties as potential causes of the discrepancy, and he ultimately demonstrated that a small (∼1%) scalar reduction
in the value of the ENDF/B-VII.1 Pu-239νaccurately predicted NMC distribution moments. In the release of the ENDF/B-VII.03cross section library, the evaluators noted that the value of the Pu-239 νwas increased by more than two standard deviations below 1.5 MeV to match the Jezebel critical benchmark[8]. It was later noted in the ENDF/B-VII.1 release that the Pu-239 cross sections were such
that intermediate and thermal solution benchmarks were not adequately simulated[7].
Evans[12]implemented an energy-dependent adjustment to the Pu-239νusing Cacuci’s data assim-ilation procedure applied to three-dimensional multigroup discrete-ordinates Denovo[13]simulations
of gross neutron counting of the bare and polyethylene-reflected BeRP ball. Evans’ findings were consis-tent with those of Miller and with the ENDF/B-VII.0 release notes in thatνshould be reduced by one standard deviation above 100 keV and two standard deviations below 100 keV.
Recently, Whewell[60]performed a sampling-based calibration of the ENDF/B-VII.0 Pu-239νusing MCNP code fixed-source simulations of NMC of the BeRP ball and keff-eigenvalue simulations of Jezebel.
Large deviations in the sampledνwere penalized unless they resulted in a significant improvement in a χ2error metric. The calibratedνreduced the NMC distribution bias but increased the k
eff-eigenvalue
bias because of large statistical uncertainties. Endo[10]utilizedα-eigenvalue measurements to reduce the keff-eigenvalue uncertainty due to the cross sections. The bias factor and generalized linear least
squares methods were applied to PARTISN[1]keff- andα-eigenvalue simulations of a polyethylene-moderated highly-enriched uranium assembly to calibrate the prompt fission spectrumχand prompt ν. The high degree of correlation between the keff- andα-eigenvalue measurements and between the
prompt and totalχandνresulted in a smaller keff-eigenvalue uncertainty than could be obtained with calibration using a keff-eigenvalue measurement alone.
1.2
Novel contributions
This dissertation presents the first application of model calibration to NMC experiments that utilizes
adjoint-based SA, first-order UQ, and Bayesian-inference-based PE. While adjoint-based SA of the first
NMC distribution moment (i.e. the mean count rate of a detector) is well-established[22, 12, 18], SA of the second and higher-order NMC distribution moments is relatively new and was demonstrated by
O’Brien[41]to be computationally feasible. We therefore utilize adjoint-based SA to perform the first
calculation of the variance in the second NMC distribution moment due to cross section covariances using first-order UQ. We also perform sampling-based uncertainty quantification (UQ) to directly
compute variance in the responses due to covariance in the cross sections and demonstrate that the response variances are well-approximated by first-order UQ. As a consequence, we further demonstrate
that first-order perturbation theory is appropriate for the particular subcritical assembly we analyzed.
discussed in this dissertation.
3No change was made to the Pu-239νbetween the VII.0 and VII.1 releases. One significant difference in the VII.1 release is
Bayesian inference is used to perform cross section evaluation and validation[8, 3, 54]and was
recently utilized by Evans[12]in optimally adjusting the cross sections to a subcritical experiment. The application of an EKF to NMC experiments for optimal cross section adjustment is novel, however, and
is shown in this dissertation to produce best-estimate cross sections such that NMC experiments are
more accurately simulated with reduced uncertainty. Additionally, uncertainty in the NMC distribu-tion moments due to both random and systematic sources of uncertainty are included in the model
calibration process, whereas Evans’ work only accounted for random sources of uncertainty.
1.3
Outline of this dissertation
This dissertation begins by summarizing the model calibration process in Chap. 2. Section 2.2 presents
calculation of the detector response moments for an arbitrary geometry in continuous energy and continuous angle. Section 2.3 summarizes the adjoint-based SA and provides notable additions to
O’Brien’s[41]work. Section 2.4 presents calculation of the detector response moments and their
sensi-tivity to the cross sections with the energy variable discretized via the multigroup approximation and the angle variable in the scatter source treated with a Legendre polynomial moment expansion for a
one-dimensional spherical geometry. Notably, Table 2.1 provides the specific form of the adjoint-based
sensitivity of the detector response moments to all cross sections. Section 2.5 describes random and systematic sources of uncertainty and discusses their propagation through the measured and simulated
detector response moments.
Chapter 3 details the model calibration process applied to NMC of a highly-multiplying sphere of weapons-grade (∼6% Pu-240) plutonium metal in bare and polyethylene-reflected configurations.
Section 3.1 presents the EKF algorithm and describes how the response sensitivities and uncertainties
affect the optimal adjustment of the cross sections and cross section covariances. We describe in Sec. 3.2 the detector response moment sensitivity to the fission parameters (i.e. moments of the induced
fission neutron multiplicity distributionp(ν,E), the fission cross sectionσf, and the fission spectrum χ) as well as the adjustment to the fission parameters and to their covariances. We compare measured detector response moments to those simulated with the nominal and optimally adjusted cross sections
and demonstrate that NMC experiments are more accurately simulated with reduced uncertainty.
Chapter 4 provides a detailed comparison between model calibration applied to one-dimensional (spherical) simulations of gross neutron counting of the plutonium sphere and data assimilation applied [12]to three-dimensional simulations of the same source-detector configuration. We demonstrate that the loss of detail in a one-dimensional simulation has not significantly impacted the accuracy of the simulated responses. We also demonstrate that performing model calibration with both random
and systematic sources of uncertainty produce cross section adjustments that are similar in trend but increased in magnitude compared to that provided by model calibration with random sources of
uncertainty only.
UQ adequately estimates the response variances due to the cross section covariances. We further show
that first-order perturbation theory is appropriate for NMC of a highly-multiplying sphere of weapons-grade plutonium metal in bare and polyethylene-reflected configurations.
Chapter 6 provides conclusions and recommended future work. We emphasize that the model
calibration process can include more cross sections than are analyzed here, provided their nominal values and covariances are available. The model calibration process may therefore be extended to NMC
CHAPTER
TWO
SENSITIVITY ANALYSIS AND UNCERTAINTY QUANTIFICATION APPLIED
TO NEUTRON MULTIPLICITY COUNTING
This chapter provides a derivation of the adjoint-based SA applied to NMC, as well as a discussion of the sources of random and systematic uncertainty in the detector response moments. After outlining the
model calibration process in Sec. 2.1, Secs. 2.2 and 2.3 respectively present calculation of the detector
response moments and their sensitivity to the cross sections for a general geometry in continuous energy and continuous angle. Sec. 2.4 then presents the responses and sensitivities with energy discretized via
the multigroup approximation and with the angle variable in the scatter source treated with a Legendre
polynomial expansion for a one-dimensional spherical geometry. Section 2.5 discusses the sources of random and systematic uncertainties and describes how each may be reduced.
2.1
Model calibration process
Model calibration of nuclear cross sections is performed in three steps, illustrated in Fig. 2.1.
1. The sensitivity of a detector response moment to the cross sections is computed using an
adjoint-based approach. Previous work by O’Brien[41]utilized Muñoz-Cobo’s[39]STE to compute NMC distribution moments and their sensitivity to the cross sections.
2. The sensitivities are then used to propagate covariance between the nuclear cross sections through
the detector response moments via linear propagation of uncertainty. This step is an inner product
between the sensitivities and cross section covariances.
3. The sensitivities and response covariances are then used to inform optimization of the cross
sections and their covariances via parameter estimation (PE). The result is a set of cross section values that are “optimal” in that the error between measured and simulated detector responses is
Sensitivity
Analysis (SA)
•Adjoint-based first
derivatives
•Sensitivity of detector responses to cross sections
Uncertainty
Quantification
(UQ)
•First-order propagation of uncertainty
•Detector response covariances
Parameter
Estimation (PE)
•Model calibration
•Best-estimate cross sections and covariances
Figure 2.1Flowchart of the model calibration process. Detector response moment sensitivities to the cross sections and detector response moment covariances due to cross section covariances are used to inform cross section optimization via model calibration.
2.2
Calculation of detector response moments
O’Brien demonstrated that the sensitivity of each NMC distribution moment (i.e. detector response moment) may be computed with adjoint-based methods applied to moments of the STE generating
function[41]. Because each NMC distribution moment is derived from an inner product of the solution
to an adjoint transport equation with a special fixed, adjoint source, standard deterministic transport solvers may be used to compute the higher-order detector response moments. Adjoint-based methods
are advantageous because they require few transport solves compared to numerical differentiation,
making SA of the higher-order NMC distribution moments computationally inexpensive. This SA frame-work is utilized in this dissertation to perform model calibration of nuclear cross sections applied to the
first and second NMC distribution moments.
What follows is the calculation of the NMC distribution moments and a summary of O’Brien’s SA,
with some notable additions:
1. O’Brien treated the fission and scatter cross sections, which appear in both the total loss operator and their respective source terms in the NTE, as independent of the total cross section. The
derivations in this paper account for the relationship of the fission and scatter cross sections to
the total cross section.
2. O’Brien defined a scalar, relative sensitivity rank as the product of the group-averaged cross section and group-summed derivative of the response with respect to the cross section. What is given
here instead are scalar, relative sensitivity totals, which are a more standard[22]way of comparing
the effect of a change in the cross sections on the responses.
This section and Sec. 2.3 derive the detector response moments and their sensitivity to the cross
sec-tions, respectively, for an arbitrary geometry in continuous energy and continuous angle. Section 2.4 presents the response and sensitivity equations with the energy variable discretized via the multigroup
approximation and the angle variable in the scatter source treated by Legendre polynomial expansion
for a one-dimensional spherical geometry.
Higher-order detector response moments (i.e. higher-order NMC distribution moments) may be
computed using the STE generating function to derive higher-order adjoint NTEs with non-reentrant
boundary conditions[39]. Each equation for a higher-order adjoint flux,
L∗ψ∗q =Qq∗,q=1, 2, ..., (2.1)
has the standard, adjoint transport operatorL∗, defined as
L∗=−Ωˆ· ∇+Σt(r~,E)
−
Z
4π
dΩ0 Z ∞
0
d E0Σs(r~, ˆΩ,E →Ωˆ0,E0)
−νΣf(r~,E) Z
4π
dΩ0 Z ∞
0
d E0 χ(r~,E
0)
4π ,
(2.2)
with a special fixed, adjoint sourceQq∗.q =1 denotes the standard adjoint NTE for a fixed source subcritical problem whileq>1 denotes higher-order adjoint flux and adjoint source terms. The material cross sections are defined as
Σt(~r,E) =Σc(r~,E) +Σf(r~,E) +Σs(r~,E) = total cross section,
Σc(r~,E) = capture cross section,
Σf(r~,E) = fission cross section,
Σs(r~,E)≡ Z
4π
dΩ0 Z ∞
0
d E0Σs(r~, ˆΩ,E →Ωˆ0,E0) = scatter cross section,
χ(r~,E)
4π = fission neutron spectrum, νΣf(r~,E) = fission neutron production
cross section,
(2.3)
and have units ofcm1 , except for the material fission spectrum, which has units ofMeV1 . Setting the
first-moment adjoint source termQ1∗to be the detector response functionΣd means that the mean count rateR1of the detector may be computed by taking the inner product of the standard forward flux
ψand the adjoint source term,
R1=
ψ,Q1∗=ψ,Σd
, (2.4)
f,g=
Z V d V Z 4π dΩ Z ∞ 0
d E f(r~, ˆΩ,E)g(r~, ˆΩ,E). (2.5) ψis computed by solving the standard forward NTE,
Lψ=Q, (2.6)
with non-reentrant boundary conditions and the standard forward transport operatorL, defined as
L=Ωˆ· ∇+Σt(r~,E)
−
Z
4π
dΩ0 Z ∞
0
d E0Σs(r~, ˆΩ0,E0→Ωˆ,E)
−χ(r~,E) 4π
Z
4π
dΩ0 Z ∞
0
d E0νΣf(r~,E0),
(2.7)
and forward source termQ.R1in Eq. (2.4) is identical to the mean of the NMC distribution divided by
the coincidence gate widthT; i.e.,
R1=
n
T. (2.8)
Similar to Eq. (2.4), higher-order detector response moments may computed as
Rq= ¬
ψ,Qq∗¶+¬S,Qq∗,s f¶, (2.9) where the two inner products account for the contribution of induced and spontaneous fission to the
detector response moment;S is the spontaneous fission rate density and spectrum of the fixed source
with units ofspontaneous fissionss cm3MeV
. In the special case whereq=1,Qq∗,s f ≡0, such thatR1is the mean count
rate.
Forq=2, the adjoint source terms are defined as
Q2∗(r~,E) =ν(ν−1)Σf(r~,E)I12(r~), (2.10)
Q2,∗,s fj (r~) =ν(ν−1)s fj I1,2s f(r~), (2.11) and are the importance of correlated pairs of induced and spontaneous fission neutrons, respectively, toR2. The importance of induced and spontaneous fission neutrons to the mean count rate are
I1(r~) = Z
4π
dΩ0 Z ∞
0
d E0χ(r~,E
0)
4π ψ
∗
1(r~, ˆΩ
0,E0), (2.12)
I1,s f(r~) = Z
4π
dΩ0 Z ∞
0
d E0χs f(r~,E
0)
4π ψ
∗
whereχs f is the spontaneous fission neutron spectrum.
Note that Eq. (2.10) is defined for a material while Eq. (2.11) is defined for a nuclide j. While the material cross sections given in Eq. (2.3) have standard[23]definitions given by
Σx(r~,E) = J X
j=1
Nj(r~)σxj(E), (2.14)
νΣf(r~,E) = J X
j=1
Nj(r~)νσfj(E), (2.15)
for an assembly composed ofJ nuclides with nuclide atom densityNj(r~)and microscopic cross sections σxj(E)andνσ
j
f(E), the cross sections in Eqs. (2.10) and the second inner product in Eq. (2.9) require special consideration (calculation of the material fission spectrum is discussed in note 3). The material fission neutron dispersion cross section in Eq. (2.10) is defined as
ν(ν−1)Σf(r~,E) = J X
j=1
ν(ν−1)j(E)Nj(r~)σfj(E). (2.16)
Similarly, the material source neutron dispersion cross section is defined as
ν(ν−1)s fS(r~,E) = J X
j=1
ν(ν−1)s fj Sj(r~,E), (2.17)
such that the second inner product in Eq. (2.9) is computed as
¬
S,Q2,∗s f¶= * J
X
j=1
h
ν(ν−1)s fj Sj(r~,E) i
Is f2 (r~) +
. (2.18)
ν(ν−1)j(E)andν(ν−1)s fj are the second factorial moments of the induced and spontaneous fission multiplicity distributionspj(ν,E)andps fj (ν), respectively, and are respectively defined as
ν(ν−1)j(E) =
νmax
X
ν=1
ν(ν−1)pj(ν,E), (2.19)
ν(ν−1)s fj =
νmax
X
ν=1
ν(ν−1)ps fj (ν), (2.20)
where ν represents the number of neutrons emitted per fission,νmax is the maximum number of
neutrons emitted per fission (typicallyνmax∼8), andE is the energy of an incident neutron.
It is clear from Eqs. (2.10) and (2.12) that becauseQ2∗ is computed with the square ofI1,R2is a
function of cross sections squared. Because the second-moment adjoint source termsQ2∗andQ2,∗s f are defined in terms of the standard adjoint fluxψ∗
1,R2is fully calculable using a standard transport solver.
R2=
µ2−n
T . (2.21)
For a Poisson-distributed process,µ2=nandR2=0. It is therefore evident from Eq. (2.21) thatR2is the
part of the NMC distribution variance inexcessof the Poisson contribution.
2.3
Sensitivity analysis of the detector response moments
The sensitivity of the mean count rateR1to a cross sectionαin the setα={ν,ν(ν−1),χ,σf,σs,σc}
using adjoint-based methods described by O’Brien[41]may be expressed as
∂R1
∂ α =
∂Q1∗ ∂ α ,ψ +ψ∗ 1, ∂Q ∂ α − ∂L ∂ αψ · . (2.22)
Because the variance in the NMC distribution in excess of the Poisson contributionR2can be computed
with the second-moment adjoint source termQ∗
2, which is defined by the standard adjoint flux (see Eqs.
(2.10) and (2.12)), adjoint-based SA may also be utilized to express the sensitivity ofR2toαas[41]
∂R2
∂ α = ψ∗ 2, ∂Q ∂ α − ∂L ∂ αψ · +2
Φ,∂Q
∗
1
∂ α − ∂L∗
∂ αψ∗1
+
∂Q2∗
∂ β ,ψ
+
∂Q∗
2,s f ∂ β ,S
+Q2,∗s f,∂S ∂ α
·
,
(2.23)
whereβ={ν(ν−1),ν(ν−1)s f,σf,χ,χs f}is a cross section in the subset ofαthat appears explicitly in the adjoint source terms and calculation ofΦis discussed below.
For example, the derivative ofQ2∗with respect toαhas two components due to the product rule, ∂Q2∗
∂ α = ∂Q2∗
∂ β +F∗ ∂ ψ∗
1
∂ α . (2.24)
The first term,
∂Q2∗ ∂ β =
∂
∂ β ν(ν−1)Σf(r~,E)
I2(r~)
+2ν(ν−1)Σf(r~,E)I(r~) Z
4π
dΩ0 Z ∞
0
d E0∂ χ(r~,E
0)
∂ β ψ∗1(r~, ˆΩ
0,E0),
(2.25)
contains only derivatives with respect to the cross sections that appear explicitly in Eq. (2.10), with no
derivatives of the flux. The second term contains a new adjoint operatorF∗,
F∗=2ν(ν−1)Σf(r~,E)I(~r) Z
4π
dΩ0 Z ∞
0
d E0χ(r~,E0), (2.26) that operates on the derivative of the adjoint flux with respect to the cross sections. To avoid computing the flux derivative, Anistratov[41]used the relationship between forward and adjoint transport operators
(2.23) and represents the flux of induced (Φ1) and spontaneous (Φ1,s f) fission neutrons that contribute
to the second-moment detector response, respectively. They are computed by solving the new forward transport equations
LΦ1=I1Qf1, (2.27)
LΦ1,s f =I1,s fQf1,s f, (2.28)
with the standard forward transport operatorLof Eq. (2.7), non-reentrant boundary conditions, and
special fixed, forward source terms[41],
Qf1(r~,E) =χ(r~,E) 4π
Z
4π
dΩ0 Z ∞
0
d E0ν(ν−1)Σf(r~,E0)ψ(~r, ˆΩ0,E0), (2.29)
Qf1,s f(r~,E) =
χs f(r~,E) 4π
Z
4π
dΩ0 Z ∞
0
d E0ν(ν−1)s fS(r~,E), (2.30) that are the source of correlated neutron pairs from induced and spontaneous fission, respectively.
Instead of solving Eqs. (2.27) and (2.28) individually, they may be combined into a single equation (also with non-reentrant boundary conditions) because they have the same forward transport operator,
LΦ=LΦ1+LΦ1,s f =I1Qf1+I1,s fQf1,s f. (2.31)
A single transport solve using the combined forward fixed source term given by Eq. (2.31) may then be
used to computeΦ. Because the source terms for the second-moment adjoint fluxψ2and the
second-moment forward fluxΦare defined in terms of the standard adjoint and forward fluxes, the sensitivity
ofR2to the cross sections is fully calculable using a standard transport solver.
2.4
Multigroup approximation and Legendre polynomial expansion applied
to detector response moments and their sensitivity to the cross
sec-tions
The forward and adjoint NTE may be discretized in energy via the multigroup approximation[1],
fg(r~, ˆΩ) = R
∆Egd E W(E)f(r~, ˆΩ,E)
R
∆Egd E W(E)
,g=1, ...,G, (2.32)
whereW(E)is a weighting function. Multigroup cross sections (Σt,Σs,Σf, andνΣf) may be defined by choosingW(E)to be the forward, scalar flux.1Multigroup fluxes, sources, and isotopic fission spectra
1A mathematically exact expression for the multigroup cross sections is obtained by choosing the weight function to be the
χj are obtained by settingW(E)to unity (calculation of the multigroup material fission spectrumχis discussed in note 3).
The Zucker and Holden[61]p(ν)distribution momentν(ν−1)is defined for the coarse grid of incident neutrons energies, 0, 1, ..., 10 MeV[61]. To obtain an arbitrary multigroupν(ν−1), a quadratic model in energy was fit to theν(ν−1)reported by Zucker and Holden. The value ofν(ν−1)for the desired group structure was then obtained by applying the multigroup approximation to the model.
Fits of the quadratic model in energy to the U-235, U-238, and Pu-239ν(ν−1)are plotted in Fig. 2.2 for reference.
,QFLGHQWQHXWURQHQHUJ\0H9
3X
=XFNHUDQG+ROGHQGDWD
3X
( ( 8
=XFNHUDQG+ROGHQGDWD
8
( ( 8
=XFNHUDQG+ROGHQGDWD
8
( (
Figure 2.2Fits of a quadratic model in energy to Zucker and Holden data for the U-235, U-238, and Pu-239 ν(ν−1).
The forward and adjoint fluxes and the scatter cross section may be treated in angle via a Legendre polynomial expansion[1]. The order-mforward fluxes, adjoint fluxes, and scatter cross section moments
(for one-dimensional geometry) are respectively defined as
scalar flux spectrum is typically easier to obtain and provides multigroup cross sections that preserves the values of reaction rates (e.g.PG
φm(r~,E) =1 2
Z 1
−1
dµPm(µ)ψ(r~,E,µ), (2.33)
ϕm(r~,E) =1 2
Z 1
−1
dµPm(µ)Φ(r~,E,µ), (2.34)
φ∗,m
q (r~,E) = 1 2
Z 1
−1
dµPm(µ)ψ∗q(r~,E,µ),q=1, 2, (2.35)
Σm
s (E →E0) = 2m+1
2
Z 1
−1
dµPm(µ) Z 1
−1
dµ0Pm(µ0)Σs(µ·µ0,E →E0), (2.36)
wherePmis a Legendre polynomial of orderm.m=0 denotes an isotropic flux or scatter cross section
whilem>0 denotes increasing orders of anisotropy. The inclusion of the 2m+1 normalization factor in Eq. (2.36) is consistent with the scatter cross section moments generated by the code package SCALE [46].
The equations for the forward and adjoint fluxes and their respective operators and sources are
recast after applying the multigroup approximation and Legendre polynomial expansion for a
one-dimensional geometry.2The standard group forward NTE, new group forward NTE, and the standard group forward transport operator are respectively recast as
Lgψg=Qg, (2.37)
LgΦ1,g=I1Qf1,g+I1,s fQf1,s f,g, (2.38)
and
Lg=Ωˆ· ∇+Σt,g(r~)
−
M X
m=0
G X
g0=1
Pm(µ)Σms,g0→g(r~) 1 2
Z 1
−1
dµ0Pm(µ0)
−χg(r~) G X
g0=1
νΣf,g0(r~) 1 2
Z 1
−1
dµ0.
(2.39)
The first- and second-moment group adjoint NTE and standard group adjoint transport operator are respectively redefined as
L∗gψ∗q,g=Qq∗,g,q=1, 2 (2.40)
2For the one-dimensional spherical geometry problem that we discuss later in this dissertation, ˆΩ· ∇ψ= µ
r2
∂(r2ψ)
∂r +
1
r
∂[(1−µ2)ψ]
and
L∗g=−Ωˆ· ∇+Σt,g(r~)
−
M X
m=0
G X
g0=1
Pm(µ)Σms,g→g0(r~) 1 2
Z 1
−1
dµ0Pm(µ0)
−νΣf,g(r~) G X
g0=1 χg0(r~)
1 2
Z 1
−1
dµ0.
(2.41)
The second-moment induced and spontaneous fission forward source terms are respectively altered to
be
Qf1,g(r~) =χg(r~) G X
g0=0
ν(ν−1)Σf,g0(r~)φg00(r~) (2.42)
and
Qf1,s f,g(r~) =χs f,g(r~) G X
g0=0
ν(ν−1)s fSg0(r~). (2.43)
The second-moment adjoint induced fission source term becomes
Q2,∗g(r~) =ν(ν−1)Σf,gI12(r~). (2.44)
The second-moment adjoint spontaneous fission source term defined in Eq. (2.11) is not a function of
energy. The first-moment induced and spontaneous fission importances are respectively changed to
I1(r~) = G X
g0=1
χg0(r~)φ1,∗,0g0(r~) (2.45)
and
I1,s f(r~) = G X
g0=1
χs f,g0(r~)φ1,∗,0g0(r~). (2.46)
If the inner product given by Eq. (2.5) is redefined to only be over position and direction as
f,h=
Z
V d V
Z
4π
dΩf(r~, ˆΩ)h(r~, ˆΩ), (2.47) the group detector response moments may be defined as
Rq,g= ¬
ψg,Qq∗,g¶+¬Sg,Qq∗,s f 
, (2.48)
and the sensitivities ofR1andR2at groupg to a cross section at groupg0have the same form as their
respective continuous-energy definitions given in Eqs. (2.22) and (2.23); i.e.,
∂R1,g ∂ αg0
=
∂Q∗
1,g ∂ αg0
,ψg
+
ψ∗
1,g, ∂Qg ∂ αg0
−∂Lg
∂ αg0 ψg
and
∂R2,g ∂ αg0 =
ψ∗
2,g, ∂Qg ∂ αg0−
∂Lg ∂ αg0ψg
+2
Φ1,g, ∂Q∗
1,g ∂ αg0 −
∂L∗
g ∂ αg0ψ
∗
1,g
+
∂Q∗
2,g ∂ βg0
,ψg
+
∂Q∗
2,s f ∂ βg0
,Sg
+
Q2,∗s f, ∂Sg ∂ αg0
.
(2.50)
The magnitude of the absolute sensitivity defined in Eqs. (2.49) and (2.50) can vary greatly with respect to cross section and energy group, so it is standard practice[22]to define a relative sensitivity as
SRq,g,αg0= αg0 Rq,g
∂Rq,g ∂ αg0
, (2.51)
which is scaled by the cross section and response values themselves. Equation (2.51) describes a linear relationship between a change in the group cross section and a corresponding change in the group
detector response. For example, a relative sensitivity of 1 would mean that a 1% increase in the cross
section would result in a 1% increase in the detector response.
Equation (2.51) is an element of a matrix of relative sensitivities of dimensionG×G, where the rows
are the cross section groupsg0and the columns are the response groupsg. A vector of sensitivities of dimensionG×1 that quantifies the relative sensitivity of the integrated detector response to the group cross sections may be obtained by summing either Eq. (2.49) or Eq. (2.50) over groupg and multiplying
by the ratio of the group cross section to the integrated detector response; i.e.,
SRq,αg0= αg0
Rq G X
g=1
∂Rq,g ∂ αg0
. (2.52)
Scalar sensitivity totals may be obtained by summing the vector of relative sensitivities over groupg0,
SRq,α= G X
g0=1
SRq,αg0. (2.53)
The relative sensitivity matrix in Eq. (2.51) is used only to derive the relative sensitivity vector in Eq.
(2.52). Relative sensitivity vectors for multiple responses (e.g.R1andR2) are columns of a sensitivity matrix that is utilized in the model calibration process (see Sec. 3.1). Plots of relative sensitivity vectors
and totals will be given in Chap. 3.
Table 2.1 summarizes the relative sensitivity of the detector response moments to the group micro-scopic cross sections for nuclide jwith number densityNj. Because the fission neutron production
cross section is used to compute the material fission spectrum,3the sensitivity of the responses with respect toχj,νj, andσj
f must all reflect this dependence, which is explicitly given in Table 2.1. Because
3In PARTISN, the material fission spectrum,
χg(r~) = PJ
j=1χ
j gN
j(~r)PG g0=1νσ
j f,g0fg0 PJ
j=1Nj(r~)
PG g0=1νσ
j f,g0fg0
, (2.54)
is computed as an average of the isotopic fission spectraχjweighted by the fission neutron production cross sections with
number densityNj.f is an analytic function constructed from a Maxwellian distribution for thermal energies, a1
v spectrum
the group sum over the fission spectrum must equal unity, the sensitivity of the responses with respect
toχj has a normalization constraint. This constraint is not given in Table 2.1 but is discussed by Favorite [18]in the context of response sensitivities to material density and composition parameters (e.g. nuclide weight fractions).
An unconstrained group cross section (e.g. the fission cross section) is allowed to vary independent of any adjustment to the other group cross sections. The fission spectrumχis constrained to sum to unity, however, and so an adjustment to one groupχgmust have a corresponding adjustment to some or all of the other groups in order to enforce the constraint. The sensitivity of a detector response moment to the fission spectrum must therefore reflect the interdependence of the groupχg. For the fission spectrum, the relationship between the constrained and unconstrained relative sensitivity vectors is
given by Favorite[18]as
SRC
q,χg =SRq,χg −χg
X
g0
SRq,χg0, (2.55)
whereSRC
q,χg andSRq,χg are the constrained and unconstrained relative sensitivity vectors, respec-tively. One way to think about this relationship is that the unconstrained sensitivity is adjusted by the
fraction to which the group parameter contributes to the sensitivity total. For the specific constraint that the fission spectrum must sum to unity, the sum of Eq. (2.55) over groupg (i.e. the constrained
sensitivity total) is zero. This means that changes in the detector response due to a change in the group
fission spectrum at groupgare balanced by corresponding changes in the other group fission spectrum terms.
Note that Favorite[16]provided a table ofR1 sensitivity vectors that are nearly identical to the
R1sensitivities given here but do not express their relationship to the material fission spectrum. The
sensitivities given by Favorite are also defined for the fission spectrum as a function of incident and
emergent neutron energies.4
The sensitivities given in Table 2.1 are defined in terms of inner products between forward and adjoint angular fluxes as well as between their Legendre polynomial expansion moments for a
one-dimensional geometry. The scatter cross section is also given in terms of its Legendre polynomial
expansion moments.
Inner products between the forward and adjoint flux moments must reflect the fact that they
are defined for directions opposite one another. Favorite[14]distinguished between computational
moments, which are calculated by transport solvers and defined by Eqs. (2.33), (2.34), and (2.35), and inner product moments, which account for the reversal in the adjoint flux direction[14]. For a
one-dimensional spherical or slab geometry, this amounts to a simple correction factor that is positive for the zeroth and even Legendre polynomial moments and negative for odd Legendre polynomial moments.
The relationship between computational and inner product moments is given explicitly for the forward
and adjoint fluxes as
4Data representing the fission spectrum as a function of incident and emergent neutron energies (i.e.χ
g0→g) are available;


![Figure 4.1 The SNAP gross neutron counter with its front polyethylene cover removed [12].](https://thumb-us.123doks.com/thumbv2/123dok_us/1973.1154775/65.612.132.484.73.338/figure-snap-gross-neutron-counter-polyethylene-cover-removed.webp)