THE DETECTION
OF
COMPLEMENTATION MAP CLUSTERS BY COMPUTER ANALYSIS0. J. GILLIE A N D R. PET0
National Institute for Medical Research, The Ridgeway, Mill Hill, London, N . W . 7 Medical Research Council Statistical Research Unit, 115 Gower Street, London, W . C . 1
Received October 29, 1968
ALLELIC complementation is now a well known phenomenon which has been found to occur in a wide variety of micro-organisms and in some higher or- ganisms (review, FINCHAM 1966). Allelic complementation may occur when two separate mutations at the same gene locus, but on different homologous chro- mosomes, are introduced into the same cell. When under these conditions the phenotype is non-mutant, complementation is said to occur. Experimental evi- dence has shown that this phenomenon can be accounted for in terms of the sub- unit structure of multimeric protein molecules. In particular it has been shown in alkaline phosphatase of E. coli (SCHLESINGER and LEVINTHAL 1963) and in glutamic dehydrogenase of Neurospora crassa ( CODDINGTON and FINCHAM 1965; CODDINGTON, FINCHAM and SUNDARAM 1966) that inactive mutant enzyme molecules may reaggregate, by virtue of their subunit structure, to form enzy- matically active, hybrid protein.
CRICK and ORGEL (1964) proposed a theory of allelic complementation based on the symmetry properties of protein multimers. They concluded that comple- mentation involved the correction of a misfolded mutant polypeptide chain by a wild-type polypeptide chain in regions adjacent to the axes of symmetry of a mul- timer.
Studies of several complementation maps ( GILLIE 1966,1968) have shown that clustering of mutants occurs on these maps in a way which is consistent with the CRICK-ORGEL theory of complementation. Since no other suggestion has been made to account for this clustering, its existence lends some support to the theory. Clustering of mutants was originally identified by inspection of the comple- mentation map and matrix. This procedure is not satisfactory because allowance has to be made for any differences between the map and the matrix due to ‘ex- ceptional mutants’. For this reason it seemed desirable to look for a less subjective method of analysing complementation data which would identify the clusters by analysing the matrix itself rather than the map. Furthermore, it was considered that the availability of an easy method of analysing complementation data would enable complementation studies to be done on a larger and more routine basis, al- lowing more detailed analysis and comparison of mutant defects at the functional level. With these aims in mind we have designed a computer program to analyse complementation data.
330 0. J. GILLIE A N D R . PET0
AIMS A N D METHODS O F ANALYSIS
General considerations: Mutants with identical complementation reactions with all other mu- tants are placed in the same complementation group. These groups are then arranged to form a matrix showing the complementation reactions of the groups with each other. This matrix is then used as the basis for further analysis by our computer method and by map-making.
The computer program works from the matrix to identify a small number of clusters of mod- erately similar, mutually noncomplementing groups. The clusters of mutants which we identify
in this way may be interpreted, according to the CRICK-ORGEL theory, as representing mutations clustered at the particular parts of the polypeptide chain where it intersects the axes of symmetry of the protein multimer. We can only identify a minimum number of these clusters and so infer a minimum number of intersections of the polypeptide chain with the axis of symmetry of the molecule (GILLIE 1968).
In the computer analysis we have imposed the strict requirement that no complementation between members of one cluster should occur. This requirement was sometimes relaxed in the manual analysis (GILLIE 1968) when it was felt that a particular mutant ‘naturally’ lay in a certain cluster (by virtue of its position in the map), despite having one or t w o positive reactions with members of that cluster. The computer classifies such mutants either as members of another cluster or on their own as exceptions.
In general, it is our aim to divide the groups up into the minimum number of clusters of mutually noncomplementing complementation groups and a minimum number of exceptions Sometimes the computer may classify the groups into a larger number of clusters than the mini- mum possible number. This will be because the requirement that members of one cluster shall be fairly similar in their complementation behaviour has over-ridden the minimisation of the num- ber of clusters.
Details of the computer program. The computer selects any complementation group, X, and tries to define the cluster most likely to include X . This is done by examining the remaining groups and selecting that group, X, say, which is ‘most likely’ (the criteria used to define most likely are discussed in detail below) to lie in the same cluster as X. It is also a necessary condition that X, should not complement X . The remaining groups are then examined and X , selected, where X , is the group ‘most likely’ to lie in the same cluster as both X and X,. X , must not com- plement either of them. This process is continued until we have a series of groups X , X,, X ,
.
.. . .
X, which cannot be extended further because all the remaining mutants complement one or more of them.This collection of groups we call the X-derived pseudocluster. A pseudocluster is derived from each of the groups in the matrix in turn and the computer prints these out in a square array, the ith member of the kth row being 1 or 0 according to whether or not the pseudocluster formed by the kth group contains the ith group. Several of the pseudoclusters will be seen to be similar and so we have a rough description of the clustering structure already (see Tables 2 and 3).
The decision that one or another mutant is the ‘most likely’ extension is effected by computing scores S , . . .
. . .
S , for each group not included in the growing pseudocluster. These scores are based on the similarities between the qualitative complementation reactions of the groups being considered as extensions of the collection and groups already included. The score for a group which complements positively with one or more groups already included is zero; other groups have various positive scores depending on the degrees of similarity. The most likely group to be included in the growing pseudocluster is the group with the highest positive score; if none has positive scores the pseudocluster is complete.COMPLEMENTATION MAP CLUSTERS 331
Starting with our original P we can do several recursions. As P improves due to recursion, the value of C should be increased to emphasize r (based on P) more and more. Eventually P will
become ‘self-consistent’-that is to say, for any two groups X , and X,, if the pseudocluster founded by X , includes X , then the pseudoclusters founded by X , and by X , are identical. P now repre- sents a dissection of the complementation groups into clusters and this is the best our method can do with the data.
If too high a value of C was used before P was approximately correct, it was sometimes found that a true cluster might be dissected into subclusters giving more than the minimum number of clusters. To identify the minimum number of clusters, the series of cut-off points 0,40, 70, 85, 95 would probably be more effective than the series 0,95.
Our program, written i n Atlas algol, together with a description of how to use it is available to anyone who proposes to analyse such data i n the near future. We will send copies to any re- search worker applying to the MRC Statistical Unit for them.
Details of the scoring meihod used by the computer: (i) The scores SI . .
. . . .
S,. Let Ei be a row of zeroes and ones, the nth element of E , being 1 if the ith and the nth groups complement positively together and 0 otherwise. If we take the jth and the kth groups X , and X , and com- pare E , and E, then Ei and E , will have R positive reactions (ones) in common and N negative reactions (zeroes) in common. W e define the similarity between X , and X , to be ( N+
R ) . Ifwe are considering extensions of ( X o , X , , X ,
.
. . . X , ) then the score S calculated for the group X is 0 if X is not an admissible extension of ( X o , X , ..
. X,) and the sum of the simi- larities of X with the X i otherwise.A more general criterion was considered based on R
+
k . N . The value of k which made the scores S discriminate most powerfully between the obvious clusters in several different sets of complementation data was found, but it was so close to unity that the extra generality added nothing to the method.(ii) The scores rl
. .
. .. .
r n . Let d j be the ith column in the array of pseudoclusters P. T h e score r for the ith group is the sum of the similarities of di with the other columns (as above), multiplied by an appropriate factor to make it a percentage of what it would have been if all the things being compared had been identical. When calculating the ri, putting k = 0 and defining the similarity as R is a modification of the method which can be advantageous.An dternative method of analysis. In the beginning a more complicated method of analysis was used. In constructing a pseudocluster we do not want our next inclusion to be from a different cluster. If this happens, many of the p u p s that complement positively with either cluster will be excluded, whereas if we had chosen a group from the correct cluster it is likely that fewer restrictions on the extensibility of the pseudocluster would have been imposed. This suggested the definition of the Si which we used in the beginning.
Several groups will already be formally excluded from the growing pseudocluster because they complement positively with one or more of the groups already included in it, and any ex- tension of the cluster will in general increase the number of formally excluded groups. The group that is ‘most likely’ by this criterion to lie in that cluster is defined as that group whose inclusion would cause the least number of extra exclusions.
This criterion (extensibility) is computationally less convenient than the similarity criterion and gave practically identical results wherever it was used.
RESULTS
TABLE 1
The complementation matrix for the ad 5/7 data of COSTELLO and BEVAN (1964)
Group
number I 10 20 30 41) 4 8
000000001111111111111111111111111111111111111111 000000000111111111111111111111111111111111111111 000000000000111111111111111111111111111111111111 000000000000000111111111111111111111111111111111 000000000000000000000111111111111111111111111111 00o0o0000000000000000000000000010000000000000000 100000000000000000000000000001111100000000000000 110000000000000000000000000001111110001000000010 10
-
111000000000000000000000000000000000001011110110 1110000001000000000000000000000000000000000000010 111000000000000000000000000000000000000001000110 111100000000000000000000000000000010101111110110 111100000000000000000000000000000000001111100110 111100000000000000000000000000000000001111110110 111110000000000000000000000000000110001111110110 111110000000000000000000000000000010001111110111 111110000000000000000000000000000000101111100110 111110000000000000000000000000000000001111100110 20-
111110000000000000000000000000000000001001100110 111110000000000000000000000000000000000111000110 111111000000000000000000000000000000000001110110 111111000000000000000000000000001111111111010110 11111100000000000000000000000111000000000000000 111111000000000000000000000000001111111111111111 1111110000001000000000000000000110111001111111110 111111000000000000000000000000000010001101100110 111111000000000000000000000000001010111110110101 11111100000000000000000000000000000000111111011130
-
111111011000000000000000000000111111111111111111 111111011000000000000001010001001111111111111111 111111011000000000000001010001001111111111111111 111111011000000000000011100101110000000000000011 111111011000000100000010110001110000000000000000 111111001000100110000010111101110000000000000000 111111000000000000000010110001110000000000000000 1111110000001000001000010100101110000000000000000 111111000000000000000010100101110000000000000000 111111001100111111110010111101110000000000000000 40-
111111000000111111101010111111110000000000000000 111111000100111111101010110111110000000000000000 111111000101111111111110111011110000000000000000 111111000100111111110100111111110000000000000000 111111000100101110000110110111110000000000000000 111111000000000000000000110001110000000000000000 111111000101111111111110111111110000000000000000 111111001111111111111110111011111000000000000000 48-
111111000000000010000000100111111000000000000000I
I
I
I
1
-
00000001 11 11 11 11 11 11 11 11 11 11 1 11 11 11 11 11 11 11 11 11 1TABLE 2
The pseudoclustering matrix derived after one recursion from the ad 5/7 data of COSTELLO and BEVAN (1964)
Columns
Group occurring 3
number 1 10 20 30 40 48 or more times
1-111111000000000000000000000000000000000000000000
I
1
I
I
I
1 0 0 0 010
20
30
40
111111000000000000000000000000000000000000000000 111111000000000000000000000000000000000000000000 111111000000000000000000000000000000000000000000 111111000000000000000000000000000000000000000000 111111000000000000000000000000000000000000000000 000000100000000000000001000000000000000000000000 000000011000100111000010111110000000000000000000 000000011000100111000010111110000000000000000000 000000000111011000111100000000000000000000000000 000000000111011000111100000000000000000000000000 0000000001110110001111000000000000000000000000000 000000011000100111000010111110000000000000000000 000000000111011000111100000000000000000000000000 000000000111011000111100000000000000000000000000 000000011000100111000010111110000000000000000000 000000011000100111000010111110000000000000000000 000000011000100111000010111110000000000000000000 000000000111011000111100000000000000000000000000 000000000111011000111100000000000000000000000000 0000000001110110001111000000000000000000000000000 0000000001 1101 10001 1 1 100000000000000000000000000 000000011000100111000010111110000000000000000000 000000100000000000000001000000000000000000000000 000000011000100111000010111110000000000000000000 000000011000100111000010111110000000000000000000 000000011000100111000010111110000000000000000000 000000011000100111000010111110000000000000000000 000000011000100111000010111110000000000000000000 000000000000000000000000000001000000000000000000 000000000000000000000000000000110000000000000000 000000000000000000000000000000110000000000000000 000000000000000000000000000000001000000000000000 000000000000000000000000000000000111110000001001 000000000000000000000000000000000111110000001001 000000000000000000000000000000000111110000001001 000000000000000000000000000000000111110000001001 000000000000000000000000000000000111110000001001 000000000000000000000000000000000000001111110110 000000000000000000000000000000000000001111110110 000000000000000000000000000000000000001111110110 000000000000000000000000000000000000001111110110 000000000000000000000000000000000000001111110110
1 0 0 0 0 1 0 0 0 0 1 0 0 0 0 1 0 0 0 0 1 0 0 0 0 0 0 0 0 0 0 1 0 0 0 0 1 0 0 0 0 0 1 0 0 0 0 1 0 0 0 0 1 0 0 0 1 0 0 0 0 0 1 0 0 0 0 1 0 0 0 1 0 0 0 0 1 0 0 0 0 1 0 0 0 0 0 1 0 0 0 0 1 0 0 0 0 1 0 0 0 0 1 0 0 0 1 0 0 0 0 1 0 0 0 0 1 0 0 0 0 1 0 0 0 0 1 0 0 0 0 1 0 0 0 0 1 0 0 0 0 0 0 0 0 0 0 0 0 0 0 0 0 0 0 0 0 0 0 0 0 0 0 1 0 0 0 0 1 0 0 0 0 1 0 0 0 0 1 0 0 0 0 1 0 0 0 0 0 1 0 0 0 0 1 0 0 0 0 1 0 0 0 0 1 0 0 0 0 1 000000000000000000000000000000000000001111110110 0 0 0 0 1 000000000000000000000000000000000111110000001001 0 0 0 1 0
000000000000000000000000000000000000001111110110 0 0 0 0 1 000000000000000000000000000000000000001111110110 0 0 0 0 1 48-0000000000000000000000000000000000111110000001001 0 0 0 1 0
TABLE 3
The pseudoclustering matrix derived after two recursions from the ad 517
data of COSTELLO and BEVAN (1964)
Group
number 1 10 20 30 40 48
I
II
II
I
1-111111000000000000000000000000000000000000000000 111111000000000000000000000000000000000000000000 111111000000000000000000000000000000000000000000 111111000000000000000000000000000000000000000000 11 1 1 11 000000000000000000000000000000000000000000 1 1 11 11 000000000000000000000000000000000000000000 000000100000000000000001000000000000000000000000 000000011111111111111110111110000000000000000000 000000011111111111111110111110000000000000000000 10-000000011111111111111110111110000000000000000000
000000011111111111111110111110000000000000000000 000000011111111111111110111110000000000000000000 000000011111111111111110111110000000000000000000 000000011111111111111110111110000000000000000000 000000011111111111111110111110000000000000000000 000000011111111111111110111110000000000000000000 000000011111111111111110111110000000000000000000 000000011111111111111110111110000000000000000000 000000011111111111111110111110000000000000000000 20-000000011111111111111110111110000000000000000000
000000011111111111111110111110000000000000000000 000000011111111111111110111110000000000000000000 000000011111111111111110111110000000000000000000 000000100000000000000001000000000000000000000000 00000001111111111111l110111110000000000000000000 090000011111111111111110111110000000000000000000 000000011111111111111110111110000000000000000000 000000011111111111111110111110000000000000000000 000000011111111111111110111110000000000000000000 30-000000000000000000000000000001000000000000000000
000000000000000000000000000000110000000000000000 000000000000000000000000000000110000000000000000 000000000000000000000000000000001000000000000000 000000000000000000000000000000000l11111111111111 000000000000000000000000000000000111111111111111 000000000000000000000000000000000111111111111111 000000000000000000000000000000000111111111111111 000000000000000000000000000000000111111111111111 000000000000000000000000000000000111111111111111 40-000000000000000000000000000000000111111111111111
000000000000000000000000000000000111111111111111 000000000000000000000000000000000111111111111111 000000000000000000000000000000000111111111111111 000000000000000000000000000000000111111111111111 000000000000000000000000000000000111111111111111 000000000000000000000000000000000111111111111111 000000000000000000000000000000000111111111111111 48-000000000000000000000000000000000111111111111111
C O l U ~ S occumng
three or more times
1 0 0
1 0 0 1 0 0 1 0 0 1 0 0 1 0 0 0 0 0 0 1 0 0 1 0 0 1 0 0 1 0 0 1 0 0 1 0 0 1 0 0 1 0 0 1 0
0 1 0 0 1 0 0 1 0
0 1 0
0 1 0
0 1 0
0 1 0 0 0 0
0 1 0
0 1 0 0 1 0 0 1 0 0 1 0 0 0 0
0 0 0
0 0 0 0 0 0 0 0 1 0 0 1 0 0 1
0 0 1 0 0 1 0 0 1 0 0 1 0 0 1 0 0 1 0 0 1 0 0 1 0 0 1 0 0 1 0 0 1 0 0 1
COMPLEMENTATION M A P CLUSTERS 335
LIE 1966, 1968). Since clustering at the Zeu-2 locus is comparatively straight
forward, this was not considered to be a very rigorous test of the method.
The method has also been used to analyse four other sets of data: these are de- scribed below.
T h e ad-5/7 locus in Saccharomyces cerevisiae: data of COSTELLO and BEVAN (1964): The method of analysis is best illustrated using the results from this locus. The results for other loci will be presented in summary form only.
The original complementation matrix for the ad-5/7 data is presented in Table 1. The first analysis gave a non-self-consistent pseudoclustering matrix. A recur- sion on this first pseudoclustering matrix, using cut-off point C = 85, produced a second pseudoclustering matrix (Table 2) which was self-consistent and in which all except six groups were placed in one of five clusters. However, a different re- sult was obtained when another recursion on the first pseudoclustering matrix using C = 0, then C = 70 produced a self-consistent matrix (Table 3) with three clusters and four exceptions. I n Tables 2 and 3 clusters may be identified by clas- sifying the columns of the matrix; if a column occurs more than once or twice, then the groups which are represented by those columns fall into the same cluster. At first sight, the computer analysis of this locus has produced two different results showing that the matrix consists of three o r five clusters. Further analysis shows that both these results are reasonable and consistent with each other.
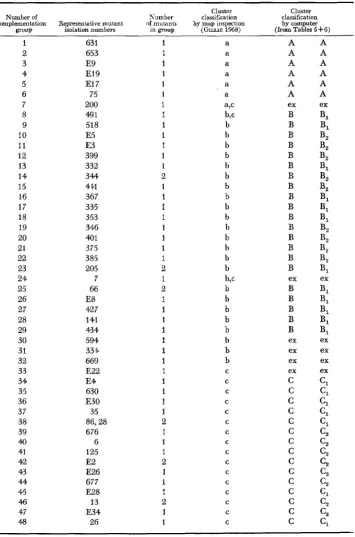
The results of the three and five cluster analyses have been compared group by group in Table 4. This shows (last two columns of Table 4) that clusters B and C
of the three cluster analysis have been sub-divided into ‘sub-clusters’ B,, B,, and C,, C? in the five cluster analysis. It is more clear how this can occur when we examine the interaction of clusters one with another.
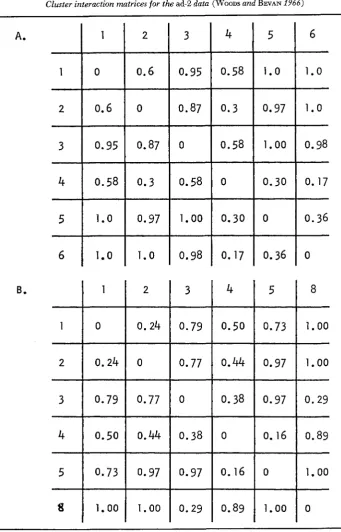
Table 5 shows what we have called the cluster interaction matrix. Each entry in this matrix represents the estimated probability, calculated directly from the complementation matrix, that complementation will occur between any two mutants selected at random from the corresponding clusters. The cluster inter- action matrix must have a row of zeroes down the diagonal, since mutants in the same cluster show no complementation amongst themselves. Zeroes which ap- pear in other parts of the matrix show that these clusters are similar and may be fu;ed. In Table 5b the cluster interaction matrix of the five cluster analysis shows zeroes which are not on the diagonal. I n fact the matrix in Table 5b can be re- duced by fusing clusters (or ‘subclusters’) B , and B, and C , with C, to give the thrce cluster matrix as in Table 5a. The matrix in 5b can also, however, be re- duced by fusing subclusters B , and C, to give a four cluster matrix. We can see, therefore, that the analysis of the matrix into five clusters is not by means of an arbitrary division of clusters B and C into subcluster;, but rather the division of
these clusters into subclusters on the basis of their interaction with each other. Comparison of the cluster analysis made by computer with that made pre- viously by inspection of the map ( GILLIE 1968) shows that the two analyses are in substantial agreement, i.e. they are about 90 percent mutually consistent.
TABLE 4
Comparison of cluster classification by the inspection method and by the computer method for ad 5/7 (COSTELLO and BEVAN 1964)
Cluster Cluster Number of Number classification classification complementation Representative mutant of mutants by map inspection by computer
GOUP isolation numbers i n group (GILLIE 1968) (from Tables 5 + 6 )
1 63 1 1 a A
COMPLEMENTATION MAP CLUSTERS
TABLE 5
Cluster interaction matrices for the ad 5/7 data of COSTELLO and BEVAN (1964)
(a) A B C
A 0 .76 1.0
B .76 0 .48
C 1
.o
.48 0(b) A Bl B2 Cl c2
A 0 3 1 .70 1
.o
1.o
Bl .81 0 0 .38 .78
B, .70 0 0 0 .67
Cl 1
.o
.38 0 0 0c2
1.0 .78 .67 0 0Two cluster interaction matrices are given. One for the three cluster analysis (Table 2) and another for the five cluster analysis (Table 3). Each entry in the matrix represents the estimated probability that complementation will occur between any two mutants selected at random from the corresponding clusters.
gated by
DORFMAN
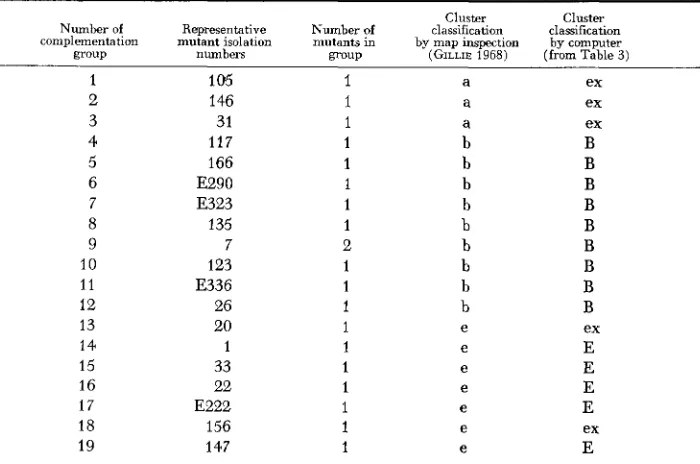
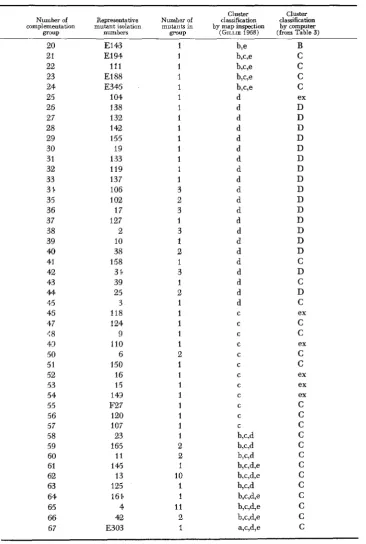
using independently induced mutants. Our analysis into clusters using the computer method was 85 percent consistent with results ob- tainecf previously by inspection of the map (see Table 6 ) . Four clusters andTABLE 6
Comparison of cluster classification b y the inspection method and by the computer method for ad 5/7 (DORFMAN 1964)
Cluster Cluster Number of Representative Number of classification classification complementation mutant isolation mutants in by map inspection by computer group numbers group (GILLIE 1968) (from Table 3)
1 2 3 4 5 6 7 8 9 10 11 12 13 14 15 16 1 7 18 19
338 0. J. GILLIE A N D R. PET0
TABLE G(Continued)
Cluster Cluster
Number of Representative Number of classification classification
complementation mutant isolation mutants in by map inspection by computer
group numbers group (GILLIE 1968) (from Table 3)
COMPLEMENTATION M A P CLUSTERS 339
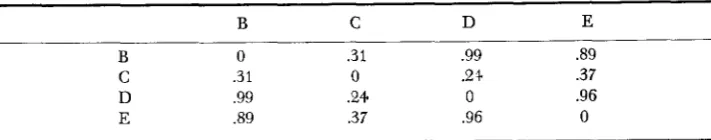
TABLE 7
Cluster interaction matrix for the ad 5/7 data (DORFMAN 1964)
B C D E
B 0 .31 .99 3 9
C .31 0 .2 4 .37
D .99 .24 0 .96
E .89 .37 .96 0
Each entry in the matrix represents the estimated probability that complementation will occur between any two mutants selected at random from the corresponding clusters.
eleven exceptions were identified. DORFMAN’S original matrix contained some blanks (unknown results) ; these were excluded by the computer when similarities for the groups concerned were calculated, but otherwise did not affect the method
of analysis.
The computer analysis divided the matrix into four clusters, which were very similar to clusters c, d, b, e identified in the previous analysis made by inspection of the map. One of the clusters identified previously by inspection ( a ) , which formed the ‘tail’ of the DORFMAN map was represented by three exceptional groups in this analysis. One of these three groups complements the other two and so ac- cording to our strict rules cannot be included in a cluster with the other two. The cluster interaction matrix for this locus is shown in Table 7.
The His-B locus
in
Salmonella typhimurium: data ofLOPER
et al. (1964): Unfortunately, the original complementation matrix was not available to work from for this locus and we had to reconstruct the matrix from the map and notes published by LOPER et al. (1964). On analysis we found four clusters with eight exceptions (see Table 8) in the data for this locus. The division into clusters pro- duced by this analysis was essentially the same as the division into four ‘basic complementation groups’ made by LOPER et al. (1964), and identical with the division into clusters made by inspection (GILLIE 1968). The cluster interaction matrix for this locus is given in Table 9.The ad-2 locus in Saccharomyces cerevisiae: data of
WOODS
and BEVAN (1966): The ad-2 data of WOODS andBEVAN
(1966) presented difficulties which we did not encounter in analysing data at the other loci. Five analyses were made using various procedures and were all in agreement in identifying at least five main clusters, but there was a good deal of variation with respect to certain groups which could be assigned to one cluster or another in a fairly arbitrary way. Thead-2 data were also difficult to analyse by map construction, there being numerous exceptional interactions which could not easily be fitted into the map. However, comparison of the previous manual analysis into clusters based on the map (GIL-
340 0. J. GILLIE A N D R. PET0
TABLE 8
List of clusters identified ut the His-B locus of Salmonella typhimurium (datu of LOPER et al. 1964)
A B C D
380 143 (4) 612 641
167 65 (3) 902 53
488 241 391 (2) 923
138 289 20 4.56 (2)
243 480 569 374 (3)
669 (2) 542 482 206
234 578 118 61
262 40 (4) 12 (3) 590
5 62 257 79 . . .
136 217 369 . . .
286 . . . . . . . .
865 . . . . . . . .
355 . . . . . . . . .
59 . . . . . . . . . 328 . . . . . . . . .
656 . . . . . . . . . 812 . . . . . . . . . 429 . . . . . . . Exceptions: 353, 116,56,821., 662,425,573,470
The complementation groups comprising each cluster are designated by the isolation number
of one of the mutants comprising the p u p . The number in parentheses represents the number of
mutants per group when this exceeds one. Exceptional mutants which cannot be placed in
clusters are listed separately.
TABLE 9
Cluster interaction matrix for the His-B locus of Salmonella typhimurium (LOPER et al. 1964)
COMPLEMENTATION MAP CLUSTERS
TABLE 10
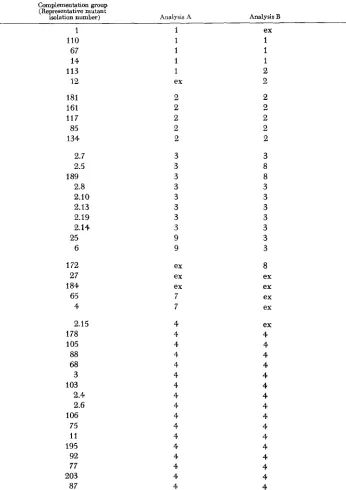
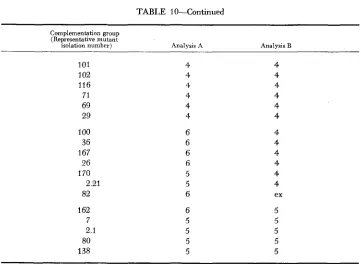
Cluster membership assigned to the ad-2 mutunts of Saccharomyces cerevkiae ( W O O ~ S and BEVAN 1966) in two analyses
341
Complementation group (Representative mutant
isolation number) Analysis A Analysis B
1 1 ex
110 1 1
67 1 1
14 1 1
113 1 2
12 ex 2
181 2 2
161 2 2
117 2 2
85 2 2
134 2 2
2.7 3 3
2.5 3 8
189 3 8
2.8 3 3
2.10 3 3
2.13 3 3
2.19 3 3
2.14 3 3
25 9 3
6 9 3
172 ex 8
27 ex ex
184 ex ex
65 7 ex
4 7 ex
2.15 4 ex
178 4 4
105 4 4
88 4 4
68 4 4
3 4 4
103 4 4
2.4 4 4
2.6 4 4
106 4 4
75 4 4
11 4 4
195 4 4
92 4 4
77 4 4
203 4 4
342 0. J. GILLIE A N D R . PET0 TABLE 1 &Continued
~ ~
Complementation group (Representative mutant
isolation number) Analysis A Analysis B
101
1 02 116 71 69 29
100
36 167
26 170
82
162
7
2.1 80 138
2.21
4 4 4 4 4 4
6 6 6 6
5 5
6 6 5
5 5
5
4
4 4 4
4
4 4 4
4
4 4 4 ex
5 5 5
5 5
Analysis A was performed taking all complementation reactions (weak and strong) as positive and analysis B was performed taking strong complementation reactions as positive. Mutants hav- ing the same number in analyses A or B fell in corresponding clusters.
WOODS
and BEVAN 1966) were considered as negative reactions. These two analy- ses are in 70 percent agreement (43 agreements and 18 disagreements) over the sssiqnment of groups to clusters.Compar;ng these two analyses in more detail, it can be seen that the ten mu- tants involved in cluster 3 produce four of the disagreements. These ten mutants react similarly with all other mutants and are mutually noncomplementing with the exception of two pairs of mutants (pair 2.5 and 189, and pair 25 and 6) which do show complementation between themselves. These two pairs cannot lie in the same cluster and either pair may be arbitrarily excluded by the computer. This may be a case where strict adoption of the rule that no complementation may oc- cur between members of a cluster is unrealistic.
Both analyses (Table 10) agree in forming a large cluster 4, but analysis
B
in- cludes some extra groups in cluster 4 which analysis A places in clusters 5 and 6. Eight disagreements between the two analyses are a result of this. Distinct clusters would not always be expected to occur on the CRICK-ORGEL hypothesis. If for ex- ample an ‘intersection’ of the polypeptide with the axis of symmetry is rather large, as would be the case if the polypeptide chain ran almost parallel to theaxis of symmetry for some distance, then mutants at one end of the ‘intersection’ could complement positively with mutants in the middle or at the far end and
TABLE 11
Cluster interaction matrices for the ad-2 data (WOODS and BEVAN 1966)
0
0.6
0.95
0.58
1.0
1.0
0.6
0
0.87
0.3
0.97
1.0
4
5
6
-
1.0
-
1.0
-
0.98
-
0.
17
-
0.36
-
0
8
A.
7
1
-
3
0.95
0.87
0.58 1.0
0.3 0.97 2
-
0.58 1.00
0
-
0.58
-
1.00
-
0.98
3
-
4
00.30
5
0.30 00.36
6
0.173
4
1
5
B.
I 1
2I
0.24 0.79 0.50 0.73 1.00
0.44
0 0.77 0.97 1.00
0.77 0 0.38 0.97
-
0.16
0.29
-
0.89
-
1.00
-
0
0.44
4
I
0.50 0.38 00.97 0.16
0.97
0
1.00 1.00 0.29 0.89
Matrix A is derived from analysis of the complete data (see Table 10, column A) and matrix
B is derived from an analysis in which weak interactions are omitted (see Table 10, column B ) .
344 0. J. GILLIE A N D R. PET0
TABLE 12
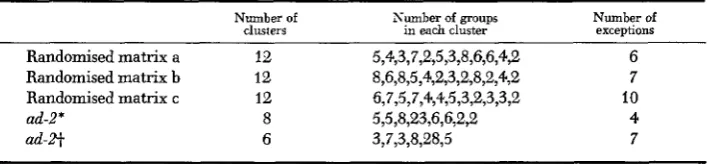
Analysis of three different randomised matrices of the same dimensions as ad-2 (61 groups) containing the same frequency of positive and negative test results
Number of clusters
Randomised matrix a 12
Randomised matrix b 12 Randomised matrix c 12
ad-2* 8
a d - a 6
Number of exceptions
6
7
10 4
7
* Using all complementation reactions, results from Table IOA.
t
Using good complementation response only, results from 1OB.(Table 11) and the fact that cluster 6 is absorbed into clusters
4
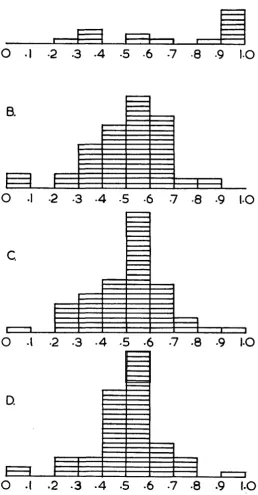
and 5 when weak interactions are ignored, is consistent with this hypothesis.Since the ad-2 map has a comparatively large number of not-so-well defined clusters the question may well be asked whether this amount of clustering might not be obtained if an absolutely random matrix of the same size and with the same frequency of positive and negative tests were subjected to our procedure. We have done this (see Table 12) and found that in three different trials of this kind, 12 clusters were always found with from 6 to 10 ‘exceptional groups’ which could not be placed in clusters. This result is quite different from the result ob- tained for the ad-2 data proper ( s e e Table 12). However, a further difference was revealed when the estimated probabilities in the cluster interaction matrices were examined. These are the probabilities that complementation will occur between any two mutants selected at random from specified clusters. The frequency dis- tribution for the probabilities from the ad-2 data proper was skewed with more than half of the probabilities greater than 0.8, whereas the probabilities for the random data appeared symmetrically distributed about the mode which was be- tween 0.5 and 0.6 (see Figure l ) . This asymmetrical distribution of probabilities, together with the smaller number of clusters than are found in analyses of ran- domised matrices show that we have detected real structure in the ad-2 matrix.
DISCUSSION
A computer program has been developed for sorting mutants into clusters of mutually noncomplementing mutants on the basis of their qualitative comple- mentation behaviour. This program can analyse batches of up to 270 groups of mutants at a time on Atlas, although this upper limit will vary from computer to computer.
A.
6.
C.
0
.I
.2 .3
.4
.5
.6
-7
.8 -9
1.0
D.
m
m
FIGURE 1 .-The frequency distribution of cluster interaction probabilities for clusters a t the ad-2 locus (Distribution A) and for clusters from three comparable random trials. (Distributions
346 0. J. GILLIE A N D R. PET0
complementation map. (b) Tables may be drawn up showing the estimated prob- ability of a mutant chozen at random from one cluster complementing positively with one chosen at random from another cluster, and these estimated probabilities can be studied (see Tables
5,
7, 9 and 11). These tables are called the cluster interaction matrices.The diagonal elements in the cluster interaction matrix are necessarily zero, since cluster members do not complement positively with each other. If we as- sume that the clusters we produce correspond to damage at particular sites, then zeroes or low probabilities not on the diagonal indicate that the sites of damage defining the two clusters concerned are fairly closely related in the protein mono- mer; whereas high probabilities close to 1.0 indicate that the sites of damage are distant from one another; intermediate percentages indicate intermediate degrees of relatedness. It was particularly interesting that these probabilities were found to be skewed for the ad-2 data when compared with the probabilities obtained from analysis of comparable random matrices.
In map-making the question of which mutants are to be called exceptions is more subjective than in the computer classification into clusters, and the outcome of the choice affects the final results more strongly. The exceptions that we find to the clustering structure may have their own individual entries in the inter- action probability table, representing the probabilities of positive complementa- tion between them and the various clusters. If the data are represented as a map, exceptions may be omitted from the map entirely, or may be included in the map with certain of their reactions ignored, or they may be included properly in the map, in which case they alter the large-scale features of the map substantially. For very complex data, for instance ad-2, the interaction probability table is more comprehensible and more accurate than the map, but it cannot tell us if two clusters interact as at the Zeu-2 locus to form a circular rather than a linear map. However, the value of the two different methods will be assessable only later when physico-chemical methods of analysis have been applied to complementing pro- teins. It may then be possible to answer the following two questions: 1. DO the clusters suggested both by the computer and by the maps consist of mutants at particular intersections of the protein monomer with the axes of symmetry of the multimer? 2.
Do
the interactions between different clusters, as represented on the complementation map, best describe the interconnections of the polypeptide chain in the protein monomer, or are these interconnections better described by the figures in the cluster interaction matrix?Although it may be some time before these questions can be answered, we be- lieve that our method provides a cheap and objective means of analysing com- plementation data and so of comparing mutational defects ,at what we might call the functional level.
We should like to acknowledge the interest and encouragement of Dr. DAVID MANNION.
SUMMARY
COMPLEMENTATION MAP CLUSTERS 347
reacting mutants from complementation data. This has been applied to five sets of data from four loci; the leu-2 locus of Neurospora crassa, the
ad-5/7
and ad-2loci of Saccharomyces cerevisiae and the His-B locus of Salmnella typhimurium. I t was found possible in each case to divide the mutants up into a small number of mutually noncomplementing clusters of mutants (or complementation groups) and to study the interaction of these clusters. In the case of the ad-2 data a com- parison was made with analyses of randomised matrices showing that the ad-2 data were nonrandom. The assignment of complementation groups to clusters by the computer method gave similar but not identical results to those obtained pre- viously by simple inspection. The reasons for differences between the different methods are discussed.
LITERATURE CITED
CODDINGTON, A. and J. R. S. FINCHAM, 1965 Proof of hybrid enzyme formation in a case of inter-allelic complementation in Neurospora crassa. J. Mol. Biol. 12 : 152-161.
CODDINGTON, A., J. R. S. FINCHAM and T. K. SUNDARAM, 1966 Multiple active varieties of Neurospora glutamate dehydrogenase formed by hybridisation between two inactive mutant proteins in vivo and in vitro. J. Mol. Biol. 17: 503-512.
COSTELLO, W. P. and E. A. BEVAN, 1964 Complementation between ad 5/7 alleles in yeast. Genetics 5 0 : 1219-1230.
CRICK, F. H. C. and L. E. ORGEL, 1964 The theory of interallelic complementation. J. Mol. Biol. 8 : 161-165.
DORFMAN, B., 1964 Allelic complementation at the ad 5/7 locus in yeast. Genetics 50: 1231- 1243.
FINCHAM, J. R. S., 1966 GILLIE, 0. J., 1966
Genetic Complementation. Benjamin, New York.
The interpretation of complementation data. Genet. Res. 8 : 9-31.
-
Interpretations of some large non-linear complementation maps. Genetics 58: 543-GROSS, S. R., 1962 On the mechanism of complementation at the leu-2 locus of Neurospora.
LOPER, I. C., M. GRABNER, R. C. STAHL, Z. HARTMAN and P. E. HARTMAN, 1964. Genes and pro-
SCHLESINGER, M. J. and C. LEVINTHAL, 1963 Hybrid protein formation of E. coli alkaline phos-
WOODS, R. A. and E. A. BEVAN, 1966 Interallelic complementation of the ad-2 locus of Sac- 1968
555.
Proc. Natl. Acad. Sci. U.S. 48: 922-930.
teins involved in histidine synthesis i n Salmonella. Brookhaven Symp. Biol. 17: 15-52.
phatase leading to in vitro complementation. J. Mol. Biol. 7 : 1-12.