ABSTRACT
HUANG, YIJIAN. The Use of High-density Single Nucleotide Polymorphism Panels in Hereford Beef Cattle: Genotype Reconstruction and Identification of Genome Patterns Related to Selection. (Under the direction of Joseph P. Cassady and Christian Maltecca).
The overall objective of this study was to apply single nucleotide polymorphism panels on Hereford beef cattle to reconstruct genotypes and identify genome patterns related to selection. Individuals were sampled from a closed population known as the Line 1
pedigree or SNPs resulted in a 30.44 or 23.19% increase in imputation accuracy,
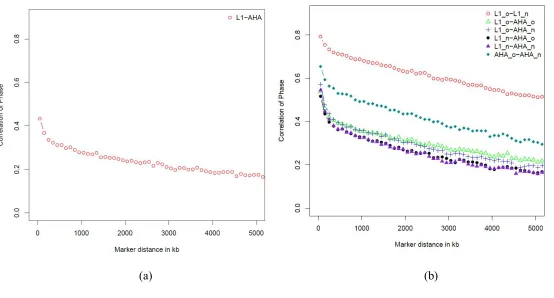
respectively. Based on SNP genotypes, genome patterns of L1 and AHA were also identified. Linkage disequilibrium within breed indicated that non-random association between SNPs was higher in L1 than that in AHA. Correlations of LD across breeds confirmed the recent divergence of these two populations. Fixation index (Fst) estimated with all SNPs was 0.08, revealing small general divergence between these two populations. However, strong local divergence signals were detected in some regions of the genome using Fst estimated by non-overlapping sliding windows of six SNPs. Window heterozygosity (Hw) was calculated for L1, AHA and a combination of both to reveal genome regions that approached fixation or conversely had high percentage of heterozygotes. The lowest 2.5% Hw values were 0.05, 0.12 and 0.10, while the highest 2.5% Hw values were 0.45, 0.44 and 0.43, respectively. Putative directional selection signatures were detected in genome regions of low Hw found in all three groups of samples. Low Hw regions co-located with quantitative trait loci (QTL) for growth traits. If SNPs of interest are less than 20 SNPs apart they were clustered into single regions. Low Hw regions only found on L1 may reflect fixation driven by random drift effects. High Hw would suggest stabilizing selection and high Hw regions co-located with QTL related to fitness support this hypothesis. Furthermore, SNP genotypes were regressed on cumulative selection differentials (CSD) for postweaning gain in L1. When CSD
60 significant SNPs (FDR < 0.20). Of these, three regions co-located with QTL for
The Use of High-density Single Nucleotide Polymorphism Panels in Hereford Beef Cattle: Genotype Reconstruction and Identification of Genome Patterns Related to Selection
by Yijian Huang
A dissertation submitted to the Graduate Faculty of North Carolina State University
in partial fulfillment of the requirements for the degree of
Doctor of Philosophy
Animal Science, Poultry Science and Functional Genomics Raleigh, North Carolina
2012 APPROVED BY:
_______________________________ ______________________________
Joseph P. Cassady Christian Maltecca
Chair of Advisory Committee Co-chair of Advisory Committee
________________________________ ________________________________
Michael D. MacNeil Alison A. Motsinger-Reif Minor Representative
DEDICATION
BIOGRAPHY
ACKNOWLEDGMENTS
I would first like to thank Dr. Joseph Cassady and Dr. Christian Maltecca for being great mentors and friends. Thank you for showing me the breeds of cattle and pigs, for initiating the research projects, for proofreading my writing, for spending endless hours helping me with data analysis, for encouraging me to be a good communicator and for countless one-on-one help in the farm and in the office. Your passion for research inspired me to challenge myself in all aspects.
I would like to thank Dr. Michael MacNeil, Dr. Eugene Eisen and Dr. Alison Motsinger-Reif for being my committee members. I would like to thank researchers in Fort Keogh Livestock and Range Research Laboratory (LARRL), Miles City, Montana for their great support in experimental designs, data collection and data analysis. A whole list of them can be found in http://www.ars.usda.gov/Main/docs.htm?docid=3087. This project could not have been finished without the help from USDA-ARS scientists including Vicki Leesburg, Dr. Lee Alexander and Dr. Warren Snelling.
I would like to thank numerous people in the research team of North Carolina State University. A complete list of students and technicians who worked with me between 2007 and 2011 can be found in these web sites: http://www4.ncsu.edu/~jpcassad/index.html, http://www4.ncsu.edu/~cmaltec/index.html. Especially I would like to thank graduate
students Dr. Kent Gray, Kristen Gaddis, Jessica Spake and Jocelyn Bishop for sharing offices with me, taking courses with me and working out statistical problems with me. I thank
on the right track. Thanks to my friend Jingjing Li for her help along the way. Thank you all for making my graduate school experience enjoyable.
TABLE OF CONTENTS
LIST OF TABLES………....ix
LIST OF FIGURES………..….x
Chapter 1 ...1
Literature Review ...1
INTRODUCTION ...2
The Hereford breed and Line 1 ...2
Line 1 and bovine genomics...3
Genotype Reconstruction ...4
Identification of genomic patterns related to selection ...7
CONCLUSION ... 17
Chapter 1 ... 17
Chapter 2 ... 18
Chapter 3 ... 18
Chapter 4 ... 18
LITERATURE CITED ... 19
Chapter 2 ... 30
Effects of reduced panel, reference origin, and genetic relationship on reconstruction of genotypes in Hereford cattle ... 30
ABSTRACT ... 31
INTRODUCTION ... 33
MATERIALS AND METHODS ... 34
Data ... 34
Reduced panel design and cost ... 35
Design of genotyping schemes ... 36
Fixed study sample ... 37
Randomly split within population ... 38
Fixed reference individuals ... 38
Molecular relationship ... 39
Statistical analysis... 41
RESULTS AND DISCUSSION ... 42
Effects on imputation accuracy ... 42
Reduced panels ... 42
Reference origin ... 44
Reference sample size ... 45
Relationship between reference and study samples ... 46
Comparisons of imputation error under different genotyping schemes ... 48
Comparisons of genotyping cost of different genotyping schemes... 51
Imputation ... 52
CONCLUSIONS ... 53
LITERATURE CITED ... 55
Chapter 3 ... 65
Using 50K single nucleotide polymorphisms to search for genome patterns related to selection in Hereford beef cattle ... 65
ABSTRACT ... 66
INTRODUCTION ... 68
MATERIALS AND METHODS ... 70
Animals ... 70
Genotypes ... 71
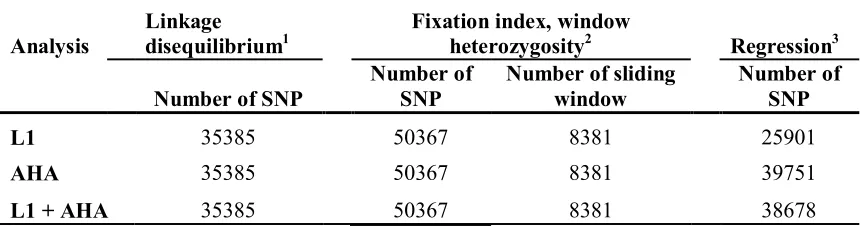
Linkage disequilibrium and persistence of phase ... 72
Six SNPs sliding window ... 73
Fixation index ... 73
Window heterozygosity ... 74
Regression of SNP frequency on cumulative selection differential ... 74
Heterozygosity and inbreeding ... 75
RESULTS AND DISCUSSIONS ... 77
Populations’ characterization ... 77
Linkage disequilibrium and persistence of phase ... 78
Fixation index ... 81
Window Heterozygosity ... 82
Heterozygosity and inbreeding effect on postweaing gain ... 88
Combined evidence ... 89
CONCLUSION ... 91
LITERATURE CITED ... 93
Chapter 4 ... 117
LIST OF TABLES
LIST OF FIGURES
Figure 2.1 Least Square Mean of correlation of imputed and real genotypes under genotyping
scheme model and genotyping cost for genotyping schemes...63
Figure 3.1 Linkage disequilibrium of SNPs...102
Figure 3.2 Persistent of phase………...103
Figure 3.3 Chromosome-wide linkage disequilibrium for L1 and AHA………104
Figure 3.4 Fixation index and window heterozygosity of 8,381 sliding windows………...105
Figure 3.5 Density plot of window Heterozygosity using 8,381 sliding windows constructed with L1, AHA and a combination of both……….107
Chapter 1
INTRODUCTION
The Hereford breed and Line 1
Hereford beef cattle were imported to the United States from England in the early 19th century (Sweet, 1975). They became popular for their adaption to a wide range of
environments, longevity, soundness, early maturity and good milking ability. In 2010 the American Hereford association reported 100,000 registered purebred Hereford females; however, crossbreeding is the main use of the breed, with Hereford and Angus crosses being among the most popular crossbred females in the United States.
Due to their popularity over the years, scientists have often utilized the Hereford breed in research experiments. A selection program on Hereford beef cattle, known as Line 1 Hereford, was founded in 1926 in Fort Keogh Livestock and Range Research Laboratory (LARRL), Miles City, Montana. Initially, a Hereford population was established using two paternal half-sib bulls and 50 cows for the purpose of developing line breeding experiments (MacNeil, 2009). By 1957, a total of 14 inbred lines of Hereford were established. The Line 1 Hereford is the only line that is still maintained. All other lines were culled due to limited resources or growth problems (http://www.ars.usda.gov/Research/docs.htm?docid=4700). For 76 years, the Line 1 Hereford population has been selected mainly for growth up to one year of age, making Line 1 arguably the longest running selection experiment in beef cattle.
emphasis concentrated on growth traits, genetic analyses have also been conducted on reproductive and functional traits such as calving date, scrotal circumference, semen
characteristics, milk production, udder conformation and energy requirements (Kealey et al., 2006, MacNeil and Mott, 2000, 2006, MacNeil and Newman, 1994).
Line 1 Herefords have a deep influence on the current U.S. Hereford population because they have been publically available for purchase. As a result, in 1984, 57% of the bulls listed in the American Hereford Association Sire evaluation were of predominately Line 1 ancestry (Dickenson, 1984) and as of 2010, 81% of the Hereford population in the U.S. could be traced to Line 1 via pedigree (Vicki Leesburg, personal communication).
Line 1 and bovine genomics
Illumina platform enables large scale genetic and genomic studies in different breeds of cattle. Its applications include estimates of genetic distances of cattle breeds (Decker et al., 2009, Gibbs et al., 2009), estimates of breed composition (Kuehn et al., 2011), genome-wide association studies (Kim et al., 2011, Snelling et al., 2010, Uemoto et al., 2011),
identification of selection signature (Barendse et al., 2009, Chan et al., 2010, Stella et al., 2010), estimates of inbreeding coefficients (Keller et al., 2011, VanRaden et al., 2011), and prediction of genomic breeding values (VanRaden et al., 2009).
Genotype Reconstruction
The iterative peeling method is based on the idea that probabilities of possible genotypes of an individual with no marker data are theoretically dependent on all marker data in the pedigree (Elston and Stewart, 1971). The iterative peeling method was extended to livestock pedigrees based on recursive relationships among probabilities of genotypes of an individual (Fernandez et al., 2001, Smith et al., 2003, Thallman et al., 2001a, b). Applications of it can be found in association studies in livestock species (Allan et al., 2009, McKay et al., 2007). However, iterative peeling becomes computationally inefficient for large, looped pedigrees with a large number of markers (Gengler et al., 2007).
Markov chain Monte Carlo algorithms use hidden Markov models to calculate the probabilities of the true underlying genotypes given the observed markers. In large complex pedigrees, this method has a high rate of success when at least half of the animals are genotyped on a single maker (Szydlowski and Gengler, 2008). Similar to iterative peeling, most MCMC methods are computationally intensive (Gengler et al., 2007).
In linkage disequilibrium (LD) based imputation, haplotypes are first constructed using all known genotypes. Then haplotypes are sampled based on known genotypes on the reduced panel. These two steps are performed iteratively to predict missing genotypes. With high-density SNP panels, haplotypes can be accurately estimated due to high LD, the non-random association among SNPs. By exploiting population LD, imputation performed on software such as IMPUTE (Howie et al., 2009) and fastPHASE (Servin and Stephens, 2007) can reach high accuracy (Weigel et al., 2010b). Furthermore, by including pedigree
information in the imputation process, missing genotypes can be first estimated following Mendelian segregation. Then, linkage between parents and offspring can be utilized to
construct phased haplotypes in offspring (Druet and Georges, 2010). In the process, surrogate relatives can also be created to increase the accuracy of phasing (Hickey et al., 2011, Kong et al., 2008).
Imputation accuracy is affected by genetic relationships among animals. Differences in genetic background between fully and sparsely genotyped and imputed candidates affect accuracy of imputation (Druet et al., 2010; Huang et al., 2009). Weigel and colleagues
non-homogenous, albeit related groups, affects imputation performance remains to be investigated.
Imputation can also be affected by the properties of the reduced chips, including marker density and information content. Imputation accuracy relies on SNP haplotyping, which is identifying the combinations of alleles that are transmitted together. Reduced chips have fewer SNPs and larger spacing between adjacent SNPs. Haplotyping errors are more likely to occur with reduced chips. Therefore, reduced chips are less likely to capture recombination sites between SNPs. In addition, polymorphic SNPs are required to construct informative haplotypes in reduced panels, so common haplotypes can be identified among fully and sparsely genotyped individuals (Druet and Georges, 2010). Since minor allele frequencies differ among populations (Gibbs et al., 2009), customized chips designed based on population specific MAF may increase the accuracy of imputation.
Line 1 and the general U.S. Hereford population provide a case study to investigate the importance of genetic connectedness of individuals in genotype reconstruction and the identification of cost effective genotyping strategies. They also provide valuable input on the usefulness of customized SNP chips for genotype reconstruction of specific populations.
Identification of genomic patterns related to selection
process have likely been different in the two populations. Natural selection causes adaptive evolution in response to environmental and other factors combined with reproductive isolation (Clutton-Brock, 1999). The key concept of natural selection is fitness (Darwin and Endersby, 2009). Evidence of natural selection has been detected in molecular markers that are involved in fitness-related traits using cattle samples (Freeman et al., 2008, Lynn et al., 2005). The Line 1 Herefords included in this experiment were maintained at LARRL, and specific information is available on the annual temperature and weather patterns for that location. However, the general Hereford population is made up of animals sampled
throughout the U.S.. Thus, the general Hereford population has been subject to a variety of environments. It can be assumed that the Line 1 Hereford is adapted to the environment of northern plains; however, the general Hereford population is a complex mixture of
from these frequencies) between the two groups may partially reflect the different selective history of the two populations. Because the end product of selection is a shift in allele frequencies, molecular markers obtained from L1 individuals and a random sample of the remaining Hereford population could be employed to reveal different selection patterns in the two populations, resulting from different selection pressures and/or targets.
While natural and artificial selection describe two different sources of selection pressure, positive, purifying, stabilizing and disruptive selection describe the effects of selection on gene frequencies (Falconer and Mackay, 1996, Hurst, 2009). Positive selection increases frequencies of the favorable alleles. Purifying selection, also known as negative selection, eliminates deleterious mutations (Charlesworth, 2010). Under positive or purifying selection, fixation of an allele may be observed after several generations. In a study of
selection can be examined by using allele and genotype frequency changes that reflect decreased genetic variance, which is unlikely to be uniformly distributed across the genome. Because selection is trait-dependent and locus-specific, by observing regions of the genome that reached fixation or are maintained at higher than expected heterozygosity, a putative selection footprint could be identified.
The relationship between selection and genotype can be complicated due to
hitchhiking effects. Genetic hitchhiking describes changes in allele frequencies at loci which are not due to direct selection, but rather due to selection of linked loci (Charlesworth, 2010). These loci have their allelic frequency changed because they are in LD with selected loci. Linkage disequilibrium erodes as recombination rate among loci increases (Charlesworth, 2010). Therefore, in genetics studies, LD is an important effect that needs to be taken into consideration.
communication). Sustained genetic improvement has been observed for postweaning gain in Line 1 (MacNeil, 2009), and a large cross-section of the historical L1 population has been genotyped with SNP marker panels, making L1 a good candidate to investigate the effect of artificial selection.
Selection takes place in populations of finite size. Mating of populations under selection often results in increased inbreeding. Inbreeding refers to the probability of alleles being identical by descent (IBD) (Wright, 1921). Measures of expected inbreeding can be obtained from pedigree data (Kempthorne, 1969). Inbreeding has long been investigated in its relation to production depression, fitness decrease and conversely, in connection with the expression and exploitation of heterosis. Inbreeding acts by decreasing the population mean of a trait if this trait has dominance components (Falconer and Mackay, 1996). Negative effects of inbreeding have been reported in growth, survival, meat production and
reproductive traits in beef cattle (MacNeil et al., 1989, Mc Parland et al., 2008). Using a large Hereford pedigree, it was estimated that the average inbreeding coefficient for U.S. Hereford cattle was 0.098 in 2001 (Cleveland et al., 2005). The designed breeding scheme in Line 1 Hereford population involves mating 7.0 ± 3.1 bulls each to 16.3 ± 5.6 cows for the purpose of progeny testing. As a closed population, Line 1 had an average inbreeding coefficient of over 0.19 in 2008. In Line 1, increased inbreeding was associated with decreased birth weight, weaning weight, growth to one year of age and pregnancy rate (MacNeil, 2009, MacNeil et al., 1992). Estimates of inbreeding coefficients are usually obtained using pedigree information under the assumption that animals without records on parents are unrelated. Given that this assumption is not tenable, inbreeding coefficients estimated by pedigree are affected by the depth and accuracy of the pedigree information.
Alternatively, inbreeding coefficients can be obtained from estimates of
tendency of reverting back to the origin (Falconer and Mackay, 1996). Because Inbreeding affects heterozygosity, the increase of inbreeding is correlated to heterozygosity under probability theory (Falconer and Mackay, 1996). The percentage of homozygosity (Hom) of an individual can be described as a combination of IBD and identical by state (IBS) alleles. Conversely, the percentage of heterozygosity (Het) can be estimated as 1 minus Hom. In a population originally in Hardy-Weinberg equilibrium (HWE), without mutation, migration or selection, continued inbreeding practice will not change allele frequencies but will decrease Het so that this last measure could be indicative of the number of generations of inbreeding (Crow, 1970). While attempts of using estimates of heterosis, which is the increased trait values on the progenies from the crosses of inbred lines, from line breeding experiment to investigate the effect of inbreeding has been made, line breeding history does not provide a reliable measure of Het (Pariacote et al., 1998). The availability of molecular genetic markers provides an opportunity to investigate the relationship between
heterozygosity and inbreeding. Heterozygosity across the genome can be utilized to estimate inbreeding coefficients and has shown advantages over the use of pedigree estimated
inbreeding coefficients (Keller et al., 2011). In this method, realized IBS status across the genome is estimated based on dense SNP genotypes. Genomic inbreeding can also be estimated as the diagonal of the genomic relationship matrix using all SNPs across the
genome (VanRaden et al., 2011). The genetic relationship of general U.S. Hereford with Line 1 differed in the past and in the present, and differs at the individual level. Line 1 provides an
excellent study sample to investigate the effect of heterozygosity on inbreeding through the
heterozygosity and inbreeding. This may be accomplished by searching for loci where a disproportionate heterozygosity exists despite strong pressure via selection and inbreeding to
drive loci toward fixation.
While heterozygosity can be directly used to investigate inbreeding and selection signatures in the genome, a complementary measure, the fixation index (Fst) can be used to quantify breed and line differentiation. The fixation index can be estimated by method-of-moment (Weir and Cockerham, 1984) or Bayesian algorithms (Gianola et al., 2010). Using the method-of-moment, variance of allele frequency is employed to estimate Fst. If it is revealed by mean squares that among population variance equals within population variance, there will be no population stratification. Bayesian methods have been shown to perform better when population size is small by virtue of shrinking rare allele frequencies towards average allele frequency (Holsinger and Weir, 2009). In comparing multiple breeds or lines, loci favored by natural selection would achieve larger Fst values compared to the genome background. These loci may have been subjected to selection while genome-wide neutral loci are affected by genetic drift. Conversely, low Fst values may be indicative of balancing selection (Holsinger and Weir, 2009).
large QTL effects. While most of Fst studies involved distant populations, it has been shown that useful signatures of selection can be detected using breeds that only have minor genetic differences (Barendse et al., 2009).
Linkage disequilibrium can reveal line divergence and effective population size. Correlation of LD measures indicate genomic distances among breeds (de Roos et al., 2008). To estimate effective population sizes in the past and the present, the decay of LD as SNP spacing increases have been calculated across the genome or across each chromosome (de Roos et al., 2008, Hayes et al., 2003). By examining LD patterns, population structure within and among populations can be estimated. Haplotype block structure implies population structure and history (Qanbari et al., 2010, Villa-Angulo et al., 2009). Haplotype based analysis such as extended haplotype homozygosity (EHH) (Sabeti et al., 2002) and
integrated haplotype score (IHS) (Voight et al., 2006) detect haplotype structure and indicate selection signatures (Qanbari et al., 2011). Extended haplotype homozygosity is the
probability of observing two randomly chosen haplotypes that are homozygous. Extended haplotype homozygosity test has been applied to detect putative recent selection signatures in a single population of dairy cattle (Qanbari et al., 2009).
Alternative methods exist to investigate selection and inbreeding. For example, changes of allele frequency have been used in the study of selection with a large sample per generation or precisely estimated generation numbers (Fisher and Ford, 1947, Johansson et al., 2010). Random drawn from animals born in different years, our general U.S. Hereford sample has insufficient sample sizes in each generation. Some analyses such as Tajima’s D
differentiation of allele frequencies in breeds and lines. It was suggested that they are more suitable for sequencing data than pre selected SNP genotypes (Qanbari et al., 2009). It has also been shown that the Fst value and allele frequency based test (Smith et al., 2001) are highly correlated (> 0.8) (Wiener et al., 2011).
Heterozygosity, Fst and LD can be affected by factors such as random drift and selection. Combining results from several tests and from association studies could help to identify SNP loci of functional interest. Some examples are combining extreme Fst values and additive effects of feed efficiency traits (Barendse et al., 2009), testing candidate genes with EHH test (Qanbari et al., 2010) and estimating the correlation of the F statistic obtained from association studies and Fst value (Wiener et al., 2011).
In the application of SNP panels, ascertainment bias may occur. Ascertainment bias is the overestimated polymorphisms in a population that was used in searching for
polymorphisms. It is due to the sampling processes involved in designing SNP panels, which did not include data representing all populations. Ascertainment bias was detected in
CONCLUSION
Selection and inbreeding both influence allele frequency in the population. Newly developed genomic tools offer opportunities to detect these effects at the genome level. In the past dozen years, the Hereford population especially Line 1 Hereford, has contributed to the development of bovine genomics tools, including SNP panels. These panels have been widely used in the genetic studies of cattle.
A practical application of SNP panels is reconstructing genotypes to increase
information content and lower genotyping cost. Imputation was applied to predict unknown genotypes when genotypes are available on inhomogeneous SNP panels. Imputation can be performed based on pedigree information, LD of the SNPs or both. Imputation accuracy may be affected by design of reduced panel and genetic relationship among animals.
Genomic patterns can be revealed by using heterozygosity, LD, Fst and other test to indicate population divergence and to test putative selection signatures. Selection changes allele frequencies on specific genome regions while random drift affects allele frequencies across the genome. Using samples from populations that are subject to different levels of selection and random drift, the impact of selection on the genome may be revealed. The studies of imputation and genome patterns were introduced in these chapters:
Chapter 1
Chapter 2
The objective of this study was to investigate effects of reduced panel design, fully genotyped sample size and population structure in the imputation of SNP genotypes from the Line 1 Hereford population and general U.S. Hereford population. In order to study the effects of population structure, genotyping schemes were created to capture the effect of individual origin, and the genetic relationships among individuals.
Chapter 3
The objectives of this research included utilizing 50K SNP genotypes to characterize the animal samples from the Line 1 Hereford population and bulls from the general American Hereford population; detecting genome patterns of these two populations by estimates of LD,
Fst and heterozygosity; searching for loci related to selection. Genotypes based on SNPs were tested to estimate their association with selection on Line 1 Hereford samples and the non-additive portion of phenotypic variance.
Chapter 4
LITERATURE CITED
Allan, M. F., L. A. Kuehn, R. A. Cushman, W. M. Snelling, S. E. Echternkamp, and R. M. Thallman. 2009. Confirmation of quantitative trait loci using a low-density single nucleotide polymorphism map for twinning and ovulation rate on bovine chromosome 5. J. Anim. Sci. 87:46-56.
Bailey, C. M., W. R. Harvey, J. E. Hunter, and C. R. Torell. 1971. Estimated direct and correlated response to selection for performance traits in closed Hereford lines under different types of environments. J. Anim. Sci. 33:541-549.
Barendse, W., B. E. Harrison, R. J. Bunch, M. B. Thomas, and L. B. Turner. 2009. Genome wide signatures of positive selection: the comparison of independent samples and the identification of regions associated to traits. BMC Genomics 10:178.
Chan, E. K., S. H. Nagaraj, and A. Reverter. 2010. The evolution of tropical adaptation: comparing taurine and zebu cattle. Anim. Genet. 41:467-477.
Charlesworth, B. 2009. Effective population size and patterns of molecular evolution and variation. Nat. Rev. Genet. 10:195-205.
Charlesworth, B. 2010. Variation catches a ride. Science 330:326-327.
Cleveland, M. A., H. D. Blackburn, R. M. Enns, and D. J. Garrick. 2005. Changes in inbreeding of US Herefords during the twentieth century. J. Anim. Sci. 83:992-1001.
Clutton-Brock, J. 1999. A natural history of domesticated mammals. 2 ed. Cambridge University Press, Cambridge, U.K.
Crow, J. F. 1970. Introduction to population genetics theory. Burgess Pub. Co, Minneapolis.
Darwin, C. and J. Endersby. 2009. On the origin of species. Cambridge University Press, Cambridge, UK.
de Roos, A. P., B. J. Hayes, R. J. Spelman, and M. E. Goddard. 2008. Linkage disequilibrium and persistence of phase in Holstein-Friesian, Jersey and Angus cattle. Genetics 179:1503-1512.
Decker, J. E., J. C. Pires, G. C. Conant, S. D. Mckay, M. P. Heaton, K. F. Chen, A. Cooper, J. Vilkki, C. M. Seabury, A. R. Caetano, G. S. Johnson, R. A. Brenneman, O. Hanotte, L. S. Eggert, P. Wiener, J. J. Kim, K. S. Kim, T. S. Sonstegard, C. P. Van Tassell, H. L. Neibergs, J. C. McEwan, R. Brauning, L. L. Coutinho, M. E. Babar, G. A. Wilson, M. C. McClure, M. M. Rolf, J. Kim, R. D. Schnabel, and J. F. Taylor. 2009. Resolving the evolution of extant and extinct ruminants with high-throughput phylogenomics. Proc. Natl. Acad. Sci. U. S. A. 106:18644-18649.
Dickenson, H. H. 1984. The influence of Line 1 in the Hereford breed. Proc. 1984 Field Day, Fort Keogh Livestk. and Range Res. Sta. p. iii-vi
Druet, T. and M. Georges. 2010. A hidden Markov model combining linkage and linkage disequilibrium information for haplotype reconstruction and quantitative trait locus fine mapping. Genetics 184:789-798.
Elsik, C. G. and R. L. Tellam and K. C. Worley and R. A. Gibbs and D. M. Muzny and G. M. Weinstock and D. L. Adelson and E. E. Eichler and L. Elnitski and R. Guigo and D. L. Hamernik and S. M. Kappes and H. A. Lewin and D. J. Lynn and F. W. Nicholas and A. Reymond and M. Rijnkels and L. C. Skow and E. M. Zdobnov and L. Schook and J.
Womack and T. Alioto and S. E. Antonarakis and A. Astashyn and C. E. Chapple and H. C. Chen and J. Chrast and F. Camara and O. Ermolaeva and C. N. Henrichsen and W. Hlavina and Y. Kapustin and B. Kiryutin and P. Kitts and F. Kokocinski and M. Landrum and D. Maglott and K. Pruitt and V. Sapojnikov and S. M. Searle and V. Solovyev and A. Souvorov and C. Ucla and C. Wyss and J. M. Anzola and D. Gerlach and E. Elhaik and D. Graur and J. T. Reese and R. C. Edgar and J. C. McEwan and G. M. Payne and J. M. Raison and T. Junier and E. V. Kriventseva and E. Eyras and M. Plass and R. Donthu and D. M. Larkin and J. Reecy and M. Q. Yang and L. Chen and Z. Cheng and C. G. Chitko-McKown and G. E. Liu and L. K. Matukumalli and J. Song and B. Zhu and D. G. Bradley and F. S. Brinkman and L. P. Lau and M. D. Whiteside and A. Walker and T. T. Wheeler and T. Casey and J. B.
D. E. Hagen and H. Salih and J. Aerts and A. R. Caetano and B. Dalrymple and J. F. Garcia and C. A. Gill and S. G. Hiendleder and E. Memili and D. Spurlock and J. L. Williams and L. Alexander and M. J. Brownstein and L. Guan and R. A. Holt and S. J. Jones and M. A. Marra and R. Moore and S. S. Moore and A. Roberts and M. Taniguchi and R. C. Waterman and J. Chacko and M. M. Chandrabose and A. Cree and M. D. Dao and H. H. Dinh and R. A. Gabisi and S. Hines and J. Hume and S. N. Jhangiani and V. Joshi and C. L. Kovar and L. R. Lewis and Y. S. Liu and J. Lopez and M. B. Morgan and N. B. Nguyen and G. O. Okwuonu and S. J. Ruiz and J. Santibanez and R. A. Wright and C. Buhay and Y. Ding and S. Dugan-Rocha and J. Herdandez and M. Holder and A. Sabo and A. Egan and J. Goodell and K. Wilczek-Boney and G. R. Fowler and M. E. Hitchens and R. J. Lozado and C. Moen and D. Steffen and J. T. Warren and J. Zhang and R. Chiu and J. E. Schein and K. J. Durbin and P. Havlak and H. Jiang and Y. Liu and X. Qin and Y. Ren and Y. Shen and H. Song and S. N. Bell and C. Davis and A. J. Johnson and S. Lee and L. V. Nazareth and B. M. Patel and L. L. Pu and S. Vattathil and R. L. Williams, Jr. and S. Curry and C. Hamilton and E. Sodergren and D. A. Wheeler and W. Barris and G. L. Bennett and A. Eggen and R. D. Green and G. P. Harhay and M. Hobbs and O. Jann and J. W. Keele and M. P. Kent and S. Lien and S. D. McKay and S. McWilliam and A. Ratnakumar and R. D. Schnabel and T. Smith and W. M. Snelling and T. S. Sonstegard and R. T. Stone and Y. Sugimoto and A. Takasuga and J. F. Taylor and C. P. Van Tassell and M. D. Macneil and A. R. Abatepaulo and C. A. Abbey and V. Ahola and I. G. Almeida and A. F. Amadio and E. Anatriello and S. M. Bahadue and F. H. Biase and C. R. Boldt and J. A. Carroll and W. A. Carvalho and E. P. Cervelatti and E. Chacko and J. E. Chapin and Y. Cheng and J. Choi and A. J. Colley and T. A. de Campos and M. De Donato and I. K. Santos and C. J. de Oliveira and H. Deobald and E. Devinoy and K. E. Donohue and P. Dovc and A. Eberlein and C. J. Fitzsimmons and A. M. Franzin and G. R. Garcia and S. Genini and C. J. Gladney and J. R. Grant and M. L. Greaser and J. A. Green and D. L. Hadsell and H. A. Hakimov and R. Halgren and J. L. Harrow and E. A. Hart and N. Hastings and M. Hernandez and Z. L. Hu and A. Ingham and T. Iso-Touru and C. Jamis and K. Jensen and D. Kapetis and T. Kerr and S. S. Khalil and H. Khatib and D. Kolbehdari and C. G. Kumar and D. Kumar and R. Leach and J. C. Lee and C. Li and K. M. Logan and R. Malinverni and E. Marques and W. F. Martin and N. F. Martins and S. R. Maruyama and R. Mazza and K. L. McLean and J. F. Medrano and B. T. Moreno and D. D. More and C. T. Muntean and H. P. Nandakumar and M. F. Nogueira and I. Olsaker and S. D. Pant and F. Panzitta and R. C. Pastor and M. A. Poli and N. Poslusny and S. Rachagani and S.
Elston, R. C. and J. Stewart. 1971. A general model for the genetic analysis of pedigree data. Hum. Hered. 21:523-542.
Falconer, D. S. and T. F. C. Mackay. 1996. Introduction to quantitative genetics. 4 ed. Sinauer Associations, Inc., Essex, England.
Fay, J. C. and C. I. Wu. 2000. Hitchhiking under positive Darwinian selection. Genetics 155:1405-1413.
Fernandez, S. A., R. L. Fernando, B. Guldbrandtsen, L. R. Totir, and A. L. Carriquiry. 2001. Sampling genotypes in large pedigrees with loops. Genet. Sel. Evol. 33:337-367.
Fisher, R. A. and E. B. Ford. 1947. The Spread of a Gene in natural conditions in a colony of the Moth Panaxia dominula L. Heredity 1:143-174.
Freeman, A. R., D. J. Lynn, C. Murray, and D. G. Bradley. 2008. Detecting the effects of selection at the population level in six bovine immune genes. BMC Genetics 9:62
Gengler, N., P. Mayeres, and M. Szydlowski. 2007. A simple method to approximate gene content in large pedigree populations: application to the myostatin gene in dual-purpose Belgian Blue cattle. Animal 1:21-28.
Gianola, D., H. Simianer, and S. Qanbari. 2010. A two-step method for detecting selection signatures using genetic markers. Genet. Res. 92:141-155.
Gibbs, R. A., J. F. Taylor, C. P. Van Tassell, W. Barendse, K. A. Eversole, C. A. Gill, R. D. Green, D. L. Hamernik, S. M. Kappes, S. Lien, L. K. Matukumalli, J. C. McEwan, L. V. Nazareth, R. D. Schnabel, G. M. Weinstock, D. A. Wheeler, P. Ajmone-Marsan, P. J.
Goddard, B. J. Hayes, D. G. Bradley, M. Barbosa da Silva, L. P. Lau, G. E. Liu, D. J. Lynn, F. Panzitta, and K. G. Dodds. 2009. Genome-wide survey of SNP variation uncovers the genetic structure of cattle breeds. Science 324:528-532.
Hayes, B. J., P. M. Visscher, H. C. McPartlan, and M. E. Goddard. 2003. Novel multilocus measure of linkage disequilibrium to estimate past effective population size. Genome Res. 13:635-643.
Hedrick, P. W., T. S. Whittam, and P. Parham. 1991. Heterozygosity at individual amino-Acid sites - extremely high-levels for Hla-a and Hla-B genes. Proc. Natl. Acad. Sci. U. S. A. 88:5897-5901.
Hickey, J. M., B. P. Kinghorn, B. Tier, J. F. Wilson, N. Dunstan, and J. H. van der Werf. 2011. A combined long-range phasing and long haplotype imputation method to impute phase for SNP genotypes. Genet. Sel. Evol. 43:12.
Holsinger, K. E. and B. S. Weir. 2009. Genetics in geographically structured populations: defining, estimating and interpreting Fst. Nat. Rev. Genet. 10:639-650.
Hough, J. D., L. L. Benyshek, and J. W. Mabry. 1985. Direct and correlated response to yearling weight selection in Hereford cattle using nationally evaluated sires. J. Anim. Sci. 61:1335-1344.
Howie, B. N., P. Donnelly, and J. Marchini. 2009. A flexible and accurate genotype
imputation method for the next generation of genome-wide association studies. PLoS Genet. 5:e1000529.
Huang, L., Y. Li, A. B. Singleton, J. A. Hardy, G. Abecasis, N. A. Rosenberg, and P. Scheet. 2009. Genotype-imputation accuracy across worldwide human populations. Am. J. Hum. Genet. 84:235-250.
Johansson, A. M., M. E. Pettersson, P. B. Siegel, and O. Carlborg. 2010. Genome-wide effects of long-term divergent selection. PLoS Genet. 6:e1001188.
Keller, M. C., P. M. Visscher, and M. E. Goddard. 2011. Quantification of inbreeding due to distant ancestors and its detection using dense single nucleotide polymorphism data. Genetics 189:237-249.
Kempthorne, O. 1969. An Introduction to Genetic Statistics. Iowa State University Press.
Kim, Y., J. Ryu, J. Woo, J. B. Kim, C. Y. Kim, and C. Lee. 2011. Genome-wide association study reveals five nucleotide sequence variants for carcass traits in beef cattle. Anim. Genet. 42:361-365.
Kimura, M. 1983. The neutral theory of molecular evolution. Cambridge University Press, Cambridge; New York.
Koch, R. M., L. V. Cundiff, and K. E. Gregory. 1994. Cumulative selection and genetic change for weaning or yearling weight or for yearling weight plus muscle score in Hereford cattle. J. Anim. Sci. 72:864-885.
Kong, A., G. Masson, M. L. Frigge, A. Gylfason, P. Zusmanovich, G. Thorleifsson, P. I. Olason, A. Ingason, S. Steinberg, T. Rafnar, P. Sulem, M. Mouy, F. Jonsson, U.
Thorsteinsdottir, D. F. Gudbjartsson, H. Stefansson, and K. Stefansson. 2008. Detection of sharing by descent, long-range phasing and haplotype imputation. Nat. Genet. 40:1068-1075.
Kuehn, L. A., J. W. Keele, G. L. Bennett, T. G. McDaneld, T. P. L. Smith, W. M. Snelling, T. S. Sonstegard, and R. M. Thallman. 2011. Predicting breed composition using breed frequencies of 50,000 markers from the US Meat Animal Research Center 2,000 Bull Project. J. Anim. Sci. 89:1742-1750.
Lynn, D. J., A. R. Freeman, C. Murray, and D. G. Bradley. 2005. A genomics approach to the detection of positive selection in cattle: adaptive evolution of the T-cell and natural killer cell-surface protein CD2. Genetics 170:1189-1196.
MacNeil, M. D. 2009. Invited review: research contributions from seventy-five years of breeding Line 1 Hereford cattle at Miles City, Montana. J. Anim. Sci. 87:2489-2501.
MacNeil, M. D., D. D. Dearborn, L. V. Cundiff, C. A. Dinkel, and K. E. Gregory. 1989. Effects of inbreeding and heterosis in Hereford females on fertility, calf survival and preweaning growth. J. Anim. Sci. 67:895-901.
MacNeil, M. D. and T. B. Mott. 2000. Using genetic evaluations for growth and maternal gain from birth to weaning to predict energy requirements of Line 1 Hereford beef cows. J. Anim. Sci. 78:2299-2304.
MacNeil, M. D. and T. B. Mott. 2006. Genetic analysis of gain from birth to weaning, milk production, and udder conformation in Line 1 Hereford cattle. J. Anim. Sci. 84:1639-1645.
MacNeil, M. D. and S. Newman. 1994. Genetic analysis of calving date in Miles City Line 1 Hereford cattle. J. Anim. Sci. 72:3073-3079.
MacNeil, M. D., J. J. Urick, S. Newman, and B. W. Knapp. 1992. Selection for postweaning growth in inbred Hereford cattle: the Fort Keogh, Montana line 1 example. J. Anim. Sci. 70:723-733.
Matukumalli, L. K., C. T. Lawley, R. D. Schnabel, J. F. Taylor, M. F. Allan, M. P. Heaton, J. O'Connell, S. S. Moore, T. P. Smith, T. S. Sonstegard, and C. P. Van Tassell. 2009.
Development and characterization of a high density SNP genotyping assay for cattle. PLoS One 4:e5350.
Mc Parland, S., J. F. Kearney, D. E. MacHugh, and D. P. Berry. 2008. Inbreeding effects on postweaning production traits, conformation, and calving performance in Irish beef cattle. J. Anim. Sci. 86:3338-3347.
Meuwissen, T. and M. Goddard. 2010. The use of family relationships and linkage disequilibrium to impute phase and missing genotypes in up to whole-genome sequence density genotypic data. Genetics 185:1441-1449.
Neto, L. R. P. and W. Barendse. 2010. Effect of SNP origin on analyses of genetic diversity in cattle. Anim. Prod. Sci. 50:792-800.
Nwakalor, L. N., J. S. Brinks, and G. V. Richardson. 1986. Selection in Hereford cattle .2. expected and realized response. J. Anim. Sci. 62:937-949.
Oleksyk, T. K., K. Zhao, F. M. De La Vega, D. A. Gilbert, S. J. O'Brien, and M. W. Smith. 2008. Identifying selected regions from heterozygosity and divergence using a light-coverage genomic dataset from two human populations. PLoS One 3:e1712.
Pariacote, F., L. D. Van Vleck, and M. D. MacNeil. 1998. Effects of inbreeding and heterozygosity on preweaning traits in a closed population of Herefords under selection. J. Anim. Sci. 76:1303-1310.
Qanbari, S., D. Gianola, B. Hayes, F. Schenkel, S. Miller, S. Moore, G. Thaller, and H. Simianer. 2011. Application of site and haplotype-frequency based approaches for detecting selection signatures in cattle. BMC Genomics 12:318.
Qanbari, S., E. C. Pimentel, J. Tetens, G. Thaller, P. Lichtner, A. R. Sharifi, and H. Simianer. 2009. A genome-wide scan for signatures of recent selection in Holstein cattle. Anim. Genet. 41:377-389.
Qanbari, S., E. C. Pimentel, J. Tetens, G. Thaller, P. Lichtner, A. R. Sharifi, and H. Simianer. 2010. The pattern of linkage disequilibrium in German Holstein cattle. Anim. Genet. 41:346-356.
Rubin, C. J., M. C. Zody, J. Eriksson, J. R. Meadows, E. Sherwood, M. T. Webster, L. Jiang, M. Ingman, T. Sharpe, S. Ka, F. Hallbook, F. Besnier, O. Carlborg, B. Bed'hom, M. Tixier-Boichard, P. Jensen, P. Siegel, K. Lindblad-Toh, and L. Andersson. 2010. Whole-genome resequencing reveals loci under selection during chicken domestication. Nature 464:587-591.
Servin, B. and M. Stephens. 2007. Imputation-based analysis of association studies: Candidate regions and quantitative traits. Plos Genetics 3:1296-1308.
Smith, M. W., J. A. Lautenberger, H. D. Shin, J. P. Chretien, S. Shrestha, D. A. Gilbert, and S. J. O'Brien. 2001. Markers for mapping by admixture linkage disequilibrium in African American and Hispanic populations. Am. J. of Hum. Genet. 69:1080-1094.
Smith, T. P. L., R. M. Thallman, E. Casas, S. D. Shackelford, T. L. Wheeler, and M. Koohmaraie. 2003. Theory and application of genome-based approaches to improve the quality and value of beef. Outlook Agr. 32:253-265.
Snelling, W. M., M. F. Allan, J. W. Keele, L. A. Kuehn, T. McDaneld, T. P. Smith, T. S. Sonstegard, R. M. Thallman, and G. L. Bennett. 2010. Genome-wide association study of growth in crossbred beef cattle. J. Anim. Sci. 88:837-848.
Stella, A., P. Ajmone-Marsan, B. Lazzari, and P. Boettcher. 2010. Identification of selection signatures in cattle breeds selected for dairy production. Genetics 185:1451-1461.
Sutter, N. B., C. D. Bustamante, K. Chase, M. M. Gray, K. Y. Zhao, L. Zhu, B. Padhukasahasram, E. Karlins, S. Davis, P. G. Jones, P. Quignon, G. S. Johnson, H. G.
Parker, N. Fretwell, D. S. Mosher, D. F. Lawler, E. Satyaraj, M. Nordborg, K. G. Lark, R. K. Wayne, and E. A. Ostrander. 2007. A single IGF1 allele is a major determinant of small size in dogs. Science 316:112-115.
Sweet, O. 1975. Birth of a breed: The history of polled Herefords – America’s first beef breed. Lowell.
Szydlowski, M. and N. Gengler. 2008. Sampling genotype configurations in a large complex pedigree. J. Anim. Breed. Genet. 125:330-338.
Tajima, F. 1989. Statistical method for testing the neutral mutation hypothesis by DNA polymorphism. Genetics 123:585-595.
Thallman, R. M., G. L. Bennett, J. W. Keele, and S. M. Kappes. 2001a. Efficient
Thallman, R. M., G. L. Bennett, J. W. Keele, and S. M. Kappes. 2001b. Efficient
computation of genotype probabilities for loci with many alleles: II. Iterative method for large, complex pedigrees. J. Anim. Sci. 79:34-44.
Uemoto, Y., T. Abe, N. Tameoka, H. Hasebe, K. Inoue, H. Nakajima, N. Shoji, M. Kobayashi, and E. Kobayashi. 2011. Whole-genome association study for fatty acid composition of oleic acid in Japanese Black cattle. Anim. Genet. 42:141-148.
VanRaden, P. M., K. M. Olson, G. R. Wiggans, J. B. Cole, and M. E. Tooker. 2011.
Genomic inbreeding and relationships among Holsteins, Jerseys, and Brown Swiss. J. Dairy. Sci. 94:5673-5682.
VanRaden, P. M., C. P. Van Tassell, G. R. Wiggans, T. S. Sonstegard, R. D. Schnabel, J. F. Taylor, and F. S. Schenkel. 2009. Invited review: Reliability of genomic predictions for North American Holstein bulls. J. Dairy Sci. 92:16-24.
Villa-Angulo, R., L. K. Matukumalli, C. A. Gill, J. Choi, C. P. Van Tassell, and J. J. Grefenstette. 2009. High-resolution haplotype block structure in the cattle genome. BMC Genet. 10:19.
Voight, B. F., S. Kudaravalli, X. Wen, and J. K. Pritchard. 2006. A map of recent positive selection in the human genome. PLoS Biol. 4:e72.
Weigel, K. A., G. de Los Campos, A. I. Vazquez, G. J. Rosa, D. Gianola, and C. P. Van Tassell. 2010a. Accuracy of direct genomic values derived from imputed single nucleotide polymorphism genotypes in Jersey cattle. J. Dairy Sci. 93:5423-5435.
Weigel, K. A., C. P. Van Tassell, J. R. O'Connell, P. M. VanRaden, and G. R. Wiggans. 2010b. Prediction of unobserved single nucleotide polymorphism genotypes of Jersey cattle using reference panels and population-based imputation algorithms. J. Dairy Sci. 93:2229-2238.
Wiener, P., M. A. Edriss, J. L. Williams, D. Waddington, A. Law, J. A. Woolliams, and B. Gutierrez-Gil. 2011. Information content in genome-wide scans: concordance between patterns of genetic differentiation and linkage mapping associations. BMC Genomics 12:65.
Wright, S. 1921. Systems of mating. I. The biometric relations between parent and offspring. Genetics 6:111-123.
Chapter 2
ABSTRACT
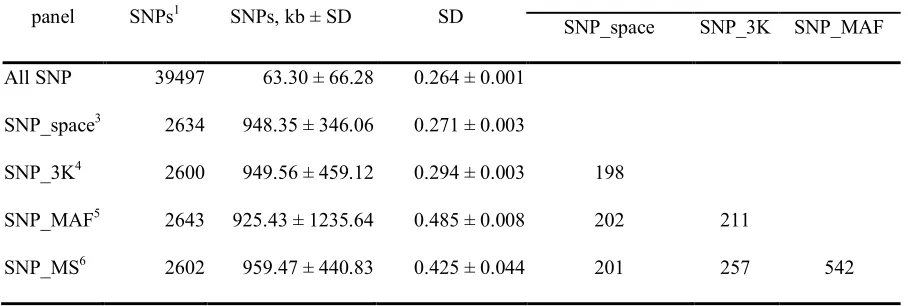
The objective of this study was to investigate alternative methods for designing and utilizing reduced single nucleotide polymorphism (SNP) panels for genotype reconstruction. Two purebred Hereford populations, an experimental population known as Line 1 Hereford (L1, N=240) and registered Hereford with American Hereford Association (AHA, N = 311), were utilized. Using different reference samples of 62 to 311 animals with 39,497 SNPs on 29 autosomes, and study samples of 57 or 62 animals for which genotypes were available for ~2,600 SNPs (reduced panels), imputations were performed to predict the other ~36,900 loci which had been masked. An imputation package including LinkPHASE and DAGPHASE (Druet and Georges, 2010) was used for imputation. Four reduced panels differing in minor allele frequency (MAF) and marker spacing were evaluated. Reduced panels included every fifteenth SNP across the genome (SNP_space); commercial Illumina Bovine3K Beadchip (SNP_3K); SNPs with the highest MAF (SNP_MAF); and SNPs with high MAF and were evenly spaced across the genome (SNP_MS). Imputation accuracy was defined as the
study samples resulted in a 30.44 or 23.19% increase in imputation accuracy, respectively. Reference samples from the L1 population provided lower imputation accuracy than
reference samples from admixed population AHA (P-values < 0.001). When using pedigree relationship or molecular relationship as a covariate, increasing the number of animals in the
reference panel increased imputation accuracy by 0.05 or 0.06%, respectively. Based on these results it was concluded that imputation accuracy may be increased through optimization of reduced panel design and genotyping strategy.
INTRODUCTION
Single nucleotide polymorphism (SNP) marker panels that differ in density ranging from a few hundred to about 770,000 markers are currently available for use in research and selection programs. A common scenario will be that animals in experimental reference populations (or key individuals in a selection program), defined as reference samples in this study, will be genotyped with the highest density panels, while animals sampled for a specific study (or young individuals to be progeny tested), defined as study samples, genotyped with a reduced set of markers. To make full use of data collected from
heterogeneous panels, marker genotypes that were not directly assayed in the low density samples can be imputed by exploring population linkage disequilibrium (LD) and pedigree information (Daetwyler et al., 2011, Druet and Georges, 2010, Hickey et al., 2011).
Comparisons of reduced panels have been done using evenly spaced markers of different densities (Weigel et al., 2010a; Zhang and Druet, 2010). Reduced panels of the same density can be designed differently base on spacing and minor allele frequency (MAF) of SNPs. The effect of design of reduced panel on imputation performances is unknown. Besides reduced panels, population structure of reference and study samples can affect accuracy of imputation (Druet and Georges, 2010, Huang et al., 2009).
effects of population structure, genotyping schemes were created to capture the effect of reference sample origin, and the genetic relationships between reference and study samples.
MATERIALS AND METHODS
Data
Individuals’ marker genotypes were obtained from two distinct albeit related Hereford populations; Line 1 cattle located at Fort Keogh Livestock and Range Research Laboratory, Miles City, MT and commercial registered Herefords. Line 1 Hereford cattle have been maintained as a closed purebred Hereford line since 1931 (MacNeil, 2009). A sample of 240 animals from Line 1 (L1) that were born from 1953 to 2008 was genotyped for this study. The 240 individuals can be roughly divided into two groups: a current and an ancestor group. The current group includes nine paternal half-sib families of 57 females and 62 males. The average number of progeny in these families was 12.8 with a standard
deviation of 2.6. The ancestor group consists of 121 sires and grandsires. Individuals sampled by American Hereford Association (AHA) were males included in the U.S. Meat Animal Research Center (MARC) 2,000 bull project (Kuehn et al., 2010). Fifty-six bulls had been previously used in the MARC Germplasm Evaluation program
Animals were genotyped using the Illumina BovineSNP50 Beadchip (Matukumalli et al., 2009). Chromosome information and physical positions of SNPs were mapped to
UMD3.0 assembly (Zimin et al., 2009). All animals were pooled for data editing and quality assessment. After removal of SNPs (a) without chromosome information and physical
positions; (b) with a call rate less than 90%; (c) with MAF < 2% and (d) in complete LD with adjacent SNPs (correlation of genotypes of two SNPs > 0.99), a subset of 39,497 SNPs from 29 autosomes remained. Genotypes were checked for inconsistencies between sire and offspring. Sire offspring pairs with more than 2,000 inconsistent genotypes were considered as animals with pedigree errors. In this case, a possible sire was searched for this offspring using genotypes. Pedigree errors of six sire offspring pairs were corrected with this method. In addition inconsistent genotypes between sire and offspring pairs less than 50 were set as missing in the offspring. After editing, 99.9% of the remaining genotypes were known.
Reduced panel design and cost
An overall description of all SNP panels was shown in Table 2.1. To simulate genotypes which would be expected from reduced panels of various structures, up to 93.4% of available SNPs were masked in the sampling populations. To simulate reduced panels four different criteria were employed: SNP_space, SNP_3K, SNP_MAF and SNP_MS.
markers with the highest MAF; finally SNP_MS include markers with high MAF (MAF > 0.35) and evenly spaced across the genome. Genotyping costs usually differ in different panels. To mimic the current costs on an Illumina BovineSNP50 Beadchip and a reduced, the cost of genotyping an individual using high density panel was assumed to be 2.5 units. The genotyping cost of an individual using a reduced density panel was assumed to be one unit. Both SNP_MAF and SNP_MS were customized reduced panels for the Hereford breed. It may require extra cost of designing these panels compared to commercial panel. However, the costs of all reduced panels were assumed to be the same in this study.
Design of genotyping schemes
on imputation accuracy reference samples differing in the number of animals included were evaluated. Reference panel sizes ranged from 62 to 311 individuals.
Fixed study sample
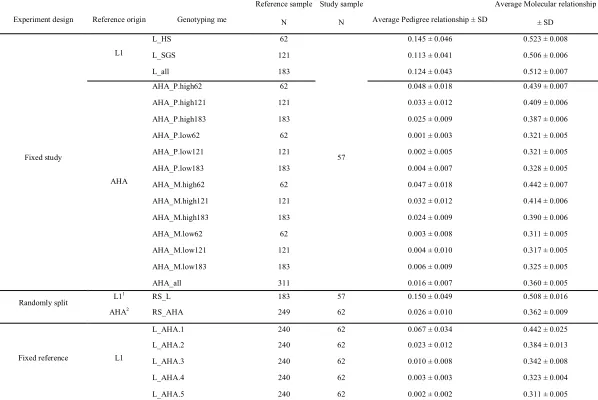
Fifty-seven L1 females were employed as a fixed study sample. Accuracy of imputation was investigated using reference samples from L1. Utilizing the population structure of L1, three reference samples were considered in the genotyping schemes. In the first reference panel (L_HS) 62 half sibs of the study sample were used. In the second reference panel (L_SGS) 121 sires and grandsires of the study sample were used. Lastly (L_all) was a combination of the previous two references consisting of 183 individuals.
With the same study sample, accuracy of imputation was investigated using reference samples from AHA. Thirteen genotyping schemes were then investigated. To make results comparable to those using L1 as reference, subsets of 62, 121 and 183 AHA individuals were used as reference samples. Subsets differed in their relationships with the study sample. Pedigree based and molecular based relationships were used here.
were used. For example, in AHA_P.high62, 62 AHA individuals that were most related to the study sample based on their pedigree relationship were chosen as reference individuals. Besides using subsets, all individuals in AHA (311 individuals) were employed as a
reference sample in the genotyping scheme AHA_all.
Randomly split within population
Accuracy of imputation was investigated by grouping individuals within population. Individuals in L1 were randomly split into a reference sample of 183 individuals (76% of L1 genotyped animals) and a study sample of 57 individuals (RS_L). Ten different splits were generated for RS_L. Imputation accuracies were investigated for each set of reference and study samples. Similarly, AHA individuals were randomly divided into a reference sample of 249 individuals (80% of AHA genotyped animals) and a study sample of 62 individuals (RS_AHA). Ten different splits were generated for RS_AHA.
Fixed reference individuals
Accuracy of imputation was investigated using all 240 L1 individuals as a fixed reference sample to impute AHA individuals. Five subgroups of AHA individuals were obtained on the basis of their molecular relationships and used as study samples. Five
Pedigree relationship
Relationships among individuals were estimated using pedigree information. The relationship was calculated for each study individual relative to the reference sample.
Arithmetic mean of pedigree relationship between reference and study sample were obtained for each genotyping scheme (Table 2.2).
The full numerator relationship matrix was constructed using R (http://www.R-project.org/) software package ‘GeneticsPed’ (http://rgenetics.org) following Henderson’s method (Henderson, 1976). A matrix A had dimensions n by n, where n equaled the number of genotyped individuals. The matrix A was extracted from the full numerator relationship matrix and contained the expected IBD of genotyped individuals.
Let rj represent an individual j in the reference sample and sk represent an individual k in the study sample. The number of individuals in the reference and study sample was nr and ns, respectively. The summation of nr and ns was less than or equal to n. Let be the off diagonals in the A matrix,
Pedigree relationshipk =
Pedigree relationshipk represented the average relationship between individual k and
the reference sample. It was the estimation of degree of IBD of this individual and the reference sample.
Molecular relationship
SNP information, realized relationship matrix MM' can describe the number of genotypes individuals shared. The matrix M indicated the marker alleles each individual inherited (VanRaden, 2008). The dimensions of the M matrix were n by m, where m was the number of markers (m = 39,497). Genotypes were coded as -1, 0 and 1 to describe homozygote major, heterozygote and homozygote minor allele, respectively. Matrix MM' had dimensions
n by n. Using the same notations let ′ be the off diagonals in MM' matrix.
Molecular relationshipk = × ′
The molecular relationshipk indicates the average realized relationship of a study
individual k to the reference sample. It represented the degree of genome segment sharing of this animal and the reference sample.
Imputation
Imputation was performed with the LinkPHASE and DAGPHASE package (Druet and Georges, 2010) following the procedure of Zhang and Druet (2010). Using all SNPs on the reference individuals and the reduced set of SNPs on study individuals, haplotypes were constructed partially based on linkage and Mendelian segregation rules. Imputation was then performed iteratively to construct complete haplotypes based on linkage and LD. For
shift parameters controlled the complexity of the model. These two parameters were modified to 1 and 0.05 to fit the sample sizes and marker density in this study. Twenty iterations were performed for each imputation process. Imputations on each chromosome were performed independently. The physical map was converted to a genetic map assuming that 1 Mb equaled 1 cM. Five imputation technical repeats were used for each genotyping scheme and reduced panel. Imputation accuracy was calculated as the correlation of imputed and real genotypes for each imputation. For a few genotypes (less than 0.1%) that were missing before being masked, real genotypes were considered the same as imputed genotypes.
Statistical analysis
To test the significance of different main factors in the model on imputation accuracy, ProcGLM in SAS (SAS Institute Inc., Cary, NC) was used on all the data to analyze
imputation accuracy. In the pedigree model and molecular model, reduced panels (n = 4), population origins (n = 2) of reference samples, reference sample size, and genetic
relationship were tested as fixed effects. Size of reference sample and genetic relationship were treated as covariates. The only difference between the pedigree model and molecular model was the genetic relationship. The pedigree model used average pedigree relationship of study samples in each genotyping scheme, and the molecular model used average molecular relationship based on the marker data.
The genotyping scheme model was used to test different genotyping schemes.
genotyping schemes, including 16 schemes using a fixed study sample, two schemes based on randomly grouping animals within population and five schemes using a fixed reference sample. In total 820 imputation runs were evaluated. Multiple comparisons were adjusted by Tukey’s range test.
RESULTS AND DISCUSSION
Effects on imputation accuracy
Reduced panel design, population origins of reference samples, size of reference samples, and genetic relationship all affected imputation accuracy under pedigree and
molecular models (P-values < 0.001). Reduced panel design and genotyping scheme affected imputation accuracy using the genotyping scheme model (P-values < 0.001). Proportion of variance explained by the pedigree, molecular and genotyping scheme models was 92.3%, 97.1%, and 99.8%, respectively. In this study, molecular relationship explained a greater proportion of variance in imputation accuracy under molecular model than pedigree relationship did under pedigree model.
Reduced panels
shown in Table 2.3. Imputation accuracy differences among reduced panels were similar when using the molecular, pedigree, and genotyping scheme models.
Reduced sets of SNPs that were selected to be evenly spaced have been shown to generate low error rates in imputation studies (Weigel et al., 2010b, Zhang and Druet, 2010). Imputation was performed based on the idea that haplotypes in the reference and study individuals can be matched by the SNPs typed in both groups. Without knowing the exact distribution and lengths of haplotypes in the whole genome, it was concluded that evenly spaced SNPs do an acceptable job of representing haplotype polymorphisms.
The commercial SNP_3K panel was designed base on spacing and MAF across different breeds of beef cattle and dairy cattle. The imputation accuracies of SNP_3K and SNP_space were not significantly different from each other in pedigree and molecular models (P-values > 0.85). They were 0.17% different in the genotyping scheme model ( P-values < 0.05).
The SNP_MAF reduced panel had the lowest imputation accuracy. Reduced set SNP_MAF included the SNPs of highest MAF using the animal samples in this study. It had been shown that SNP that were statistically significant in association studies were trait and breed specific. Power to detect quantitative trait loci (QTL) effects is expected to be
higher chances of observing recombination cites between two SNPs and decreased LD among SNPs, which will ultimately affect imputation accuracy.
The SNP_MS reduced panel had the highest imputation accuracy (Table 2.3). By using a similar method in selecting a subset of SNPs, SNP_MS outperformed SNP_3K by 1.66% imputation accuracy across all genotyping schemes. An arbitrary threshold on MAF was used in SNP_MS so that its MAF is slightly lower than SNP_MAF and its standard error of the distance of adjacent SNPs was similar to that in SNP_3K. Whether the increase in imputation accuracy and MAF on the reduced panel will benefit future association studies or genomic selection studies was not investigated here.
Reference origin
Different genotyping schemes for imputation were designed utilizing the population structure of the samples in this study. Under pedigree and molecular models, across all reduced panels, all genotyping schemes, and all animals, LSMEANS of imputation accuracies were 70.88 and 72.46% using L1 as reference samples respectively. They were 91.16 and 89.92% using AHA as reference samples, respectively (Table 2.3).
information to detect the number of sub-populations and the grouping of animals (Falush et al., 2003, 2007, Pritchard et al., 2000). With the animal samples in this study, two sub-populations were detected after testing the number of subpopulation from two to eight, and 97.9% of L1 animals were assigned to one sub-population. Having these two distinct albeit related Hereford populations, the effect of population origin on imputation was investigated.
The imputation method adopted here involved a process of sampling haplotypes from the reference sample. When reference samples come from an inbred population, limited types of haplotypes are found. If these haplotypes did not represent the haplotypes in study
samples, imputation accuracy decreased. In this study, reference samples from L1 yielded lower imputation accuracy than reference samples from AHA. Whether these two
populations had different haplotype diversity was not investigated in this study. However, it would be reasonable to assume that the probability of a L1 haplotype appearing in AHA is greater than the AHA haplotype appearing in L1 because L1 has been a closed population for more than 19 generations while AHA breeders has been purchasing L1 animals during this time.
Reference sample size
population structure or relationship measures. A balanced design will be needed to clearly estimate size effect.
Relationship between reference and study samples
Standard errors of individual relationship within genotyping scheme were considered to be small. Therefore the average of relationship measures was used as a covariate in
estimating imputation error. Average pedigree and molecular relationships each significantly affect imputation error. Under pedigree and molecular models, the coefficients of genetic relationship in predicting imputation accuracy were 304.4 or 231.9%, respectively. Increasing average pedigree relationship by 0.1 would reduce imputation accuracy by
30.44%. Increasing average molecular relationship by 0.1 would reduce imputation accuracy by 23.19%.
In Fixed study design, AHA animals were ranked by pedigree or molecular
relationships to L1 study samples and subset into groups of 62, 121 and 183 animals (Table 2.4). The total number of AHA animals was 311. Any two subsets of 183 animals had at least 55 animals overlap. By using either pedigree or molecular relationships, most and least related subsets did not have many animals overlap. Pedigree and molecular relationships picked 56 out of 62, 102 out of 121 and 158 out of 183 common animals as the most related animals to the study sample. These two relationship measures picked 31 out of 62, 96 out of 121 and 165 out of 183 common animals as the least related animals.
correlation. Pedigree relationship utilizes the numerator relationship matrix to estimate the probability of IBD among animals. Pearson correlation of numerator relationship matrix and marker based realized relationship matrix was 0.827. Genetic relationships between one study individual and reference samples was estimated as the average of the off diagonal elements of one study individual and all reference individuals in relationship matrixes. Across different genotyping schemes, the Pearson correlation of pedigree and molecular relationship was 0.883. Notice that molecular relationship and pedigree relationship cannot be directly compared by their values. The minimum of pedigree relationship was 0.
Molecular relationship ranges from -1 to 1. Molecular relationship utilized the realized relationship matrix of the genotyped individuals to measure IBS over all markers. A score of -1 indicates that an individual in a study sample was homozygous for every marker, and all reference individuals had the alternative homozygote for all the markers. A score of 1 indicated this animal and all reference animals had the same genotype for all markers. With the same premises, i.e. animals sharing more identical genotypes were more related. In this study, molecular relationship has a better resolution to predict animals that have high or low imputation error than pedigree relationship. Therefore, when designing fixed reference imputation, only molecular relationship was used to choose subsets of AHA animals in fixed reference design.
to MM'. Pedigree information or assumption on allele frequency of base population was required to determine the scaling factor. In this study, the purposes of obtaining relationship matrixes were to rank animals, to subset them accordingly and to represent the relationship of reference and study individuals. No scaling to MM' was necessary to achieve these
objectives. This study examined whether pedigree or molecular data alone can indicate optimal subsets of reference samples. Therefore, only the realized relationship matrix MM'
was used here to estimate molecular relationship. No pedigree information or allele frequency assumption was provided in obtaining molecular relationship.
Comparisons of imputation error under different genotyping schemes
Pedigree and molecular models were used to generalize factors that affected imputation accuracy. Genotyping scheme model was adopted to specifically compare different genotyping schemes. Imputation accuracy for each genotyping scheme across four reduced panels was reported as LSMEANS. Accuracies were indicated as color scale in the bottom row of Figure 2.1. The differences of genotyping scheme on the row and the one on the column were shown in the lower diagonals.