TABLE OF CONTENTS:
Vol. 44, No. 4, July 1991
ARTICLESPlant Ecology
306311
318
323
321
330
California oak-woodland overystory species affect herbage understory: Management implications
by Raymond D. Ratliff, Don A. Duncan, and
Stanley E. Westfall
Response of montane tall-forb communities to 2,4-D and mixtures of 2,4-D and picloram
by R.B. Murray, H.F. Mayland, and G.E. Shewmaker
Effects of established perennial grasses on yields of associated annual weedsby
M.M.Borman, W.C. Krueger, and D.E. Johnson
Variability in germination rate among seed lots of Lehmann lovegrass
by
Stuart T. Hardegree and William E. Emmerich
Effects of single season and rotation harvesting on cool- and warm-season grasses of a mountain grassland
by Donald A. Jameson
Xeric
big sagebrush, a new subspecies in the Artemisiotridentata
complexby Roger Rosentreter and Rick G. Kelsey
Plant Physiology
336
Physiological responses of six wheatgrass cultivars to mycorrhizaeby
Di Jian Jun and Edith B. Allen341 Root morphological development in relation to shoot growth in seedlings of four range grasses
by Lucrecia Aguirre and Douglas A. Johnson
347
Influence of temperature and cheatgrass competition on seedling devel-opment of two bun&grasses
by Lucrecia Aguirre and Douglas A.
Johnson
355
Effect of water on morphological development in seedlings of three range grasses: Root branching patternsby Douglas A. Johnson and Lucrecia
Aguirre
361 Nutritional value of fresh Gambel
oak browse for Spanish goatsby Brian
L. Dick and Philip J. Urness
Plant/ Animal Interactions
364
Lesser prairie-chicken densities on tebuthiuron-treated and untreated sand shinnery oak rangelandsby Craig D. Olawsky and Loren M. Smith
369 Prescribed grazing
as a secondary impacl in a western riparian floodplninby James A. Sedgwick and Fritz L. Knopf
Measurements/Sampling
314
319
Range conditibn analysis: Comparison of two methods in southern New Mexico desert grasslands
by E. Tedonkeng Pamo, Rex D. Pieper, and
Reldon F. Beck
Published bimonthly-January, March, May, July, September, November Copyright 1991 by the Society for Range Management
INDlVlDUALSUBSCRlPTlON is by membership in the Society for Range Management.
LIBRARY or other INSTITUTIONAL SUBSCRIP- TIONS on a calendar year basis are $58.00 for the United States postpaid and $88.00 for other coun- tries, postpaid. Payment from outside the United States should be remitted in US dollars by interna- tional money order or draft on a New York bank. BUSINESS CORRESPONDENCE, concerningsub- scriptions, advertising, reprints, back issues, and related matters, should be addressed to the Manag- ing Editor, 1839 York Street, Denver, Colorado 80208.
EDlTORlALCORRESPCNDENCE,concerningmanu- scriptsorothereditorial matters,should beaddressed to the Editor, Gary Frasier. 1300 Wheatridge Ct., Loveland, Colorado 80537. Page proofs should be returned to theproduction Editor, 1839YorkStreet, Denver, Colorado 80208.
INSTRUCTIONS FOR AUTHORS appear on the inside back cover of most issues. A Style Manual is also available from the Society for Range Manage- ment at the above address @$2.OOfor single copies; $1.25 each for 2 or more.
THE JOURNAL OF RANGE MANAGEMENT (ISSN 0022-409X) is published six times yearly for $58.00 per year by the Society for Range Management, 1839 York Street, Denver, Colorado 80208. SECONDCLASS POSTAGEpaidat Denver, Colorado. POSTMASTER: Return entlre lournal with address change-RETURN POSTAGE GUARANTEED-to Society for Range Management, 1839 York Street, Denver, Colorado 80208.
Reclamation
382 Forage
production of reclaimed mined lands as influenced by nitrogen
fertilization and mulching practice
by G.E. &human, E.M. Taylor, Jr.,
and F. Rauzi
385
Temperature profiles for germination of big sagebrush seeds from native
stands
by James A. Young, Debra A. Palmquist, and Raymond A. Evans
Economics
390
Multiple use of public rangeland: Antelope and stocker cattle in Wyoming
by Chris T. Bastian, James J. Jacobs, Larry J. Held, and Michael A. Smith
395
Cattle-deer interactions in the Sierra Nevada: A bioeconomic approach
by
John B. Loomis, Eric R. Loft, Douglas R. Updike, and John G. Kie
Grazing Management
399
Vegetational response to short-duration and continuous grazing in south-
central New Mexico
by Michael R. White, Rex D. Pieper, Gary B.
Donart, and Linda White Trifaro
Terminology
404
Research observations: Standardized terminology for structures resulting
in emergence and crown placement of three perennial grasses
by R.E. Ries
and L. Hofmann
TECHNICAL NOTES
408
Comparing the captec bolus to chromic oxide dosed twice daily using
sheep in confinement
by Patrick G. Hatfield, John W. Walker, and
Hudson A. Glimp
409
Use of dry-weight rank multipliers for desert vegetation
by Rosemary
Mazaika and Paul R. Krausman
411 Surface runoff plot design
for use in watershed research
by John D.
Williams and John C. Buckhouse
BOOK REVIEWS
413
EnvironmentalScience. Sustaining
theEarth.
by G. Tyler Miller, Jr.;
Fire
in North American Tallgrass Prairie
edited by S.L. Collins and L.L.
Wallace; The
Range
by Sherm Ewing; and The
Economics of Livestock
Systems in Developing Countries: Farm and Project Level Analysis
by
James R. Simpson.
Managlng Editor PETER V. JACKSON Ill
1839 York Street Denver, Colorado 80208
ASSOCIATE EDITORS DONALD BEDUNAH
School of Forestry University of Montana Missoula. Montana 59812 GARY FRASIER
1300 Wheatridge Ct. Loveland, Colorado 80537 Productfon Edftor PATRICIA G. SMITH
Society for Range Management 1839 York Street
Denver, Colorado 80208 (303) 355-7070
DAVID ENGLE Agronomy Department Oklahoma State University Stillwate!, Oklahoma 74078 TIMOTHY E. FULBRIGHT
College of Agriculture Texas A&l
POB 158, Sta. 1 Kingsville, Texas 78383
Book Review Edltor G. FRED GIFFORD
DAVID L. SCARNECCHIA Range, Wildlife & Forestry Department of Natural Resource Sciences 1000 Valley Road Washington State University University of Nevada Pullman, Washington 991846410 Rena, Nevada 89512
KRIS HAVSTAD USDA-ARS, Dept. 3JER Box 3003, NMSU
Las Cruces, New Mexico 88003 RODNEY HEITSCHMIDT
USDA ARS
Livestock d Range Research Rt 1 Box3
Miles City, Montana 59301
KIRK MCDANIEL
Dept. of Animal 8 Range Science Box 31
New Mexico State University Las Cruces, New Mexico 88003-0003 ROY STRANG
British Columbia Inst. of Tech. 3700 Willingdon Ave. Burnaby. British Columbia CANADA V5G 3H2 JERRY HOLECHEK
Animal 8 Range Science Dept. 3-l Box 30003 New Mexico State University Las Cruces, New Mexico 88003-0003
DAVID M. SWIFT
Natural Resources Ecology Colorado State University Ft. Collins, Colorado 80523 HERMAN S. MAYEUX. JR. PAUL TUELLER
USDA-ARS Range Wildlife 8 Forestry
California oak-woodland overstory species affect herbage
understory: Management implications
RAYMOND D. RATLIFF, DON A. DUNCAN, AND STANLEY E. WESTFALL
Abstract
Concerns for the future of California’s oak-woodlands have intensified the need to better understand how different overstory species affect herbage standing crops and species frequencies. Data from over 8,000 plots harvested between 1961 and 1968 at the San Joaquin Experimental Range in the Sierra Nevada foothills of central California show that peak standing crops averaged 2,795 kg/ha in the open; 3,086 kg/ha under blue oak (Quercus dougkr- s&l,840 kg/ha under interior live oak (Quercus wislizenii); 1,696 kg/ha under digger pine (Pinussabiniana); and 1,917 kg/ ha under buck brush (Ceanothus cuneatus). Overstory species affected standing crops differently on different range sites. On swales, standing crops were less under live oak and digger pine than in open areas. On open-rolling uplands, standing crops were less in the open and under live oak than under blue oak. On rocky-brush uplands, standing crops were less under all other overstory species than under blue oak. Data on species frequency suggest that her- bage species of later successional stages are more common under trees. The frequency of plant species varied with the species of overstory, and a diversity of overstory species may help to main- tain adequate species diversity among understory species. Key Words: annual grassland, blue oak, digger pine, herbage standing crops, live oak, species frequencies
Livestock grazing, fuelwood harvesting, land clearing, and foot- hill urbanizing all affect California’s oak-woodlands. Maintaining viable overstory populations is a prime concern of landowners, environmentalists, and State agencies. Altering the overstory structure would likely alter the understory structure, which in turn may alter wildlife and fish habitats. How different overstory spe- cies can affect understory plant communities needs to be under- stood.
Blue oak (Quercus douglasii) is the dominant tree species on most of the oak-woodland surrounding California’s Central Val- ley. Rangelands dominated by blue oaks are estimated to cover 1,178,OOO ha(Bolsinger 1987). Much of the blue oakarea is used to produce livestock (mainly beef). Livestock grazing herbage pro- duced under and around blue oaks, and they browse the oaks and eat acorns as well.
Blue oaks affect understory forage production and species com- position. Generally, in the southern part of its range, blue oak provides adequate green feed earlier and in greater amounts than in the open areas (Duncan 1967; Duncan and Clawson 1980; Holland
1976,198O). The effect may be especially striking during periods of drought (Duncan and Reppert 1960, Holland 1980, Frost and McDougald 1989). In the northern part of its range, herbage standing crops are lower under blue oaks than in the open (Barto- lome 1986,1987; Kay 1987; Kay and Leonard 1980). Differences in oak density and canopy cover help explain the disparity in response: southern stands are frequently less dense and have less
Authors are range scientist, Pacific Southwest Forest and Range Experiment Station (PSW), USDA Forest Service, 2081 E. Sierra, Fresno, Calif. 93710; research consultant, San Joaquin Experimental Range, California State University, Fresno, Calif. 93740; range technician (retired), PSW, USDA Forest Service, 2081 E. Sierra, Fresno, Cahf. 93710.
We thank all persons from the Pacific Southwest Forest and Range Experiment Station who were involved in collecting the data, but especially, J. Anderson and C. Bums (laboratory technicians); C. Conrad, C. Graham, M. Reed, and J. Reppert (range scientists); and E. Woolfolk (division chief/assistant director).
Manuscript accepted 14 September 1990.
306
overstory canopy cover than northern stands.
In southern stands, ripgut brome (Bromus diandrus) and wild oats (Avena fatua) generally comprise more of the herbage (by weight) under blue oaks than in open grassland (Holland 1980). However, soft chess (B. mollis), foxtail fescue (Vulpia megalura),
and broad-leaf filaree (Erodium botrys) generally comprise more of the herbage in open grassland than under blue oaks. In northern stands total grass cover is greater in open areas than under blue oaks, and ripgut brome as well as soft chess cover increase where trees are removed (Kay 1987). In contrast, little is known about the relationships of other oak-woodland overstory species to under- story herbage.
In 1961 a study of 3 grazing regimes was started at the USDA Forest Service’s San Joaquin Experimental Range, north of Fresno in Madera County, California. Major associates of blue oak at the Experimental Range are interior live oak (Q. wislizenii),
digger pine (Pinus sabiniana), and buck brush (Ceanothus cunea- tus). Buckeye (Aesculus californica), Mariposa manzanita (Arc- tostaphylos mariposa), chaparral coffeeberry (Rhamnus califor- nica cuspidata), and hollyleaf coffeeberry (R. crocea ilicifolia) are common (Larson et al. 1985).
This paper reports a by-product of data from more than 8,000 plots sampled during the study at the Experimental Range that helps our understanding of how different overstory species affect herbage species and peak standing crops. The findings provide land managers greater information upon which to base overstory manipulations.
Methods Setting
The San Joaquin Experimental Range occupies about 1,862 ha of oak-woodland,in the Sierra Nevada foothills. Elevations range from 213 to 518 m. Winters are relatively cool and wet; summers are hot and dry. Annual precipitation averages 48.3 cm. The wet- test months are December (8.6 cm), January (8.3 cm), and Febru- ary (8.6 cm). July and August are the driest months with 2.5 mm each. January is the coldest month with average temperatures of 11.8“ C (maximum) and 0.7” C (minimum). July is the hottest month with average temperatures of 36.7” C (maximum) and 16.2” C (minimum).
Weather produces 3 characteristic forage seasons (Bentley and Talbot 195 1). The “inadequate green*‘season begins after fall rains stimulate seed germination. During that forage season, environ- mental conditions usually limit plant growth. The “adequate green” season begins in January or February when major grass species are 5 to 8 cm tall. During that forage season, growth so accelerates that livestock cannot use all the herbage produced. The “dry” season begins when soil water becomes depleted in May or June. As the adequate green season ends and the dry season begins, the annual plants produce seed and die.
Soil type and depth, slope, and exposure along with weather are the major determinants of herbage production. Major range sites at the Experimental Range comprise 6% swales, 11% open-rolling uplands, and 83% rocky-brushy uplands of the area (Bentley and Talbot 1951, Caldwell et al. 1985, Gaylord 1972). Soil textures are coarse study loams, with soil depth and herbage production
decreasing and granitic rock volume and slope increasing from the swales to the brushy uplands.
Data Source
The study ( 196 I- 1968) at the Experimental Range was designed to compare livestock and herbage responses to repeated seasonal, rotated seasonal, and continuous grazing on unfertilized pastures and continuous grazing on pastures fertilized with elemental sul- fur. Livestock responses to the grazing regimes showed continuous grazing to be best for cow-calf production (Ratliff 1986). Fertiliza- tion did not increase the standing crop on swale sites, but increased it on open-rolling and rocky-brushy upland sites; and fertilization increased soft chess and ripgut brome on all sites (Caldwell et al.
1985). While repeated seasonal grazing altered the contribution of individual species, peak standing crops were not affected by graz- ing system (Richard M. Caldwell, John W. Menke, and Don A. Duncan, unpublished manuscript provided the authors by John W. Menke).
In the study, plots 0.1 m2 (30.5 X 30.5 cm) were systematically laid out along 6 randomly located permanent transects across each of 8 pastures but allocated to have 25 in swales, 18 in open-rolling uplands, and 70 in rocky-brushy uplands. The plot locations were protected with a San Joaquin cage (Westfall and Duncan 1961) and moved a random distance each year to avoid repeated sam- pling of the same areas.
The overstory, including “open”(no overstory), at each plot was recorded during sampling. Sample sizes for each overstory there- fore depended on the number of plots occurring under the cano- pies. Overstory species identified separately were: blue oak, inte- rior live oak, digger pine, and buck brush-including chaparral whitethorn (C. leucodermis). All other overstory species were grouped.
Plots were sampled for herbage biomass and species frequency when standing crops peaked. Herbage in each plot was harvested, oven dried and weighed. Frequency was determined as the propor- tion of quadrats where a species was the first hit by or nearest to one or more points. A quadrat consisted of a frame of 5 points.
Species composition based on that data was not computed because estimates of point frequency using “nearest-plant hits”are biased. The probability of selection depends on species abundance and spatial distribution and a variable plot size.
Grass species and groups identified were soft chess, ripgut brome, slender wild oats (A. barbat& Australian chess (B. arena- rius), red brome (B. rubens), Mediterranean barley (Hordeum hystrix),, annual fescue (Vulpia spp.), and other grasses. Other plant species and groups identified were grasslikes ( Curex spp. and Juncus spp.), broad-leaf filaree, other broad-leaves, Spanish clover
(Lotus purshiunus), clover ( Trifolium spp.), and other legumes. Analyses
The 1961-1968 study was not specifically designed to address overstory/understory relationships. Analysis of those relation- ships using the factorial design of the study was judged, therefore, to be inappropriate. The data from the study were pertinent, nevertheless, and a source of information impossible or prohibi- tively expensive to duplicate.
Each data case was considered to be an independent observa- tion; and, because of known effects, data from the fertilized pas- tures were analyzed separately. Standing crop data were grouped, by range site and overstory species over all pastures over all years. Frequency data were grouped by overstory species over all range sites, pastures, and years.
For each range site, the null hypothesis that there are no differ- ences in mean standing crops among the various overstory species was tested by one-way analysis of variance. The 95% confidence intervals for pair-wise differences among overstory species means
5000
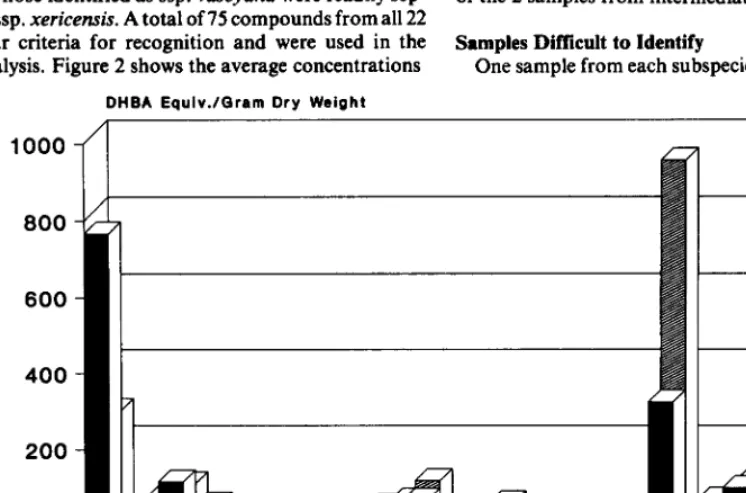
Fig. 1. Average peak herbage standing crops by overstory species on upland and swalc range sites at the San Jorqtin Experimental Range, 1%1-l%& Within fertilixer treatments, within range sites, columns with the same letter do not differ significantly (P<O.OS) by Tukey’s w- procedure. An X = 1 plot, therefore, the variance could not be estimated.
were determined by Tukey’s “w-procedure”modified to correct for the numbers of observations in the 2 means being compared (Steel and Torrie 1960). Differences between overstory species in stand- ing crops were expressed as (Xl - X2) f w.
We estimated the frequencies (p q nij/nj) of each herbaceous
species by overstory species, in which, nil is the number of quadrats where species (i) occurred under overstory (i), and nj is the number of quadrats under overstory (i). In those cases where nG = 1, p was not estimated. We tested the hypothesis of no difference in fre- quencies of a herbaceous species under 2 overstory species (pr = pe) using the 95% confidence interval (CI) for the difference, pl - pz. We followed the procedure of Dixon and Massey (1957) in com- puting the CI when p(ni) and q(nG) were above 5 for both overstory species. When the CI did not include zero, we rejected the hypothesis.
Results and Discussion Herbage Standing Crops
On unfertilized swales, the average standing crop in the open areas was greater than under live oaks or digger pines but no greater than under blue oaks (Table 1, Fig. 1). Interpretation of the 95% confidence interval for the difference between the open and blue oak overstory, nevertheless, suggests that actual standing crops in open areas were greater. We are 95% confident that any true difference favoring the open was at most 1,660 kg/ ha (63 1 + 1,029 kg/ ha), and that any true differences favoring the blue oak overstory was at most 398 kg/ ha (631 - 1,029 kg/ ha). At those extremes, a difference in favor of the open would be biologically important, but for blue oaks would not be.
Table 1. Average peak berbage standing crops and their differences (expressed as 95% confidence intervals) by overstory species for unfertilized swales, and open-rolling, and rocky-brushy uplands at the San Joaquin Experimental Range, Madera County, California, 1961-1968.
Overstory species (sample size)
All types (1597) Open (1499) Blue oak (34) Live oak (49) Digger pine (14) Buck brush (I)2
All types (1221) Open (I 130) Blue oak (71) Live oak (14)
Digger pine (5) 2871 f 2058 Buck brush (1)2 2844
Average Differences in standing crops (e.g., open-blue oak)
production Blue oak Live oak Digger pine Buck brush Other
---_______________________________kg/ha_---_-_______________________________ Swales
4214 f 114
4295 f II9 361 f 1029 1550 f 861*’ 2069 f 1593*
3664 f 685 919 f 1324 1438 f 1884
2745 f 434 519 + 1799
2226 f 956 1604
Open-rolling uplands 3144 f 108
3118 f 111 -683 f 603* 1104 f 1325 248 f 2209
3802 f 510 1788 f 1441; 931 + 2280
2014 f 1084 -857 f 2567
All types (4533) Open (3600) Blue oak (270) Live oak (386) Digger pine (203) Buck brush (52) Other (22)
‘Asterisk indicates that herbaae production under the overstorv in the column differs significant (P<O.O5) by Tukey’s w-procedure from that under the overstory at the left.
Rocky-brushy uplands 2061 f 40
2070 f 45 -758 f 245* 351 IIZ 209, 439 f 281* 165 f 544 532 f 832
2828 f 184 1109 It 309* 1197 f 362’ 922 f 589’ 1289 f 862’
1719 f 116 88 f 337 -186 f 574 181 f 852
1631 f 145 -274 f 604 93 f 873
1905 f 327 367 f 898
1538 f 317
295% confidence interval was 6oi estimated.
During drought, however, live oaks and digger pines may produce opposite effects (Frost and McDougald 1989). The result of no difference in standing crops under buck brush and in the open agrees with that reported by Gaylord and Westfall (1971).
The results for unfertilized pastures generally agree with what we expect for herbage standing crops at the Experimental Range. We would expect swales to have higher peak standing crops where they receive full sunlight. They have relatively deep alluvial soils (Talbot et al. 1942) and receive runoff water as well as normal amounts of precipitation. Open-rolling and rocky-brushy uplands have rela- tively shallow, coarse textured soils. Their water holding capacities are low and water quickly percolates through the soil (Talbot et al. 1942). On those range sites, blue oak trees produce a microhabitat more favorable to herbage production than open areas. Soil under blue oaks has more humus, greater water holding capacity, and a better nutrient status. The tree canopies also moderate soil temper- atures and slow drying (Holland 1980).
As to why standing crops under live oaks and digger pines may be less than under blue oaks or in the open, live oaks shade the soil all year and tend to grow in dense groups. They could effectively reduce light levels (Parker and Muller 1982) and photosynthesis by herbaceous plants. Coniferous leaf litter, which tends to be more fibrous and more acid, is more resistant to decomposition than dicotyledonous litter (Millar 1974). A heavy accumulation of litter under digger pines could lower emergence rates, or soil chemistry could inhibit germination of some species, or both. The shade provided by live oaks and possibly digger pines, however, may be more beneficial than harmful for herbage production during drought (Frost and McDougald 1989).
No significant overstory effects were found on the fertilized pastures (Fig. 1). While this situation may result partly from sam- ple size, the effect of the fertilizer may have been to improve the soil nutrient status under the different overstory types relative to each other, and thereby even out differences in standing crops. That effect was evident among sites in the fertilized and unfertilized continuously grazed pastures (Caldwell et al. 1985). With fertiliza- tion, standing crops averaged the same in swales, 16% greater on
308
open-rolling upland, and 36% greater on rocky-brushy upland than without it.
Compared with the situation in the unfertilized pastures, any actual fertilizer effects may reduce standing crops in open areas relative to blue oaks on swales but increase them on open-rolling and rocky-brushy uplands. For the fertilized and unfertilized pas- tures average standing crops in the open, expressed as percentages of those under blue oaks, were as follows:
Swales Upland
Open-rolling Rocky-brushy
Species Frequencies
Fertilized Unfertilized percent
86 II7
116 82
84 73
Grazing, soil properties, the kind of overstory, and the degree of micro-climate moderation all influence herbaceous species fre- quencies and abundances. In the shade of coast live oak (Quercus
agrifolia), wild oats cover, frequency, and dry weight were less than in the open (Parker and Muller 1982). At the University of Califor- nia’s Hopland Field Station, percentages of composition (based on 50 points per plot) were higher for ripgut brome and annual fescue under blue oaks and higher for soft chess and broad-leaf filaree in the open (Bartolome 1986). Broad-leaf filaree was not found in the understory, while blue oak canopy did not affect slender wild oats or other broad-leaf plants. Herbage composition within overstory species differed less between annual grass/ woodland ranges than between open areas and those with trees at each study location (Bartolome 1987).
Similar overstory influences on the herbaceous species were evident at the Experimental Range (Fig. 2). While obviously not equally frequent, all species or groups were found in the open on fertilized and unfertilized range. Under each overstory species, however, one or more understory species or groups appeared to have restricted distributions by being absent or infrequent. For example, Mediterranean barley and grasslikes seldom grew under
Fig. 2. Herbaceous species frequencies on unfertilized and fertilized range by overstory species at the San Joaquin Experimental Range, 1961-1968. Within a herbaceous species or group, frequencies with the same letter do not differ between overstory species. The 95% confidence interval (I) for pt - p2 covered zero. An x means that either p(nii) or q(nti) was 5 or less and that the CI was not computed; n is the number of quadrats where species (i) occurred under overstory 0.
the trees.
The data suggest that at the Experimental Range blue oaks, live oaks, and digger pines moderate the environment to favor species of later successional stages. Wild oats, soft chess, and ripgut brome belong to later successional stages on California’s annual grass-
lands (Sampson et al. 195 1). Clovers, annual fescues, and filaree belong to mid-successional stages; and red brome and other broad- leaved plants belong to early stages.
Compared with open areas, overstory species on unfertilized pastures at the Experimental Range had the following effects (positive = more and negative = less frequent than expected by chance) on understory plant frequencies (Fig. 2):
Overstory species Understory plant Blue oak Live oak Digger pine Slender Wild oats Positive Positive Positive Soft chess Positive
Ripgut brome Positive Positive Positive
Australian chess Negative
Other grass Positive
Clovers Negative
Spanish clover Negative
Annual fescues Negative Positive
Broad-leaf filaree Negative Negative Negative Other broad-leaf Negative
Buck brush enhanced the growth of annual fescues, but did not reduce that of soft chess and broad-leaf filaree and increase the growth of ripgut brome, as reported earlier by Gaylord and West- fall (1971).
Compared with blue oaks, other overstory species on unfertil- ized pastures at the Experimental Range had the following effects on understory plants (Fig. 2):
Overstory species Understory plant Live oak Digger oak Buck brush Slender Wild oats Positive
Ripgut brome Negative
Australian chess Negative
Clovers Negative
Annual fescues Positive Positive Positive Broad-leaf filaree Negative
Other broad-leaf Positive Positive
Compared with live oaks, digger pines and buck brush at the Experimental Range had negative effects on ripgut brome. Digger pines had a positive effect on the annual fescues.
Conclusions
On or near the San Joaquin Experimental Range, woody plant harvest or control intended to increase herbage production should concentrate on species other than blue oak. Except in the swales, blue oaks can increase peak standing crops. At least on some range sites live oaks and digger pines reduce peak standing crops com- pared with open areas. Moreover, all overstory species reduce peak standing crops compared with blue oaks on the rocky-brushy uplands.
A diversity of overstory species may help to maintain adequate species diversity among understory species. Different herbaceous species appear to be favored by different overstory species. For example, the group “other grasses” was more frequent under live oaks than in the open. And on shallow soils, digger pines may help maintain species of later successional stages. Therefore, planning of woody plant harvests should carefully consider long-term main- tenance of overstory species populations, and maintenance of the understory plant pool.
Literature Cited
Bartolome, J.W. 1986. Herbaceous productivity in oak woodland, p. I l2- 116. In: Kie, J.G., and W.F. Laudenslayer, Jr. (eds.). Transactions of the western section of the Wildlife Society, Vol. 22; 1986 Jan. 23-25; Sparks, Nev.
Bentley, JR., and M.W. Talbot. 19Sl. Efficient use of annual plants on cattle ranges in the California foothills. USDA, Washington, D.C. Circ. 870.
Bolsinger, C.L. 1987. Major findings of a statewide resource assessment in California, p. 291-297. In: T.R. Plumb and N.H. Pillsbury (tech. coords.). Proc. symp. on multiple-use management of California’s hardwood resources; 1986 Nov. 12-14; San Luis Obispo, Calif. Gen. Tech. Rep. PSW-100. USDA, Forest Serv., Pacific Southwest Forest and Range Exp. Sta., Berkeley, Calif.
Caldwell, R.M., J.W. Menke, and D.A. Duncan. 1985. Effects of sulfur fertilization on productivity and botanical composition of California annual grassland. J. Range Manage. 38:108-l 13.
Dixon, W.J., and F.J. Massey, Jr. 1957. Introduction to statistical analysis. 2nd ed. McGraw-Hill, Inc., New York.
Duncan, D.A. 1967. Blue oak canopy effect on herbage yield of central California foothill rangeland, p. 61-62. In: Abstr., 20th Annu. Meeting, Amer. Sot. Range Manage., Seattle, Wash.
Duncan, D.A., and W.J. Clawson. 1980. Livestock utilization of Califor- nia’s oak woodlands, p. 306-313. In: T.R. Plumb (tech. coord.). Proc. symp. on the ecology, management, and utilization of California oaks; 1979 June 26-28; Claremont, Calif. Gen. Tech. Rep. PSW-44. USDA, Forest Serv., Pacific Southwest Forest and Range Exp. Sta., Berkeley, Calif.
Duncan, D.A., and J.N. Reppert. 1960. A record drought in the foothills. Misc. Paper 46. USDA, Forest Serv., Pacific Southwest Forest and Range Exp. Sta., Berkeley, Calif.
Frost, W.E., and N.K. McDougald. 1989. Tree canopy effects on herbaca ous production of annual rangeland during drought. J. Range Manage. 42281-283.
Gaylord, V.J. 1972. A method for the correlation of range sites with land association classes in the Sierra foothills. M.S. Thesis, California State Univ., Fresno.
Gaylord, V.J., and S.E. WestfaR 1971. Wedgeleaf ceanothus canopy does not affect total herbage yield. Res. Note PSW-253. USDA, Forest Serv., Pacific Southwest Forest and Range Exp. Sta., Berkeley, Calif. Holland, V.L. 1976. In defense of blue oaks. Fremontia 43-8.
Holland, V.L. 1980. Effect of blue oak on rangeland forage production in central California, p. 314-318. In: T.R. Plumb (tech. coord.). Proc. symp. on the ecology, management, and utilization of California oaks; 1979 June 26-28; Claremont, Calif. Gen. Tech. Rep. PSW-44. USDA, Forest Serv., Pacific Southwest Forest and Range Exp. Sta., Berkeley, Calif.
Kay, B.L. 1987. Long-term effects of blue oak removal on forage produc- tion, forage quality, soil, and oak regeneration, p. 351-357. In: T.R. Plumb and N.H. Pillsbury (tech. coords.). Proc. symp. on multiple-use management of California’s hardwood resources; 1986 Nov. 12-14; San Luis Obispo, Calif. Gen. Tech. Rep. PSW-100. USDA, Forest Serv., Pacific Southwest Forest and Range Exp. Sta., Berkeley, Calif.
Kay, B.L., and O.A. Leonard. 1980. Effect of blue oak removal on her- baceous forage production in the North Sierra Foothills. p. 323-328. In: T.R. Plumb (tech. coord.). Proc. symp. on the ecology,management, and utilization of California oaks; 1979 June 2628: Claremont. Calif. Gen. Tech. Rep. PSW-44. USDA, Forest Serv., ‘Pacific Southwest Forest and Range Exp. Sta., Berkeley, Calif.
Larson, J.H., J. Stebbins, and W.L. Porter, Jr. 1985. A revised checklist of the plants of the San Joaquin Experimental Range. CATU850303. California Agr. Technol. Inst., Fresno, Calif. -
Millar. C.S. 1974. Decomuosition of coniferous leaf litter. n. 105-128. In:
C.H. Dickinson and G:J.F. Pugh (eds.), Biology of plait litter decom- position, Vol. 1. Academic Press, New York.
Parker, V.T., and C.H. Muller. 1982. Vegetational and environmental changes beneath isolated live oak trees (Quercus agrifoliu) in a Califor- nia annual grassland. Amer. Midl. Natur. 107:69-81.
R&lift, R.D. 1986. Cattle responses to continuous and seasonal grazing of California annual grassland. J. Range Manage. 39:482485.
Sampson, A.W., A. Chase, and D.W. Hedrick. 1951. California grasslands and range forage grasses. Univ. Calif., Berkeley. Bull. 724.
Steel, R&D., and J.H. Torrie. 1960. Principles and procedures of statis- tics. McGraw-Hill, Inc., New York.
Talbot, M.W., J.W. Nelson, and R.E. Storie. 1942. The experimental area.
p. 7-12. In: C.B. Hutchison, and E.I. Kotok (eds.), The San Joaquin Experimental Range. Univ. Calif., Berkeley. Bull. 663.
We&all, S.E., and D.A. Duncan. 1961. The San Joaquin cage. J. Range Manage. 14:355.
Should we Dial a-Satellite
to find your new address? Just sending us your new address along with an old label will probably get your journ; to you faster. (No criticism of satellites intended!) Send the information to Society for Range Management, 1839 York Street, Denver, Colorado 80206.Response of montane tall-forb communities to 2,4-D and
mixtures of 2,4-D and picloram
R.B. MURRAY, H.F. MAYLAND, AND G.E. SHEWMAKER
Abstract
Tall-forb communities occur on deep soils of the upper montane and subalpine zones of the Rocky Mountains and extend from southwestern Montana to southern Utah. In the Centennial Mountains of Montana, forbs comprise >80% of the annual yields, including 30-352 sticky geranium (Geranium viscosissi- mum) and 20-25% Potentilla spp. Tall-forb communities are rich
in species diversity and very productive, but many of the forbs are not palatable to grazing ungulates. Suppression of the less palata- ble species, like sticky geranium, would increase the forage value for grazing. In 1983 and 1984 adjacent plots were sprayed during weeks 1, 2, 3, and 4 in July, with 2,4-D[(2,4 Dichlorophe- noxy)acetic acid, isooctyl ester] applied at 1.1 or 2.2 kg Z&D/ha or 2.2 kg 2,4-D/ha plus 0.6 kg/ha of the potassium salt of picloram (4amino-3,5&richloropicolinic acid). Forage yields were mea- sured in August of 1984, 85, and 86. Total forage yields ranged from 2,700 to 3,000 kg/ha on the untreated areas. Forb yields were significantly reduced, especially by the 2,4-D + picloram treatment. Herbicide treatments applied during flower-stalk development to flrst fower of sticky geranium were most effective. Grass and sedge production partially compensated for reductions in forb yields. Interseeding of introduced species into herbicide treated plots in 1983 was unsuccessful. Forb and grass production is expected to return to levels similar to those on untreated areas after 5 years. Key Words: herbicides, geranium, potentilla, subalpine vegeta-
tion types, Elymus trachycaulur, Pachic cryoborall
Tall-forb communities, found in the upper montane and subal- pine zones, extend from the Centennial Mountains bordering Idaho and Montana in the north, eastward into Yellowstone National Park and the Big Horn Mountains. The type extends southward along the Idaho-Wyoming border, and into the Wasatch Mountains of Utah, terminating near Cedar City, Utah (Murray and Mayland 1990). Although not extensive in area, tall-forb communities are very important because of the forage produced, aesthetics provided, and for watershed protection. These plant communities are rich in species diversity, highly productive, and provide a nutritious diet for sheep (Buchanan et al. 1972). How- ever, some sites support a high proportion of unpalatable forb species.
On the U.S. Sheep Experiment Station summer range in the Centennial Mountains of Montana, tall-forb communities com- prise 29% of the usable area. In addition, the same species form the understory on a substantially larger area in open conifer and sagebrush (Artemisiu spp.) types. At one intensively studied area, grass and forb composition (dry weight basis) was 12 and 88%, respectively. Sticky geranium (Geranium viscosissimum Fisch. &
Authors are range scientist (retired), formerly with the USDA-Agricultural Research Service, U.S. Sheep Experiment Station, Dub&, Idaho 83423; research soil scientist and biological technician soils, USDA-AR& Kimberly, Idaho 83341.
We thank Dr. R.A. Evans (retired), formerly with the USDA-AR:, University of Nevada, Reno 89512 for proposing the chemicals to use and the expenmental design; Dr. B.E. Mackey, USDA-AR& WRRC, Albany, Calif. 94710and Dr. G.V. Richard- son, USDA-ART, Colorado State University, Fort Collins 80521 for assistance with the statistical design and analyses; Mr. D. Lucas, Clark County Agent, University of Idaho, formerly range technician, U.S. Sheep Experiment Station, Dubois 83423 for supervising data collection; Mr. S. Peebles, Fremont County Agent, University of Idaho, St. Anthony 83445 for supervising the spray application; and Mr. F. Gomm (retired), USDA-AR& Utah State University, Logan 84321 for providing seed and seeding the plots.
Manuscript accepted 27 September 1990.
C.A. Meyer) contributed 34% of the total herbage weight. Bucha- nan et al. (1972) found this species contributed less than 2% of sheep diets, while grasses and northwest cinquefoil (Potentilla gracilis Dougl.) each make up 20% or more of the diet during the summer.
If the amount of sticky geranium and other unpalatable species could be reduced and replaced by species of greater palatability, then the type would have a much higher forage value. Many species of high palatablity occur in tall-forb communities. Therefore, it is essential that any method used that controlled the target species, would have a minimal effect on the desirable species.
Murray (unpublished) noted that growth of sticky geranium begins as soon as the snow has melted (in June or July). Sticky geranium grows rapidly and frequently provides a protective can- opy over more palatable species like pale agoseris (Agoserisgluuca
[Pursh] Raf.) and leafybract aster (Asterfoliaceus Lindl.). Because of the tendency of sticky geranium to overgrow other species, it was hypothesized that herbicide sprays might suppress sticky geranium without causing severe damage to palatable species in the lower strata.
Mueggler and Blaisdell(l95 I) found that dense stands of mules- ear wyethia ( Wyethiu amplexicaulis Nutt.) were effective in shel- ter-ing other forb species from herbicide spray. Blaisdell and Mueggler (1956) reported that sticky geranium, western yarrow
(Achilles millefolium L.), yampa (Perideridia gairdneri [H.&A.] Math.), and two larkspur species (Delphinium spp. L.) were unharmed by 24-D (2,4-Dichlorophenoxyacetic acid), while sticky cinquefoil (Potentilla glandulosa Lindl.), northwest cinquefoil, and one-flowered helianthella (Helianthella unif2ora [Nutt.] T.&G.) sustained heavy damage, pale agoseris moderate damage, and groundsel (Senecio integerrimus Nutt.) light damage on areas sprayed for sagebrush control in eastern Idaho. Mead (1958) at the base of the Centennial Mountains on Crab Creek near Kilgore, Idaho, found that sticky geranium increased on sagebrush areas sprayed with 2,4-D and that cinquefoil was lightly damaged and fully recovered by the third year. Silvery lupine (Lupinusargenteus
Pursh.), another prominent member of the tall-forb type on some sites in the Centennials, was severely damaged by 24-D (Mead 1958). On the Bighorn National Forest in northcentral Wyoming, Hurd (1955) reported that pale agoseris was heavily damaged and leafybract aster was moderately damaged by 24-D. In spite of reported results it was felt that not enough was known about rates and time of application to rule out use of 24-D in the tall-forb type. The primary objectives of this study were to (1) evaluate the effects of applying herbicides during the early growth of tall-forb vegetation as a means of improving the overall forage value for sheep (specifically to determine effects on sticky geranium, the target species, and the more palatable forbs), and (2) evaluate effects of 2,4-D applied at 2 rates (1.1 and 2.2 kg/ ha) and 2,4-D + picloram applied at a single rate (2.2 and 0.6 kg/ ha, respectively), and most importantly (3) estimate the time required for the type to recover from herbicide treatment.
Study Area and Methods
1981
c
E
4
3 160
E E
120
0 $
80
_XO_4K,?____________
s 4o
I 0 Z
8
3
I1983160 t 120
__K?!X.!&a_________ -__---__ 80
---~~---____ --- 40
0
JUN 1 JUL 1 AUG 1 SEP
1984
I
1985
1986
JUN 1 JUL 1 AUG 1 SEP 1
Fig. 1. Volumetric soil water (mm/460 mm depth) contents, 100 and 1,500 kpe tenShI% end daaY prwipitetioo (mm) for the period June-September (1981-1986) at a site adjacent to herbicide research plots on the U.S. Sheep Experiment Station summer range, Centennial Mountains, Monteog.
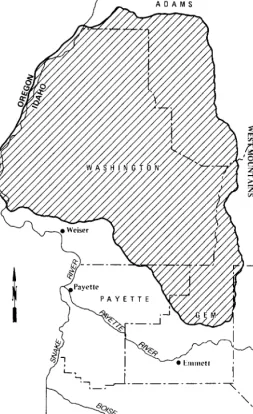
Mountains of southwestern Montana. The geographic description is 111’ 46’W, 44’ 32’N and legal description is T14N R2W Set 13 in Beaverhead County, Montana. The study area faces northward, has a slope of 20%, and lies at an elevation of 2,380 m. Annual precipitation is estimated to be >750 mm with the majority occur- ring as snow. Summer precipitation during the study period is shown in Figure 1. Measured seasonal totals were 47,115,3 11,254, 171, and 155 mm precipitation for the 1981 through 1986 summer periods. Air temperatures average less than 5” C annually, but average air temperatures over a lOO-day summer period were about 12O C (Fig. 2).
Soils are of the Pachic Cryoborall, loamy-skeletal, mixed, 16 to 30% slope (Tippy et al. 1978). The upper surface horizon is a dark brown loam, black when moist, and is approximately 18cm thick. The lower part is a very dark grayish brown moist loam, about 3O-cm thick. The upper subsoil is a dark grayish brown moist loam, about IO-cm thick, and the lower part is a grayish brown moist loam, about 20cm thick. The substratum is a pale brown or light gray moist loam at least 25-cm thick. Where Argic Cryoboralls are included, the substratum is usually a yellowish brown gravelly loam about 30-cm thick that grades into fractured bedrock of mixed sedimentary origin. Our data indicate the Pachic Cryoborall contains 45,35, and 30 g/kg of organic carbon, and C:N values are
312
12.8,12.5,and 11.5fortheO to 15,15 to 30,and 30to45cmdepths, respectively.
Permeability of this soil is moderate and the available water holding capacity is high. The surface runoff is medium and the erosion hazard severe (especially when denuded of vegetation). The effective rooting depth is 73 to 79 cm, although some tap rooted species penetrate to a much greater depth. The compaction hazard is moderate. The potential plant community produces in excess of 2,000 kg/ ha of dry forage in average years.
The principal grasses found on the study area are slender wheat- grass (Elymus truchycaulus [Link] Gould ex Skinners) (Dewey 1984), mountain brome (Bromus curinatus Hook. & Am.), purple oniongrass (Melicu spectabilis Scribn.), alpine timothy (Phleum ulpinum L.), and spike trisetum (Trisetum spicutum [L.] Richter). Occasional grasses and sedges include nodding bluegrass (Pou reji’exu Vasey & Scribn.), Letterman’s needlegrass (Stipu letter- mannii Vasey), western needlegrass (Stipu occidentalis Thurb.), and Raynolds sedge (Curex ruynoldsii Dewey). The predominant desirable forbs include pale agoseris; asters (Aster spp. L.), which include Engelmann aster (Aster engelmunnii (Eat.) Gray), leafy- bract aster, and thickstem aster (A. integrifolius Nutt.); stickseed
(Huckeliufloribundu [Lehm.] Johnst.); northwest cinquefoil; and groundsels (Senecio spp. L.), which include lambstongue groundsel
25
G
20
e
2 15
3
-6
& 10
E
z
5
0
-5
JUN JUL AUG SEP OCT AVG
Fig. 2. Maximum and minimum (black-shaded) temperatures (” C) for the June-October period for 1981-1986 at the U.S. Sheep Experiment Station summer range, Centennial Mountains, Montana. Elevation 2,449 m. The NA notation indicates not available.
(S. integerrimus Nutt.), cutleaf groundsel (S. serru Hook.), and The experimental design included 3 herbicide treatments applied arrowleaf groundsel (S. triangularis Hook.). The less desirable at 4 weekly intervals in July, plus untreated checks. The 13 treat- species of forbs include western yarrow, duncecap larkspur (Del- ments were randomized on plots in each of 3 blocks. Herbicides’
phinium occidentale Wats.), sticky geranium, silvery lupine, tar- and rates were the isooctyl ester of 24-D at 1.1 kg/ ha, 24-D at 2.2 weed (Madia glomerata Hook.), sticky cinquefoil, and western kg/ ha, and 24-D at 2.2 kg/ ha plus the potassium salt of picloram coneflower (Rudbeckiu occidentalis Nutt.). The more important (4amino-3,5,6-trichloropicolinic acid) at 0.6 kg/ ha. These were annual forbs, aside from tarweed, include northern fairy-candelabra applied on 5, 13,20, or 27 July 1983 and 5, 11, 18, or 25 July 1984.
(Androsace septentrionalis L.), littleflower collinsia (Collinsia Areas treated in 1983 and 1984 were adjacent. The herbicides were
parvtj7oru Lindl.), spring verna (Druba verna L.), thinleaf bed- applied in a total volume of 94 L/ha in a water carrier containing straw (Galium bifolium Wats.), and mountain knotweed (Polygo- 0.2% non-ionic surfactant with a 6-nozzle backpack sprayer using
num douglasii Greene). Although the latter species is not abund- carbon dioxide as a propellent. ant, it is important in the sheep diet on this range (Buchanan et al.
1972). 1
Mention of pesticides or proprietary products does not constitute an endorsement or recommendation for use by the USDA. Use of a restricted pesticide requires that the applicator have appropriate licensing.
2500
Grasses
,-i i
0 t’s’-‘-‘*‘*’
190 185 190 195 200 205 210
Day of Year 1983
Forbs
/ f
Grasses
180 185 190 195 200 205 210 Day of Year 1984
Elymus trachycaulus Bromus carinatus Melica spectabilis Phleum alpinum Trisetum spicatum Agoseris glauca Aster species
Delphinium occidentale Geranium viscosissimum Hackeliajloribunda Lupinus argenteus Potentilla gracilis Rudbeckia occidentalis Senecio species
Table 1. Phenological stages of some principal grass1 and forW species in 1983 and 1984. Data from U.S. Sheep Experiment Station summer range, Centennial Mountains, Montana.
______________1983_______________ Jul Jul Jul Jul Aug Aug Aug Aug
6 12 19 26 3 9 16 23 1.0 1.0 1.3 3.0 3.8 4.5 5.0 5.0 1.0 1.0 1.7 3.0 4.0 4.5 5.0 5.0 2.7 2.9 4.0 4.8 5.0 5.0 6.2 7.5 1.0 1.0 1.1 1.8 1.8 1.8 3.3 3.3 1.0 1.0 1.2 1.2 1.6 1.7 1.7 4.4 1.0 1.0 1.0 1.1 1.5 1.5 2.9 2.9 1.0 1.1 1.7 1.8 1.9 2.0 2.2 2.8 1.0 1.0 1.0 1.0 1.0 1.0 1.3 1.7 1.7 1.8 2.0 3.0 4.0 4.0 4.7 5.0 2.2 2.5 3.6 3.6 5.0 5.0 6.1 6.2 1.6 1.6 1.6 1.7 1.7 2.5 2.5 2.5 1.0 1.2 1.6 2.5 3.1 4.0 4.5 5.0 1.0 1.0 1.0 1.0 1.0 1.3 1.3 1.3 1.0 1.0 1.0 1.3 1.7 1.7 1.7 1.7 _________ __1984___________
Jul Jul Jul Jul Aug Aug 5 13 19 26 3 18
Elymus trachycaulur 1.5 1.5 2.3 3.5 4.0 5.5 Bromus carinatus 1.5 2.1 3.4 4.0 4.0 5.5 Melica spectabilis 2.8 3.5 4.3 4.8 5.3 5.5 Phleum alpinum 1.7 3.3 3.8 4.8 5.3 5.5 Wsetum spicatum 1.7 2.2 5.2 5.2 5.5 5.5 Agoseris glauca 1.5 1.5 2.1 2.6 2.6 3.3 Aster species 1.5 1.6 2.0 2.0 2.1 3.3 Delphinium occidentale 2.0 2.0 2.4 3.8 4.8 5.0 Geranium viscosissimum 2.0 2.1 3.1 3.1 4.1 4.8 Hackeliajloribunda 2.5 3.6 3.9 4.5 5.2 6.5 Lupinus argenteus 1.9 1.9 2.5 2.9 4.0 4.0 Po tentilla gracilis 1.5 1.5 2.1 2.2 3.1 4.9 Rudbeckia occidentalis 1.5 3.0 3.0 3.0 3.0 4.2 Senecio species 1.0 3.0 3.0 3.0 3.2 4.0
‘Growth stage of grasses: 1, Growth started; 2, Plower stalks appear; 3 Heads showing; 4, Heads fully out; 5, Plowers in bloom; 6, Seed ripe; 7, Seed disset&ting; 8, Seed 90% disseminated; 9, Plants drying.
lGrowth stage for forbs: I, Growth started; 2, Plower stalks showing; 3,1st flowers in bloom; 4, In full bloom; 5, Blooming over; 6, Seed ripe; 7, Seed disseminating; 8, Seed disseminated; 9, Plant drying.
60
50
E 40
z .E 30 i e 9 20
10
0
Individual plots were 5.5 by 9.1 m. The upper 5.8 m of each plot was used for collecting samples. The lower 3.3 m of each plot was used for a fall over-seeding trial in 1983 for the purpose of reducing erosion, should the herbicide kill most existing vegetation.
Ten to 20 circular 0.45-m* plots were clipped at ground level to estimate herbaceous standing production at each time of spray application. The plant material was first air-dried and then oven- dried at 70” C for 48 hr and weighed.
Soil samples collected from 0 to 15, 15 to 30, and 30 to 46-cm depths were air-dried and passed through a 2-mm sieve. Prewetted subsamples were subjected to matric suctions of 10,100,340,1,070 or 1,500 kPa using a pressure plate apparatus (Klute 1982). Water retentivity was detepined gravimetrically after drying at 106“ C for 24 hr. Subsamples were also analyzed for organic carbon using the Walkely-Black procedure 9-57 (Jackson 1982) and total nitro- gen using a micro-Kjeldahl procedure 3 l-3 (Bremner and Mulva- ney 1982). Bulk density was determined on cores extracted at 6-cm increments to a depth of 48 cm. Soil water contents were deter- mined gravimetrically each week from the adjacent growth study location during the summer (1983-1986) and were converted to volumetric water.
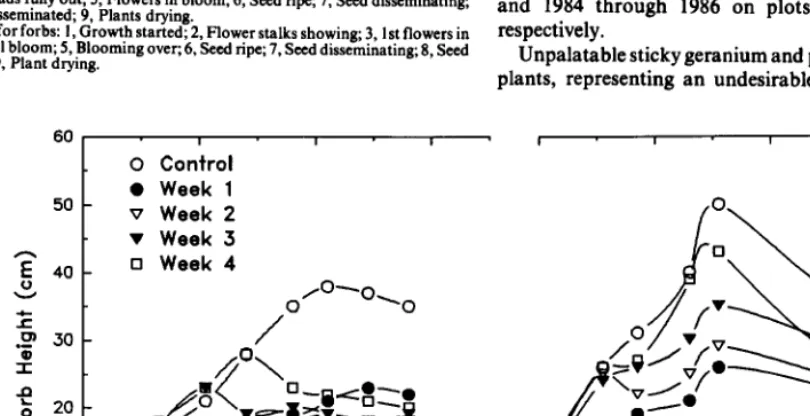
Average forb canopy height (cm) was determined by making 25 random measurements, to the top of each forb encountered, along each plot edge at approximately weekly intervals throughout the summers of 1983 through 1986 on areas treated in 1983; and 1984 through 1986 on areas treated in 1984. These data estimate the effects of treatment on the average growth of surviving forbs.
Stages of plant growth were recorded on untreated plots for 10 plants of slender wheatgrass, mountain brome, purple oniongrass, alpine timothy, spike trisetum, pale agoseris, asters, sticky gera- nium, stickseed, silvery lupine, northwest cinquefoil, western cone- flower, and groundsels (if present) in the plot. The stages were developed by J.F. Pechanec (ca. 1935) and have been used exten- sively at the U.S. Sheep Experiment Station (see footnotes 1 and 2, Table 1 for growth stages of grasses and forbs). The stages were recorded periodically during the summers of 1983 through 1986 and 1984 through 1986 on plots treated in 1983 and 1984, respectively.
Unpalatable sticky geranium and palatable northwest cinquefoil plants, representing an undesirable and desirable species, were
0
Conirol
I I
l Week 1 v Week 2 v Week 3 q Week 4
200 220
Day of Year 1983
240
I
I II I .
I I180 200 220 240
Day of Year 1984
Fig. 4. Forb height growth (cm) in response to time of herbicide application in 1983 or 1984. Vertical lines designate date of application. The LSD for the lnsl day of measurement was 2.6 cm in 1983 and 3.0 cm in 1984. Data from U.S. Sheep Experiment Station summer range, Centennial Mountains, Montana.
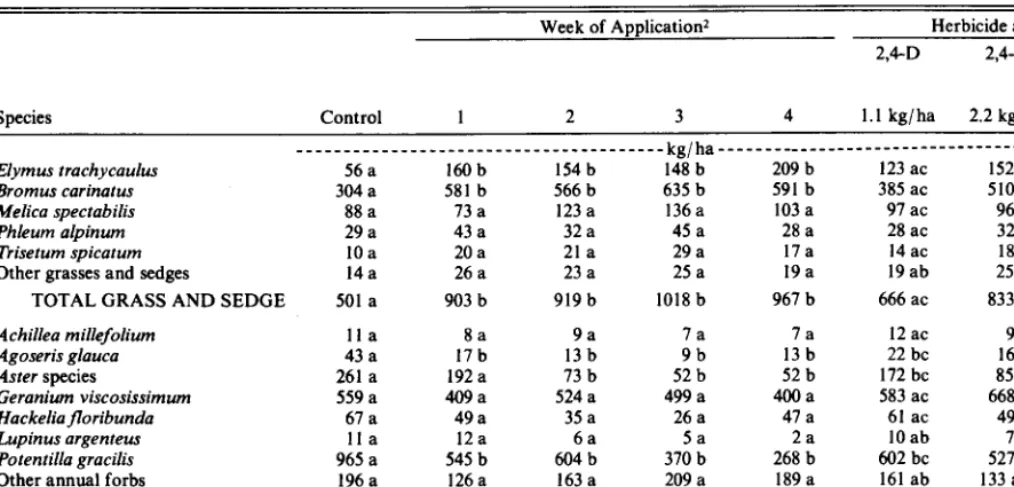
Table 2. Yields’ by species averaged over 1984-1986 for untreated or herbicide sprayed plots in 1983. Data from U.S. Sheep Experiment Station summer range, Centennial Mountains, Montana.
Week of Application* Herbicide and Rate 2,4-D 2,4-D 2,4-D +
Picloram 2.2 +
Species Control 1 2 3 4 1.1 kg/ha 2.2 kg/ ha 0.6 kg/ ha
_______________________________________kg~ha-____________---
Elymus trachycaulus 56 a 160b 154b 148 b 209 b 123 ac 152 bc 228 bd
Bromus carinatus 304 a 581 b 566 b 635 b 591 b 385 ac 510 ac 885 bd
Melica spectabilis 88 a 73 a 123a 136a 103 a 97 ac 96 ac 135 ad
Phleum alpinum 29 a 43 a 32 a 45 a 28 a 28 ac 32 ac 51 bd
Trisetum spicatum 10a 20 a 21 a 29 a lla 14ac 18ac 33 bd
Other grasses and sedges 14a 26 a 23 a 25 a 19a 19ab 25 ab 26 ab
TOTAL GRASS AND SEDGE 501 a 903 b 919 b 1018 b 967 b 666 ac 833 bc 1358 cd
Achilles millefolium 11 a 8a 9a 7a 7a 12 ac 9 ac 2 bd
Agoseris glauca 43 a 17b 13b 9b 13b 22 bc 16bc 1 bd
Aster species 261 a 192a 73 b 52 b 52 b 172 bc 85 bd 20 be
Geranium viscosissimum 559 a 409a 524 a 499 a 400a 583 ac 668 ac 123 bd
Hackeliajloribunda 61 a 49a 35 a 26 a 47 a 61 ac 49 ac 8 bd
Lupinus argenteus 11 a 12a 6a 5a 2a 1Oab 7 ab 1 ac
Potentilla gracilis 965 a 545 b 604b 370 b 268 b 602 bc 527 bc 211 bd
Other annual forbs 196a 126a 163a 209 a 189a 161 ab 133 abc 221 abd
Other perennial forbs 101 a 75 a 131 a 95 a 91 a 143 ab 99 abc 51 ac
TOTAL FORBS 2214 a 1433 b 1558 b 1212 b 1069 b 1766 bc 1593 bc 638 bd TOTAL VEGETATION 2715 a 2336 b 2471 a 2290 b 2036 b 2432 bc 2426 bc 1996 bd
‘An orthogonal comparison technique (Steel and Torrie 1560) was used to compare untreated versus week of application and herbicide treatments. The first sequence of letters in
a TOW compare the untreated and all others. Subsequent letters in the treatment section compare responses between treatments. If letters are not the same there is a significant difference at E.05.
2AppEcation was made in week 1, 2, 3, or 4 in July of 1983 (see text for actual day of year).
counted in 3 to 5 0.45-m* circular quadrats per plot during late August in 1983-1986 and 1984-1986 for 1983 and 1984 treatments, respectively.
Within the central section of each plot, herbage in four 0.45-m* circular quadrats was clipped at ground level during early to mid- August in 1984 on areas treated in 1983. Three subplots were clipped in subsequent years (1985 and 1986) on areas treated in 1983 and 1984. Individual species were separated and placed into paper sacks. After several days air-drying, the material was oven- dried at 700 C for 48 hours and weighed.
On 21 September 1983 in the lower section of each plot treated in 1983,2 rows of smooth brome (Brornus inermis ‘Manchar 3, cicer milkvetch (Astragalus cicer %tana% reed foxtail (Alopecurus arundinaceus ‘Garrison>, slender wheatgrass and single rows of RS-Hybrid (Elytrigia repens X Pseudoroegneria spicata) and intermediate wheatgrass ( Thinopyrum intermedium cv. Green [Host] Barkworth & Dewey) (Dewey 1984) were drilled in rows 30 cm apart using a small tractor-mounted drill. Seedling establish- ment was measured in August 1984.
The yield data were analyzed using 3 different experimental models. The first model analyzed date of application, treatments, and year of treatment for each major species. The sources of variation and distribution of degrees of freedom were as follows: Block (2), Treatment (12), Error A (24), Year (1 or 2), Year X Treatment (12 or 24), Error B (26 or 52), and Total (77 or 116). The
second model analyzed differences between treatment years for each species. The sources of variation and degrees of freedom were as follows: Treatment years (l), Blocks within treatment years (4), Treatments (2), Treatment years X Treatment (2), Treatment X Blocks within Treatment year (8), Dates (3), Treatment years X Dates (3), Dates X Blocks within Treatment years (12), Treatment X Dates (6), Error (30), and Total (71). The third analysis used a SAS (1987) general linear model procedure which analyzed species and treatments over all data sets within each treatment year. The data, to have homogeneous variance, were transformed to loga-
rithms prior to analysis. The sources of variation and degrees of freedom were as follows: Species (19), Treatments (12), Blocks (2), Subplots (3), and Total (3,119 minus the number of zero plots).
Results and Discussion
Grass and forb aboveground standing crop (kg/ha), from untreated plots, at the time of each spray application is shown in Figure 3. Total standing crop was 32, 57, 74, and 90% of the maximum for the 4 spray dates in 1983, respectively. The values for plots treated in 1984 were 46,60,68, and 8870, respectively. By the first spray date in 1984 the vegetative development was more advanced compared to that in 1983. After the first date, production slowed-as evidenced by the lower maxifnum growth rate (52 kg ha-’ d-’ in 1984 vs 68 kg ha-’ de’ in 1983). Although the percentages were similar after the first date, the actual maximum standing crop values were greater in 1984compared to 1983 by about 16yo (nearly 400 kg/ ha). This difference in maximum standing crop is attrib- uted to climatic differences between 1983 and 1984 since the stand- ing crop was determined on the same location in the 2 years. Figure 1 shows that July 1984 was possibly wetter (only 19 days of record in 1983 compared to 31 in 1984) and warmer (Fig. 2) than July 1983. This is further supported by July precipitation records from nearby weather stations (Monida Pass, Lakeview, and Island Park) which show 63,74, and 96 mm in 1983 and 80,103, and 94 mm, respectively, in 1984. In spite of a saturated soil profile at the start of growth, the reduction in soil water was steady throughout the growth period in 1983, but was recharged in mid-July in 1984 (Fig. 1). In all years growth was completed before soil water tension reached or exceeded 1500 kPa.