Resources
*Knowledge Base *Selecting Statistics *Simulation Book *Methods Tutorials
Cornell Sites
*Cornell *CU Human Subjects Training
Concept
Mapping
*Concept Systems, Inc.
_
Knowledge Base
Research Center
Selecting Statistics
Research Synthesis Gallery
The Simulation Book
Research Methods Tutorials
Search
Concept Mapping
Welcome. This website is for people involved in applied social research and evaluation.
You'll find lots of resources and links to other locations on the Web that deal in applied
social research methods. Some highlights of what is available:
●
the
Knowledge Base
-- an online hypertext textbook on applied social research
methods that covers everything you want to know about defining a research
question, sampling, measurement, research design and data analysis.
●
Selecting Statistics
-- an online statistical advisor! Answer the questions and it will
lead you to an appropriate statistical test for your data.
●
The Simulation Book
-- A previously unpublished book of manual (i.e., dice-rolling)
and computer simulation exercises of common research designs, for students and
researchers to learn how to do simple simulations.
Contents Navigating Foundations Sampling Measurement Design Analysis Write-Up Appendices Search
by
William M. Trochim
, Cornell University
What is the Research Methods Knowledge Base?
The Research Methods Knowledge Base is a comprehensive
web-based textbook that addresses all of the topics in a typical
introductory undergraduate or graduate course in social research
methods. It covers the entire research process including: formulating
research questions; sampling (probability and nonprobability);
measurement (surveys, scaling, qualitative, unobtrusive); research
design (experimental and quasi-experimental); data analysis; and,
writing the research paper. It also addresses the major theoretical
and philosophical underpinnings of research including: the idea of
validity in research; reliability of measures; and ethics. The
Knowledge Base was designed to be different from the many typical
commercially-available research methods texts. It uses an informal,
conversational style to engage both the newcomer and the more
experienced student of research. It is a fully hyperlinked text that can
be integrated easily into an existing course structure or used as a
sourcebook for the experienced researcher who simply wants to
browse.
[Back to Top]
Purchasing
You can purchase a complete printed copy of the Research Methods
Knowledge Base over the web by selecting the link
Purchase the
complete printed text of the Knowledge Base online
at the bottom of
any page.
[Back to Top]
Using the KB in a Course
The latest editions of the Knowledge Base are published exclusively
by Atomic Dog Publishing. In addition to providing a unique updated
online version of the Knowledge Base text (much more sophisticated
than this one), they are the exclusive publishers of the print version.
Through Atomic Dog Publishing you can expect the finest in
web-based course support for the Knowledge Base including workbooks,
study guides, online testing, test item data banks, and much more. If
you have any questions about use of the Knowledge Base in your
course, please check their website at
http://www.atomicdog.com/
trochim
or contact them directly by e-mail at
help@atomicdogpub.
- What is the KB?
-
Purchase
-
Citing the KB
-
Using the KB in a
Course
- Copyright
Information
-
About the Author
-
Acknowledgements
com
.
Atomic Dog Publishing has agreed to allow me to continue to make
this version of the Knowledge Base available indefinitely at no cost to
any instructor who wishes to use it as part of their course. However,
there are several conditions which must be met for such use:
1.
You must notify me by e-mail
) each time
you use part or all of this site for a course. Describe briefly
what page(s) you will use, the name of the course or
seminar, the expected number of students, and your contact
information.
2.
You may not reproduce these webpages in part or in whole
on any other web server or alternative media (e.g., on a disk
or CD) -- the Knowledge Base must be accessed over the
web at this site. Unfortunately, this means that no mirroring of
this site or any pages on it can be allowed.
3.
You must cite this website appropriately in any list of
readings or course syllabus (see
Citing the KB
for details).
Please see the latest edition of the Knowledge Base at
http://www.
atomicdog.com/trochim
.
About the Author
William M.K. Trochim is a Professor in the Department of Policy
Analysis and Management at Cornell University. He has taught both
the undergraduate and graduate required courses in applied social
research methods since joining the faculty at Cornell in 1980. He
received his Ph.D. in 1980 from the program in Methodology and
Evaluation Research of the Department of Psychology at
Northwestern University. His research interests include the theory
and practice of research, conceptualization methods (including
concept mapping and pattern matching), strategic and operational
planning methods, performance management and measurement, and
change management. He is the developer of The Concept System®
and founder of
Concept Systems Incorporated
. he lives in Ithaca,
New York with his wife Mary and daughter Nora.
[Back to Top]
Acknowledgements
This work, as is true for all significant efforts in life, is a collaborative
achievement. I want to thank especially the students and friends who
assisted and supported me in various ways over the years. I
especially want to thank Dominic Cirillo who has labored tirelessly
over several years on both the web and printed versions of the
make the transition to a web-based course and have contributed their
efforts and insights to this work and the teaching of research
methods. And, of course, I want to thank all of the students, both
undergraduate and graduate, who participated in my courses over
the years and used the Knowledge Base in its various incarnations.
You have been both my challenge and inspiration.
[Back to Top]
New location
Dedication
For Mary and Nora
who continue to astonish me with their resilience, patience, and
love
[Back to Top]
Copyright ©2002, William M.K. Trochim, All Rights Reserved
Purchase a printed copy of the Research Methods Knowledge Base
[ Home ] [ Contents ] [ Navigating ] [ Foundations ] [ Sampling ] [ Measurement ] [ Design ] [ Analysis ] [ Write-Up ] [ Appendices ] [ Search ]
Research Methods Knowledge Base
Contents
Navigating
Yin-Yang Map
The Road Map
Foundations
Language Of Research
Five Big Words
Types of Questions
Time in Research
Types of Relationships
Variables
Hypotheses
Types of Data
Unit of Analysis
Two Research Fallacies
Philosophy of Research
Structure of Research
Deduction & Induction
Positivism & Post-Positivism
Introduction to Validity
Ethics in Research
Conceptualizing
Problem Formulation
Concept Mapping
Evaluation Research
Sampling
External Validity
Sampling Terminology
Statistical Terms in Sampling
Probability Sampling
Nonprobability Sampling
Measurement
Construct Validity
Measurement Validity Types
Idea of Construct Validity
Convergent & Discriminant Validity
Threats to Construct Validity
The Nomological Network
The Multitrait-Multimethod Matrix
Pattern Matching for Construct Validity
Reliability
True Score Theory
Measurement Error
Theory of Reliability
Types of Reliability
Reliability & Validity
Levels of Measurement
Survey Research
Types of Surveys
Selecting the Survey Method
Constructing the Survey
Types Of Questions
Question Content
Response Format
Question Wording
Question Placement
Interviews
Plus & Minus of Survey Methods
Scaling
General Issues in Scaling
Thurstone Scaling
Likert Scaling
Guttman Scaling
Qualitative Measures
The Qualitative Debate
Qualitative Data
Design
Internal Validity
Establishing Cause & Effect
Single Group Threats
Regression to the Mean
Multiple-Group Threats
Social Interaction Threats
Introduction to Design
Types of Designs
Experimental Design
Two-Group Experimental Designs
Probabilistic Equivalence
Random Selection & Assignment
Classifying Experimental Designs
Factorial Designs
Factorial Design Variations
Randomized Block Designs
Covariance Designs
Hybrid Experimental Designs
Quasi-Experimental Design
The Nonequivalent Groups Design
The Regression-Discontinuity Design
Other Quasi-Experimental Designs
Relationships Among Pre-Post Designs
Designing Designs for Research
Advances in Quasi-Experimentation
Analysis
Conclusion Validity
Threats to Conclusion Validity
Improving Conclusion Validity
Statistical Power
Data Preparation
Descriptive Statistics
Correlation
Inferential Statistics
The t-Test
Dummy Variables
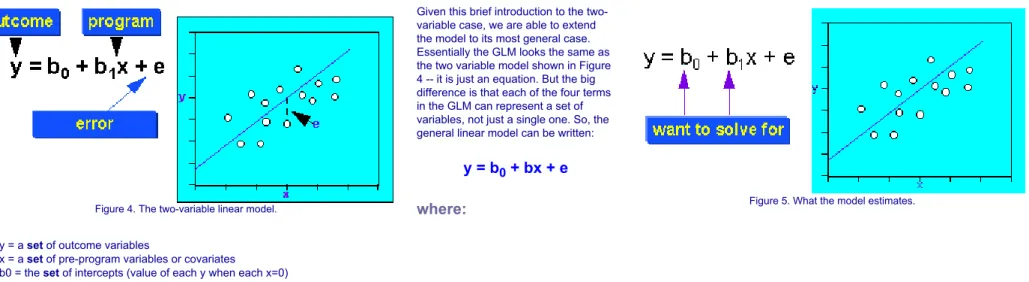
General Linear Model
Posttest-Only Analysis
Factorial Design Analysis
Randomized Block Analysis
Analysis of Covariance
Regression-Discontinuity Analysis
Regression Point Displacement Analysis
Write-Up
Key Elements
Formatting
Sample Paper
Appendices
Citing the KB
Order the KB
Copyright Notice
Search
Copyright ©2002, William M.K. Trochim, All Rights Reserved
Purchase a printed copy of the Research Methods Knowledge Base
[ Home ] [ Contents ] [ Navigating ] [ Foundations ] [ Sampling ] [ Measurement ] [ Design ] [ Analysis ] [ Write-Up ] [ Appendices ] [ Search ]
Yin-Yang Map
The Road Map
Navigating the Knowledge Base
There are at least five options that I can think of for getting to relevant online material in the Knowledge
Base:
The Border Contents
Every page of the Knowledge Base has links in the margins. These links are based on
the hierarchical structure of the website and change depending on the position of the
page in that structure. The links at the top (repeated at the bottom) on each page show
the other pages at the same level of the hierarchy as the page you are looking at. The
links in the left border always include:
The Home Page
The parent page for the page you are viewing
The child pages for the page you are viewing
The Table of Contents
This is a standard hierarchical table of contents like the type you would expect in a
textbook. It is the only navigational device that at a glance shows every page in the
Knowledge Base.
The Yin-Yang Map
This map is based on a graphic that, at a glance, provides an organizing rubric for the
entire Knowledge Base content. It separates the theory of research from the practice of
research and shows how theory and practice are related. this might be an especially
useful launch pad for an advanced or graduate research methods course because of the
strong emphasis on the link between theory and practice.
The Road Map
This map is based on a graphic that shows the typical stages in a research project. It
uses the metaphor of research as a journey down the research road from initial
The Search Page
In the top and bottom margins on every page in the Knowledge base there is a link to the
Search Page. When you need to find information on a specific topic rapidly you should
use this page. The Search Page is linked to an index of every word in the Knowledge
Base, allows you to perform simple and Boolean searches, and returns resulting links
sorted from most to least relevant.
Copyright ©2002, William M.K. Trochim, All Rights Reserved
Purchase a printed copy of the Research Methods Knowledge Base
[ Home ] [ Contents ] [ Navigating ] [ Foundations ] [ Sampling ] [ Measurement ] [ Design ] [ Analysis ] [ Write-Up ] [ Appendices ] [ Search ]
Language Of Research Philosophy of Research Ethics in Research Conceptualizing Evaluation Research
This section provides an overview the major issues in research and in evaluation. This is probably
the best place for you to begin learning about research.
We have to begin somewhere. (Although, if you think about it, the whole idea of hyperlinked text
sort of runs contrary to the notion that there is a single place to begin -- you can begin anywhere,
go anywhere, and leave anytime. Unfortunately, you can only be in one place at a time and, even
less fortunately for you, you happen to be right here right now, so we may as well consider this a
place to begin.) And what better place to begin than an introduction? Here's where we take care of
all the stuff you think you already know, and probably should already know, but most likely don't
know as well as you think you do.
The first thing we have to get straight is the
language of research
. If we don't, we're going to have
a hard time discussing research.
With the basic terminology under our belts, we can look a little more deeply at some of the
underlying
philosophical issues
that drive the research endeavor.
We also need to recognize that social research always occurs in a social context. It is a human
endeavor. Therefore, it's important to consider the critical
ethical issues
that affect the researcher,
research participants, and the research effort generally.
Where do research problems come from? How do we develop a research question? We consider
these issues under
conceptualization
.
Finally, we look at a specific, and very applied, type of social research known as
evaluation
research
.
That ought to be enough to get you started. At least it ought to be enough to get you thoroughly
confused. But don't worry, there's stuff that's far more confusing than this yet to come.
Copyright ©2002, William M.K. Trochim, All Rights Reserved
Purchase a printed copy of the Research Methods Knowledge Base
[ Home ] [ Contents ] [ Navigating ] [ Foundations ] [ Sampling ] [ Measurement ] [ Design ] [ Analysis ] [ Write-Up ] [ Appendices ] [ Search ]
External Validity Sampling Terminology Statistical Sampling Terms Probability Sampling Nonprobability Sampling
Sampling is the process of selecting units (e.g., people, organizations) from a population of
interest so that by studying the sample we may fairly generalize our results back to the
population from which they were chosen. Let's begin by covering some of the
key terms in
sampling
like "population" and "sampling frame." Then, because some types of sampling rely
upon quantitative models, we'll talk about some of the
statistical terms used in sampling
. Finally,
we'll discuss the major distinction between
probability
and
Nonprobability
sampling methods and
work through the major types in each.
Copyright ©2002, William M.K. Trochim, All Rights Reserved
Purchase a printed copy of the Research Methods Knowledge Base
[ Home ] [ Contents ] [ Navigating ] [ Foundations ] [ Sampling ] [ Measurement ] [ Design ] [ Analysis ] [ Write-Up ] [ Appendices ] [ Search ]
Construct Validity Reliability
Levels of Measurement Survey Research Scaling
Qualitative Measures Unobtrusive Measures
Measurement is the process observing and recording the observations that are collected as part of
a research effort. There are two major issues that will be considered here.
First, you have to understand the
fundamental ideas
involved in measuring. Here we consider two
of major measurement concepts. In
Levels of Measurement
, I explain the meaning of the four major
levels of measurement: nominal, ordinal, interval and ratio. Then we move on to the
reliability
of
measurement, including consideration of true score theory and a variety of reliability estimators.
Second, you have to understand the different
types of measures
that you might use in social
research. We consider four broad categories of measurements.
Survey research
includes the
design and implementation of interviews and questionnaires.
Scaling
involves consideration of the
major methods of developing and implementing a scale.
Qualitative research
provides an overview
of the broad range of non-numerical measurement approaches. And
unobtrusive measures
presents a variety of measurement methods that don't intrude on or interfere with the context of the
research.
Copyright ©2002, William M.K. Trochim, All Rights Reserved
Purchase a printed copy of the Research Methods Knowledge Base
[ Home ] [ Contents ] [ Navigating ] [ Foundations ] [ Sampling ] [ Measurement ] [ Design ] [ Analysis ] [ Write-Up ] [ Appendices ] [ Search ]
Internal Validity Introduction to Design Types of Designs Experimental Design Quasi-Experimental Design
Relationships Among Pre-Post Designs Designing Designs for Research Advances in Quasi-Experimentation
Research design provides the glue that holds the research project together. A design is
used to structure the research, to show how all of the major parts of the research
project -- the samples or groups, measures, treatments or programs, and methods of
assignment -- work together to try to address the central research questions. Here,
after a brief
introduction to research design
, I'll show you how we classify the major
types of designs
. You'll see that a major distinction is between the
experimental
designs
that use random assignment to groups or programs and the
quasi-experimental designs
that don't use random assignment. [People often confuse what
is meant by random selection with the idea of random assignment. You should make
sure that you understand the
distinction between random selection and random
assignment
.] Understanding the
relationships among designs
is important in making
design choices and thinking about the strengths and weaknesses of different designs.
Then, I'll talk about the heart of the art form of
designing designs for research
and give
you some ideas about how you can think about the design task. Finally, I'll consider
some of the more recent
advances in quasi-experimental thinking
-- an area of special
importance in applied social research and program evaluation.
Copyright ©2002, William M.K. Trochim, All Rights Reserved
Purchase a printed copy of the Research Methods Knowledge Base
[ Home ] [ Contents ] [ Navigating ] [ Foundations ] [ Sampling ] [ Measurement ] [ Design ] [ Analysis ] [ Write-Up ] [ Appendices ] [ Search ]
Conclusion Validity Data Preparation Descriptive Statistics Inferential Statistics
By the time you get to the analysis of your data, most of the really difficult work has been done. It's
much more difficult to: define the research problem; develop and implement a sampling plan;
conceptualize, operationalize and test your measures; and develop a design structure. If you have
done this work well, the analysis of the data is usually a fairly straightforward affair.
In most social research the data analysis involves three major steps, done in roughly this order:
Cleaning and organizing the data for analysis (
Data Preparation
)
Describing the data (
Descriptive Statistics
)
Testing Hypotheses and Models (
Inferential Statistics
)
Data Preparation
involves checking or logging the data in; checking the data for accuracy; entering
the data into the computer; transforming the data; and developing and documenting a database
structure that integrates the various measures.
Descriptive Statistics
are used to describe the basic features of the data in a study. They provide
simple summaries about the sample and the measures. Together with simple graphics analysis, they
form the basis of virtually every quantitative analysis of data. With descriptive statistics you are simply
describing what is, what the data shows.
Inferential Statistics
investigate questions, models and hypotheses. In many cases, the conclusions
from inferential statistics extend beyond the immediate data alone. For instance, we use inferential
statistics to try to infer from the sample data what the population thinks. Or, we use inferential
statistics to make judgments of the probability that an observed difference between groups is a
dependable one or one that might have happened by chance in this study. Thus, we use inferential
statistics to make inferences from our data to more general conditions; we use descriptive statistics
simply to describe what's going on in our data.
In most research studies, the analysis section follows these three phases of analysis. Descriptions of
how the data were prepared tend to be brief and to focus on only the more unique aspects to your
study, such as specific data transformations that are performed. The descriptive statistics that you
actually look at can be voluminous. In most write-ups, these are carefully selected and organized into
summary tables and graphs that only show the most relevant or important information. Usually, the
researcher links each of the inferential analyses to specific research questions or hypotheses that
were raised in the introduction, or notes any models that were tested that emerged as part of the
analysis. In most analysis write-ups it's especially critical to not "miss the forest for the trees." If you
present too much detail, the reader may not be able to follow the central line of the results. Often
extensive analysis details are appropriately relegated to appendices, reserving only the most critical
analysis summaries for the body of the report itself.
Copyright ©2002, William M.K. Trochim, All Rights Reserved
Purchase a printed copy of the Research Methods Knowledge Base
[ Home ] [ Contents ] [ Navigating ] [ Foundations ] [ Sampling ] [ Measurement ] [ Design ] [ Analysis ] [ Write-Up ] [ Appendices ] [ Search ]
Key Elements Formatting Sample Paper
So now that you've completed the research project, what do you do? I know you won't want to hear this,
but your work is still far from done. In fact, this final stage -- writing up your research -- may be one of the
most difficult. Developing a good, effective and concise report is an art form in itself. And, in many
research projects you will need to write multiple reports that present the results at different levels of detail
for different audiences.
There are several general considerations to keep in mind when generating a report:
The Audience
Who is going to read the report? Reports will differ considerably depending on whether the
audience will want or require technical detail, whether they are looking for a summary of results,
or whether they are about to examine your research in a Ph.D. exam.
The Story
I believe that every research project has at least one major "story" in it. Sometimes the story
centers around a specific research finding. Sometimes it is based on a methodological problem
or challenge. When you write your report, you should attempt to tell the "story" to your reader.
Even in very formal journal articles where you will be required to be concise and detailed at the
same time, a good "storyline" can help make an otherwise very dull report interesting to the
reader.
The hardest part of telling the story in your research is finding the story in the first place. Usually
when you come to writing up your research you have been steeped in the details for weeks or
months (and sometimes even for years). You've been worrying about sampling response,
struggling with operationalizing your measures, dealing with the details of design, and wrestling
with the data analysis. You're a bit like the ostrich that has its head in the sand. To find the story
in your research, you have to pull your head out of the sand and look at the big picture. You have
to try to view your research from your audience's perspective. You may have to let go of some of
the details that you obsessed so much about and leave them out of the write up or bury them in
technical appendices or tables.
Formatting Considerations
Are you writing a research report that you will submit for publication in a journal? If so, you
should be aware that every journal requires articles that you follow specific formatting guidelines.
Thinking of writing a book. Again, every publisher will require specific formatting. Writing a term
paper? Most faculty will require that you follow specific guidelines. Doing your thesis or
dissertation? Every university I know of has very strict policies about formatting and style.
There are legendary stories that circulate among graduate students about the dissertation that
was rejected because the page margins were a quarter inch off or the figures weren't labeled
correctly.
similar to the types of specifications you might be required to follow for a journal article. However, you
need to check the specific formatting guidelines for the report you are writing -- the ones presented here
are likely to differ in some ways from any other guidelines that may be required in other contexts.
I've also included a sample research paper write-up that illustrates these guidelines. This sample paper is
for a "make-believe" research project. But it illustrates how a final research report might look using the
guidelines given here.
Copyright ©2002, William M.K. Trochim, All Rights Reserved
Purchase a printed copy of the Research Methods Knowledge Base
[ Home ] [ Contents ] [ Navigating ] [ Foundations ] [ Sampling ] [ Measurement ] [ Design ] [ Analysis ] [ Write-Up ] [ Appendices ] [ Search ]
Citing the KB Order the KB Copyright Notice
The appendices include information about how to order printed copies of the Research Methods
Knowledge Base and how to use the text as part of an undergraduate or graduate-level course in social
research methods.
Copyright ©2002, William M.K. Trochim, All Rights Reserved
Purchase a printed copy of the Research Methods Knowledge Base
[ Home ] [ Contents ] [ Navigating ] [ Foundations ] [ Sampling ] [ Measurement ] [ Design ] [ Analysis ] [ Write-Up ] [ Appendices ] [ Search ]
Knowledge Base Search Page
Use the form below to search for documents in the Research Methods Knowledge Base containing specific words or
combinations of words. The text search engine will display a weighted list of matching documents, with better
matches shown first. Each list item is a link to a matching document; if the document has a title it will be shown,
otherwise only the document's file name is displayed. A brief
explanation
of the query language is available, along
with examples.
Search for:
Query Language
The text search engine allows queries to be formed from arbitrary Boolean expressions containing the keywords
AND, OR, and NOT, and grouped with parentheses. For example:
information retrieval
finds documents containing 'information' or 'retrieval'
information or retrieval
same as above
information and retrieval
finds documents containing both 'information' and 'retrieval'
information not retrieval
finds documents containing 'information' but not 'retrieval'
(information not retrieval) and WAIS
finds documents containing 'WAIS', plus 'information' but not 'retrieval'
web*
finds documents containing words starting with 'web'
Back to Top
Copyright ©2002, William M.K. Trochim, All Rights Reserved
Purchase a printed copy of the Research Methods Knowledge Base
[ Home ] [ Citing the KB ] [ Order the KB ] [ Copyright Notice ]
Order the Enhanced and Revised KB
Whether you are an individual interested in using the Knowledge Base on your own, are a student using it as part of
an online course, or are an instructor who wishes to adopt it for a course, you can order the revised and expanded
version of the Knowledge Base at
http://www.atomicdog.com/trochim
.
PLEASE NOTE: The printed version of the Research Methods Knowledge Base is revised and enhanced
version of this website version. It is also available on a protected website and is available to you on the site
for free if you purchase the hardcopy version. The printed version is in greyscale, not in color (as the
website is). To print the entire volume in color would raise costs considerably.
Thanks for your interest in the Research Methods Knowledge Base.
Copyright ©2002, William M.K. Trochim, All Rights Reserved
Purchase a printed copy of the Research Methods Knowledge Base
[ Home ] [ Citing the KB ] [ Order the KB ] [ Copyright Notice ]
If you quote material from the Knowledge Base in your work, please cite it accurately. An appropriate citation for the
online home page would be:
Trochim, William M. The Research Methods Knowledge Base, 2nd Edition. Internet WWW
page, at URL: <
http://trochim.human.cornell.edu/kb/index.htm
> (version current as of
August 16, 2004).
The date that each page was last edited is given at the bottom of the page and can be used for "version current as
of..."
If you are citing the printed version, the citation would be:
Trochim, W. (2000). The Research Methods Knowledge Base, 2nd Edition. Atomic Dog
Publishing, Cincinnati, OH.
Copyright ©2002, William M.K. Trochim, All Rights Reserved
Purchase a printed copy of the Research Methods Knowledge Base
[ Home ] [ Citing the KB ] [ Order the KB ] [ Copyright Notice ]
COPYRIGHT
©Copyright, William M.K. Trochim 1998-2000. All Rights Reserved.
LICENSE DISCLAIMER
Nothing on the Research Methods Knowledge Base Web Site or in the printed version shall be construed as
conferring any license under any of the William M.K. Trochim's or any third party's intellectual property rights,
whether by estoppel, implication, or otherwise.
CONTENT AND LIABILITY DISCLAIMER
William M.K. Trochim shall not be responsible for any errors or omissions contained on the Research Methods
Knowledge Base Web Site or in the printed version, and reserves the right to make changes without notice.
Accordingly, all original and third party information is provided
"AS IS"
. In addition, William M.K. Trochim is not
responsible for the content of any other Web Site linked to the Research Methods Knowledge Base Web Site or
cited in the printed version. Links are provided as Internet navigation tools only.
WILLIAM M.K. TROCHIM DISCLAIMS ALL WARRANTIES WITH REGARD TO THE INFORMATION
(INCLUDING ANY SOFTWARE) PROVIDED, INCLUDING THE IMPLIED WARRANTIES OF MERCHANTABILITY
AND FITNESS FOR A PARTICULAR PURPOSE, AND NON-INFRINGEMENT.
Some jurisdictions do not allow the
exclusion of implied warranties, so the above exclusion may not apply to you.
In no event shall William M.K. Trochim be liable for any damages whatsoever, and in particular William M.K. Trochim
shall not be liable for special, indirect , consequential, or incidental damages, or damages for lost profits, loss of
revenue, or loss of use, arising out of or related to the Research Methods Knowledge Base Web Site or the printed
version or the information contained in these, whether such damages arise in contract, negligence, tort, under
statute, in equity, at law or otherwise.
FEEDBACK INFORMATION
Any information provided to William M.K. Trochim in connection with the Research Methods Knowledge Base Web
Site or the printed version shall be provided by the submitter and received by William M.K. Trochim on a
non-confidential basis. William M.K. Trochim shall be free to use such information on an unrestricted basis.
Copyright ©2002, William M.K. Trochim, All Rights Reserved
Purchase a printed copy of the Research Methods Knowledge Base
[ Home ] [ Key Elements ] [ Formatting ] [ Sample Paper ]
This page describes the elements or criteria that you must typically address in a research paper. The assumption
here is that you are addressing a causal hypothesis in your paper.
I. Introduction
1.
Statement of the problem:
The general problem area is stated clearly and unambiguously. The importance
and significance of the problem area is discussed.
2.
Statement of causal relationship:
The cause-effect relationship to be studied is stated clearly and is
sensibly related to the problem area.
3.
Statement of constructs:
Each key construct in the research/evaluation project is explained (minimally,
both the cause and effect). The explanations are readily understandable (i.e., jargon-free) to an intelligent
reader.
4.
Literature citations and review:
The literature cited is from reputable and appropriate sources (e.g.,
professional journals, books and not Time, Newsweek, etc.) and you have a minimum of five references.
The literature is condensed in an intelligent fashion with only the most relevant information included.
Citations are in the correct format (see APA format sheets).
5.
Statement of hypothesis:
The hypothesis (or hypotheses) is clearly stated and is specific about what is
predicted. The relationship of the hypothesis to both the problem statement and literature review is readily
understood from reading the text.
II. Methods
Sample section:
1.
Sampling procedure specifications:
The procedure for selecting units (e.g., subjects, records) for the
study is described and is appropriate. The author state which sampling method is used and why. The
population and sampling frame are described. In an evaluation, the program participants are frequently
self-selected (i.e., volunteers) and, if so, should be described as such.
2.
Sample description:
The sample is described accurately and is appropriate. Problems in contacting and
measuring the sample are anticipated.
3.
External validity considerations:
Generalizability from the sample to the sampling frame and population is
considered.
Measurement section:
1.
Measures:
Each outcome measurement construct is described briefly (a minimum of two outcome
multiple measures of the same construct are used.
2.
Construction of measures:
For questionnaires, tests and interviews: questions are clearly worded,
specific, appropriate for the population, and follow in a logical fashion. The standards for good questions are
followed. For archival data: original data collection procedures are adequately described and indices (i.e.,
combinations of individual measures) are constructed correctly. For scales, you must describe briefly which
scaling procedure you used and how you implemented it. For qualitative measures, the procedures for
collecting the measures are described in detail.
3.
Reliability and validity:
You must address both the reliability and validity of all of your measures. For
reliability, you must specify what estimation procedure(s) you used. For validity, you must explain how you
assessed construct validity. Wherever possible, you should minimally address both convergent and
discriminant validity. The procedures which are used to examine reliability and validity are appropriate for
the measures.
Design and Procedures section:
1.
Design:
The design is clearly presented in both notational and text form. The design is appropriate for the
problem and addresses the hypothesis.
2.
Internal validity:
Threats to internal validity and how they are addressed by the design are discussed. Any
threats to internal validity which are not well controlled are also considered.
3.
Description of procedures:
An overview of how the study will be conducted is included. The sequence of
events is described and is appropriate to the design. Sufficient information is included so that the essential
features of the study could be replicated by a reader.
III. Results
1.
Statement of Results:
The results are stated concisely and are plausible for the research described.
2.
Tables:
The table(s) is correctly formatted and accurately and concisely presents part of the analysis.
3.
Figures:
The figure(s) is clearly designed and accurately describes a relevant aspect of the results.
IV. Conclusions, Abstract and Reference Sections
1.
Implications of the study:
Assuming the expected results are obtained, the implications of these results
are discussed. The author mentions briefly any remaining problems which are anticipated in the study.
2.
Abstract:
The Abstract is 125 words or less and presents a concise picture of the proposed research. Major
constructs and hypotheses are included. The Abstract is the first section of the paper. See the format sheet
for more details.
3.
References:
All citations are included in the correct format and are appropriate for the study described.
Stylistic Elements
I. Professional Writing
First person and sex-stereotyped forms are avoided. Material is presented in an unbiased and
unemotional (e.g., no "feelings" about things), but not necessarily uninteresting, fashion.
II. Parallel Construction
III. Sentence Structure
Sentence structure and punctuation are correct. Incomplete and run-on sentences are avoided.
IV. Spelling and Word Usage
Spelling and use of words are appropriate. Words are capitalized and abbreviated correctly.
V. General Style.
The document is neatly produced and reads well. The format for the document has been correctly
followed.
Copyright ©2002, William M.K. Trochim, All Rights Reserved
Purchase a printed copy of the Research Methods Knowledge Base
[ Home ] [ Key Elements ] [ Formatting ] [ Sample Paper ]
Overview
The instructions provided here are for a research article or a research report (generally these guidelines follow the
formatting guidelines of the American Psychological Association documented in Publication Manual of the American
Psychological Association, 4th Edition). Please consult the specific guidelines that are required by the publisher for
the type of document you are producing.
All sections of the paper should be typed, double-spaced on white 8 1/2 x 11 inch paper with 12 pitch typeface with
all margins set to 1 inch. REMEMBER TO CONSULT THE APA PUBLICATION MANUAL, FOURTH EDITION,
PAGES 258 - 264 TO SEE HOW TEXT SHOULD APPEAR. Every page must have a header in the upper right
corner with the running header right-justified on the top line and the page number right-justified and double-spaced
on the line below it. The paper must have all the sections in the order given below, following the specifications
outlined for each section (all pages numbers are approximate):
Title Page
Abstract
(on a separate single page)
The
Body
(no page breaks between sections in the body)
Introduction
(2-3 pages)
Methods
(7-10 pages)
Sample
(1 page)
Measures
(2-3 pages)
Design
(2-3 pages)
Procedures
(2-3 pages)
Results
(2-3 pages)
Conclusions
(1-2 pages)
References
Tables
(one to a page)
Figures
(one to a page)
Appendices
Title Page
On separate lines and centered, the title page has the title of the study, the author's name, and the institutional
affiliation. At the bottom of the title page you should have the words (in caps) RUNNING HEADER: followed by a
short identifying title (2-4 words) for the study. This running header should also appear on the top right of every page
of the paper.
The abstract is limited to one page, double-spaced. At the top of the page, centered, you should have the word
'
Abstract
'. The abstract itself should be written in paragraph form and should be a concise summary of the entire
paper including: the problem; major hypotheses; sample and population; a brief description of the measures; the
name of the design or a short description (no design notation here); the major results; and, the major conclusions.
Obviously, to fit this all on one page you will have to be very concise.
Body
The first page of the body of the paper should have, centered, the complete title of the study.
Introduction
The first section in the body is the introduction. There is no heading that says 'Introduction,' you simply begin the
paper in paragraph form following the title. Every introduction will have the following (roughly in this order): a
statement of the problem being addressed; a statement of the cause-effect relationship being studied; a description
of the major constructs involved; a brief review of relevant literature (including citations); and a statement of
hypotheses. The entire section should be in paragraph form with the possible exception of the hypotheses, which
may be indented.
Methods
The next section of the paper has four subsections: Sample; Measures; Design; and, Procedure. The Methods
section should begin immediately after the introduction (no page break) and should have the centered title 'Methods'.
Each of the four subsections should have an underlined left justified section heading.
Sampling
This section should describe the population of interest, the sampling frame, the method for selecting the sample, and
the sample itself. A brief discussion of external validity is appropriate here, that is, you should state the degree to
which you believe results will be generalizable from your sample to the population. (
Link to Knowledge Base on
sampling
).
Measures
This section should include a brief description of your constructs and all measures that will be used to operationalize
them. You may present short instruments in their entirety in this section. If you have more lengthy instruments you
may present some "typical" questions to give the reader a sense of what you will be doing (and include the full
measure in an Appendix). You may include any instruments in full in appendices rather than in the body.
Appendices should be labeled by letter. (e.g., 'Appendix A') and cited appropriately in the body of the text. For
pre-existing instruments you should cite any relevant information about reliability and validity if it is available. For all
instruments, you should briefly state how you will determine reliability and validity, report the results and discuss.
For reliability, you must describe the methods you used and report results. A brief discussion of how you have
addressed construct validity is essential. In general, you should try to demonstrate both convergent and
discriminant validity. You must discuss the evidence in support of the validity of your measures. (
Link to Knowledge
Base on measurement
).
You should state the name of the design that is used and tell whether it is a true or quasi-experiment, nonequivalent
group design, and so on. You should also present the design structure in X and O notation (this should be indented
and centered, not put into a sentence). You should also include a discussion of internal validity that describes the
major likely threats in your study and how the design accounts for them, if at all. (Be your own study critic here and
provide enough information to show that you understand the threats to validity, whether you've been able to account
for them all in the design or not.) (
Link to Knowledge Base on design
).
Procedures
Generally, this section ties together the sampling, measurement, and research design. In this section you should
briefly describe the overall plan of the research, the sequence of events from beginning to end (including sampling,
measurement, and use of groups in designs), how participants will be notified, and how their confidentiality will be
protected (where relevant). An essential part of this subsection is a description of the program or independent
variable that you are studying. (
Link to Knowledge Base discussion of validity
).
Results
The heading for this section is centered with upper and lower case letters. You should indicate concisely what
results you found in this research. Your results don't have to confirm your hypotheses. In fact, the common
experience in social research is the finding of no effect.
Conclusions
Here you should describe the conclusions you reach (assuming you got the results described in the Results section
above). You should relate these conclusions back to the level of the construct and the general problem area which
you described in the Introduction section. You should also discuss the overall strength of the research proposed (e.
g. general discussion of the strong and weak validity areas) and should present some suggestions for possible
future research which would be sensible based on the results of this work.
References
There are really two parts to a reference citation. First, there is the way you cite the item in the text when you are
discussing it. Second, there is the way you list the complete reference in the reference section in the back of the
report.
Reference Citations in the Text of Your Paper
Cited references appear in the text of your paper and are a way of giving credit to the source of the information or
quote you have used in your paper. They generally consist of the following bits of information:
The author's last name, unless first initials are needed to distinguish between two authors with the
same last name. If there are six or more authors, the first author is listed followed by the term, et al.,
and then the year of the publication is given in parenthesis. Year of publication in parenthesis. Page
numbers are given with a quotation or when only a specific part of a source was used.
"To be or not to be" (Shakespeare, 1660, p. 241)
Rogers (1994) compared reaction times...
One Work by Multiple Authors:
Wasserstein, Zappulla, Rosen, Gerstman, and Rock (1994) [first time you cite in
text]
Wasserstein et al. (1994) found [subsequent times you cite in text]
Reference List in Reference Section
There are a wide variety of reference citation formats. Before submitting any research report you should check to
see which type of format is considered acceptable for that context. If there is no official format requirement then the
most sensible thing is for you to select one approach and implement it consistently (there's nothing worse than a
reference list with a variety of formats). Here, I'll illustrate by example some of the major reference items and how
they might be cited in the reference section.
The References lists all the articles, books, and other sources used in the research and preparation of the paper and
cited with a parenthetical (textual) citation in the text. These items are entered in alphabetical order according to the
authors' last names; if a source does not have an author, alphabetize according to the first word of the title,
disregarding the articles "a", "an", and "the" if they are the first word in the title.
EXAMPLES BOOK BY ONE AUTHOR:
Jones, T. (1940). My life on the road. New York: Doubleday.
BOOK BY TWO AUTHORS:
Williams, A., & Wilson, J. (1962). New ways with chicken. New York: Harcourt.
BOOK BY THREE OR MORE AUTHORS:
Smith, J., Jones, J., & Williams, S. (1976). Common names. Chicago: University of
Chicago Press.
BOOK WITH NO GIVEN AUTHOR OR EDITOR:
Handbook of Korea (4th ed.). (1982). Seoul: Korean Overseas Information, Ministry
of Culture & Information.
TWO OR MORE BOOKS BY THE SAME AUTHOR:
Oates, J.C. (1990). Because it is bitter, and because it is my heart. New York:
Dutton.
Note: Entries by the same author are arranged chronologically by the year of
publication, the earliest first. References with the same first author and
different second and subsequent authors are listed alphabetically by the
surname of the second author, then by the surname of the third author.
References with the same authors in the same order are entered
chronologically by year of publication, the earliest first. References by the
same author (or by the same two or more authors in identical order) with the
same publication date are listed alphabetically by the first word of the title
following the date; lower case letters (a, b, c, etc.) are included after the
year, within the parentheses.
BOOK BY A CORPORATE (GROUP) AUTHOR:
President's Commission on Higher Education. (1977). Higher education for
American democracy . Washington, D.C.: U.S. Government Printing Office.
BOOK WITH AN EDITOR:
Bloom, H. (Ed.). (1988). James Joyce's Dubliners. New York: Chelsea House.
A TRANSLATION:
Dostoevsky, F. (1964). Crime and punishment (J. Coulson Trans.). New York:
Norton. (Original work published 1866)
AN ARTICLE OR READING IN A COLLECTION OF PIECES BY SEVERAL AUTHORS
(ANTHOLOGY):
O'Connor, M.F. (1975). Everything that rises must converge. In J.R. Knott, Jr. & C.
R. Raeske (Eds.), Mirrors: An introduction to literature (2nd ed., pp. 58-67). San
Francisco: Canfield.
EDITION OF A BOOK:
Tortora, G.J., Funke, B.R., & Case, C.L. (1989). Microbiology: An introduction (3rd
ed.). Redwood City, CA: Benjamin/Cummings.
DIAGNOSTIC AND STATISTICAL MANUAL OF MENTAL DISORDERS:
American Psychiatric Association. (1994). Diagnostic and statistical manual of
mental disorders (4th ed.). Washington, D.C.: Author.
A WORK IN SEVERAL VOLUMES:
Churchill, W.S. (1957). A history of the English speaking peoples: Vol. 3. The Age
of Revolution. New York: Dodd, Mead.
Cockrell, D. (1980). Beatles. In The new Grove dictionary of music and musicians
(6th ed., Vol. 2, pp. 321-322). London: Macmillan.
ARTICLE FROM A WEEKLY MAGAZINE:
Jones, W. (1970, August 14). Todays's kids. Newseek, 76, 10-15.
ARTICLE FROM A MONTHLY MAGAZINE:
Howe, I. (1968, September). James Baldwin: At ease in apocalypse. Harper's, 237,
92-100.
ARTICLE FROM A NEWSPAPER:
Brody, J.E. (1976, October 10). Multiple cancers termed on increase. New York
Times (national ed.). p. A37.
ARTICLE FROM A SCHOLARLY ACADEMIC OR PROFESSIONAL JOURNAL:
Barber, B.K. (1994). Cultural, family, and personal contexts of parent-adolescent
conflict. Journal of Marriage and the Family, 56, 375-386.
GOVERNMENT PUBLICATION:
U.S. Department of Labor. Bureau of Labor Statistics. (1980). Productivity.
Washington, D.C.: U.S. Government Printing Office.
PAMPHLET OR BROCHURE:
Research and Training Center on Independent Living. (1993). Guidelines for
reporting and writing about people with disabilities. (4th ed.) [Brochure]. Lawrence,
KS: Author.
Tables
Any Tables should have a heading with 'Table #' (where # is the table number), followed by the title for the heading
that describes concisely what is contained in the table. Tables and Figures are typed on separate sheets at the end
of the paper after the References and before the Appendices. In the text you should put a reference where each
Table or Figure should be inserted using this form:
_________________________________________
Insert Table 1 about here
Figures
Figures are drawn on separate sheets at the end of the paper after the References and and Tables, and before the
Appendices. In the text you should put a reference where each Figure will be inserted using this form:
_________________________________________
Insert Figure 1 about here
_________________________________________
Appendices
Appendices should be used only when absolutely necessary. Generally, you will only use them for presentation of
extensive measurement instruments, for detailed descriptions of the program or independent variable and for any
relevant supporting documents which you don't include in the body. Even if you include such appendices, you
should briefly describe the relevant material in the body and give an accurate citation to the appropriate appendix (e.
g., 'see Appendix A').
Copyright ©2002, William M.K. Trochim, All Rights Reserved
Purchase a printed copy of the Research Methods Knowledge Base
[ Home ] [ Key Elements ] [ Formatting ] [ Sample Paper ]
This paper should be used only as an example of a research paper write-up. Horizontal rules signify the top and bottom edges of pages. For sample references which are not included with this paper, you should consult the Publication Manual of the American Psychological Association, 4th Edition.
This paper is provided only to give you an idea of what a research paper might look like. You are not allowed to copy any of the text of this paper in writing your own report.
Because word processor copies of papers don't translate well into web pages, you should note that an actual paper should be formatted according to the formatting rules for your context. Note especially that there are three formatting rules you will see in this sample paper which you should NOT follow. First, except for the title page, the running header should appear in the upper right corner of every page with the page number below it. Second, paragraphs and text should be double spaced and the start of each paragraph should be indented. Third, horizontal lines are used to indicate a mandatory page break and should not be used in your paper.
The Effects of a Supported Employment Program on Psychosocial Indicators
for Persons with Severe Mental Illness
William M.K. Trochim
Cornell University
Running Head: SUPPORTED EMPLOYMENT
Abstract
The Effects of a Supported Employment Program on Psychosocial Indicators for Persons with Severe Mental Illness
Over the past quarter century a shift has occurred from traditional institution-based models of care for persons with severe mental illness (SMI) to more individualized community-based treatments. Along with this, there has been a significant shift in thought about the potential for persons with SMI to be "rehabilitated" toward lifestyles that more closely approximate those of persons without such illness. A central issue is the ability of a person to hold a regular full-time job for a sustained period of time. There have been several attempts to develop novel and radical models for program interventions designed to assist persons with SMI to sustain full-time employment while living in the community. The most promising of these have emerged from the tradition of psychiatric rehabilitation with its emphases on individual consumer goal setting, skills training, job preparation and employment support (Cook, Jonikas and Solomon, 1992). These are relatively new and field evaluations are rare or have only recently been initiated (Cook and Razzano, 1992; Cook, 1992). Most of the early attempts to evaluate such programs have naturally focused almost exclusively on employment outcomes. However, theory suggests that sustained employment and living in the community may have important therapeutic benefits in addition to the obvious economic ones. To date, there have been no formal studies of the effects of psychiatric rehabilitation programs on key illness-related outcomes. To address this issue, this study seeks to examine the effects of a new program of supported
employment on psychosocial outcomes for persons with SMI.
Over the past several decades, the theory of vocational rehabilitation has experienced two major stages of evolution. Original models of vocational rehabilitation were based on the idea of sheltered workshop employment. Clients were paid a piece rate and worked only with other individuals who were disabled. Sheltered workshops tended to be "end points" for persons with severe and profound mental retardation since few ever moved from sheltered to competitive employment (Woest, Klein & Atkins, 1986). Controlled studies of sheltered workshop performance of persons with mental illness suggested only minimal success (Griffiths, 1974) and other research indicated that persons with mental illness earned lower wages, presented more behavior problems, and showed poorer workshop attendance than workers with other disabilities (Whitehead, 1977; Ciardiello, 1981).
In the 1980s, a new model of services called Supported Employment (SE) was proposed as less expensive and more normalizing for persons undergoing rehabilitation (Wehman, 1985). The SE model emphasizes first locating a job in an integrated setting for minimum wage or above, and then placing the person on the job and providing the training and support services needed to remain employed (Wehman, 1985). Services such as individualized job development, one-on-one job coaching, advocacy with co-workers and employers, and "fading" support were found to be effective in maintaining employment for individuals with severe and profound mental retardation (Revell, Wehman & Arnold, 1984). The idea that this model could be generalized to persons with all types of severe disabilities, including severe mental illness, became commonly accepted (Chadsey-Rusch & Rusch, 1986).
One of the more notable SE programs was developed at Thresholds, the site for the present study, which created a new staff position called the mobile job support worker (MJSW) and removed the common six month time limit for many placements. MJSWs provide ongoing, mobile support and intervention at or near the work site, even for jobs with high degrees of independence (Cook & Hoffschmidt, 1993). Time limits for many placements were removed so that clients could stay on as permanent employees if they and their employers wished. The suspension of time limits on job placements, along with MJSW support, became the basis of SE services delivered at Thresholds.
There are two key psychosocial outcome constructs of interest in this study. The first is the overall psychological functioning of the person with SMI. This would include the specification of severity of cognitive and affective symptomotology as well as the overall level of psychological functioning. The second is the level of self-reported self esteem of the person. This was measured both generally and with specific reference to employment.
The key hypothesis of this study is:
HO: A program of supported employment will result in either no change or negative effects on psychological functioning and self
esteem.
which will be tested against the alternative:
HA: A program of supported employment will lead to positive effects on psychological functioning and self esteem.
Method
Sample
agency each year (e.g., approximately 500 who meet the criteria) a simple random sample of 50% was chosen for inclusion in the study. This resulted in a sample size of 484 persons over the two-year course of the study.
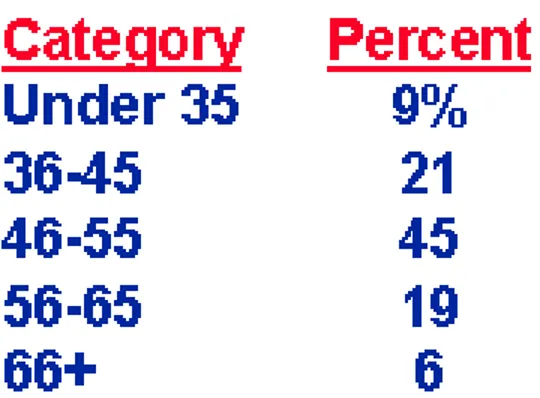
On average, study participants were 30 years old and high school graduates (average education level = 13 years). The majority of participants (70%) were male. Most had never married (85%), few (2%) were currently married, and the remainder had been formerly married (13%). Just over half (51%) are African American, with the remainder Caucasian (43%) or other minority groups (6%). In terms of illness history, the members in the sample averaged 4 prior psychiatric hospitalizations and spent a lifetime average of 9 months as patients in psychiatric hospitals. The primary diagnoses were schizophrenia (42%) and severe chronic depression (37%). Participants had spent an average of almost two and one-half years (29 months) at the longest job they ever held.
While the study sample cannot be considered representative of the original population of interest, generalizability was not a primary goal -- the major purpose of this study was to determine whether a specific SE program could work in an accessible context. Any effects of SE evident in this study can be generalized to urban psychiatric agencies that are similar to Thresholds, have a similar clientele, and implement a similar program.
Measures
All but one of the measures used in this study are well-known instruments in the research literature on psychosocial functioning. All of the instruments were administered as part of a structured interview that an evaluation social worker had with study participants at regular intervals.
Two measures of psychological functioning were used. The Brief Psychiatric Rating Scale (BPRS)(Overall and Gorham, 1962) is an 18-item scale that measures perceived severity of symptoms ranging from "somatic concern" and "anxiety" to "depressive mood" and "disorientation." Ratings are given on a 0-to-6 Likert-type response scale where 0="not present" and 6="extremely severe" and the scale score is simply the sum of the 18 items. The Global Assessment Scale (GAS)(Endicott et al, 1976) is a single 1-to-100 rating on a scale where each ten-point increment has a detailed description of functioning (higher scores indicate better functioning). For instance, one would give a rating between 91-100 if the person showed "no symptoms, superior functioning..." and a value between 1-10 if the person "needs constant supervision..."
Two measures of self esteem were used. The first is the Rosenberg Self Esteem (RSE) Scale (Rosenberg, 1965), a 10-item scale rated on a 6-point response format where 1="strongly disagree" and 6="strongly agree" and there is no neutral 6-point. The total score is simply the sum across the ten items, with five of the items being reversals. The second measure was developed explicitly for this study and was designed to measure the Employment Self Esteem (ESE) of a person with SMI. This is a 10-item scale that uses a 4-point response format where 1="strongly disagree" and 4="strongly agree" and there is no neutral point. The final ten items were selected from a pool of 97 original candidate items, based upon high item-total score correlations and a judgment of face validity by a panel of three psychologists. This instrument was deliberately kept simple -- a shorter response scale and no reversal items -- because of the difficulties associated with measuring a population with SMI. The entire instrument is provided in Appendix A.
All four of the measures evidenced strong reliability and validity. Internal consistency reliability estimates using Cronbach's alpha ranged from .76 for ESE to .88 for SE. Test-retest reliabilities were nearly as high, ranging from .72 for ESE to .83 for the BPRS. Convergent validity was evidenced by the correlations within construct. For the two psychological functioning scales the correlation was .68 while for the self esteem measures it was somewhat lower at .57. Discriminant validity was examined by looking at the cross-construct correlations which ranged from .18 (BPRS-ESE) to .41 (GAS-SE).
Design
A pretest-posttest two-group randomized experimental design was used in this study. In notational form, the design can be depicted as:
R O X O
R O O
where:
R = the groups were randomly assigned
O = the four measures (i.e., BPRS, GAS, RSE, and ESE)
X = supported employment
This type of randomized experimental design is generally strong in internal validity. It rules out threats of history, maturation, testing,
instrumentation, mortality and selection interactions. Its primary weaknesses are in the potential for treatment-related mortality (i.e., a type of selection-mortality) and for problems that result from the reactions of participants and administrators to knowledge of the varying experimental conditions. In this study, the drop-out rate was 4% (N=9) for the control group and 5% (N=13) in the treatment group. Because these rates are low and are approximately equal in each group, it is not plausible that there is differential mortality. There is a possibility that there were some
deleterious effects due to participant knowledge of the other group's existence (e.g., compensatory rivalry, resentful demoralization). Staff were debriefed at several points throughout the study and were explicitly asked about such issues. There were no reports of any apparent negative feelings from the participants in this regard. Nor is it plausible that staff might have equalized conditions between the two groups. Staff were given extensive training and were monitored throughout the course of the study. Overall, this study can be considered strong with respect to internal validity.
Procedure
Between 3/1/93 and 2/28/95 each person admitted to Thresholds who met the study inclusion criteria was immediately assigned a random number that gave them a 50/50 chance of being selected into the study sample. For those selected, the purpose of the study was explained, including the nature of the two treatments, and the need for and use of random assignment. Participants were assured confidentiality and were given an opportunity to decline to participate in the study. Only 7 people (out of 491) refused to participate. At intake, each selected sample member was assigned a random number giving them a 50/50 chance of being assigned to either the Supported Employment condition or the standard in-agency sheltered workshop. In addition, all study participants were given the four measures at intake.
All participants spent the initial two weeks in the program in training and orientation. This consisted of life skill training (e.g., handling money, getting around, cooking and nutrition) and job preparation (employee roles, coping strategies). At the end of that period, each participant was assigned to a job site -- at the agency sheltered workshop for those in the control condition, and to an outside employer if in the Supported Employment group. Control participants were expected to work full-time at the sheltered workshop for a three-month period, at which point they were posttested and given an opportunity to obtain outside employment (either Supported Employment or not). The Supported Employment participants were each assigned a case worker -- called a Mobile Job Support Worker (MJSW) -- who met with the person at the job site two times per week for an hour each time. The MJSW could provide any support or assistance deemed necessary to help the person cope with job stress, including counseling or working beside the person for short periods of time. In addition, the MJSW was always accessible by cellular telephone, and could be called by the participant or the employer at any time. At the end of three months, each participant was post-tested and given the option of staying with their current job (with or without Supported Employment) or moving to the sheltered workshop.
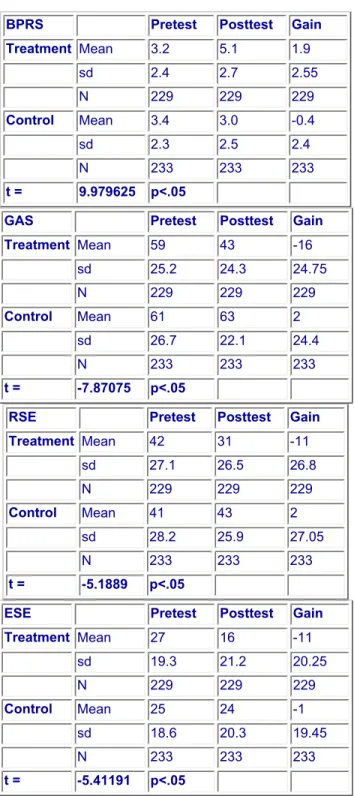
Results
There were 484 participants in the final sample for this study, 242 in each treatment. There were 9 drop-outs from the control group and 13 from the treatment group, leaving a total of 233 and 229 in each group respectively from whom both pretest and posttest were obtained. Due to unexpected difficulties in coping with job stress, 19 Supported Employment participants had to be transferred into the sheltered workshop prior to the posttest. In all 19 cases, no one was transferred prior to week 6 of employment, and 15 were transferred after week 8. In all analyses, these cases were included with the Supported Employment group (intent-to-treat analysis) yielding treatment effect estimates that are likely to be conservative.
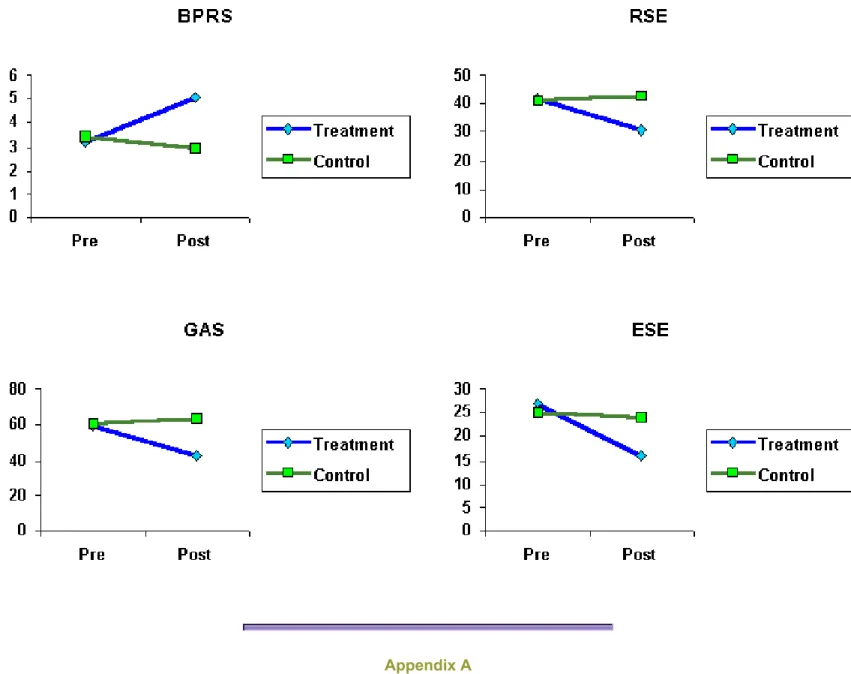
The major results for the four outcome measures are shown in Figure 1.
_______________________________________
<