Draft for Poverty
IT IS POVERTY NOT WORKLESSNESS!
Jonathan Bradshaw, Oleksandr Movshuk and Gwyther Rees
For the last 20 years there has been a mantra among the UK political classes that work was the best solution to poverty. It was the background to the welfare to work ‘New Deal’ programmes in the 2000s. Since 2010 it has been reinforced with more conditionality and punitive sanctions and it has been used to justify many of the austerity measures: the freezing of working-age benefits, the benefit cap, the two-child policy, cuts to employment and support allowance, the bedroom tax and rent limits in housing benefit. All of these measures have contributed to undermining living standards and increasing poverty. Perhaps it reached its apotheosis (or nadir) in the 2017 Department for Work and Pensions paper Improving Lives: Helping Workless Families1. This had been intended to be a Green Paper on social
justice but the change of leadership in the government turned it into a much more limited document focussed yet again on workless families.
The paper concluded there were 1.8 million children in workless families and that in over eight out of ten cases the child was in a long-term workless family – unemployed or inactive for at least 12 months. We have analysed the same data. In fact DWP only take account of ‘benefit units’ - up to two parental figures. Roughly 12% of ‘families’ with no working parent were within households where at least one adult was in employment. The household was not workless.
67% of the ‘long-term workless’ were lone-parent families. Of these:
• 58% were either (a) caring for a sick/disabled/elderly person in the household; and/or (b) had a long-standing illness or disability; and/or (c) received disability-related benefits. • An additional 23% classified their current economic situation as ‘family care or home’ – perhaps indicating child-care responsibilities – and around 4% were in other situations such as being a full-time student.
• So only around 15% of long-term workless lone-parent families were unemployed and apparently available for work.
33% of the ‘long-term workless’ were two-parent families
• In 52% of long-term workless two-parent families, the current economic status of at least one of the parents was ‘unemployed’ suggesting they were available for work. This includes 9% of families where both parents were classified as ‘unemployed’.
• This suggests that in 48% of long-term workless two-parent families neither parent was available or able to work. However the figure will be higher than this because some parents classified as ‘unemployed’ meet one of the three criteria of either (a) caring for a sick/ disabled/elderly person in the household; and/or (b) had a long-standing illness or disability; and/or (c) received disability-related benefits. For example, in around 42% of cases where one parent had a long-standing illness or disability the other parent’s current economic status was defined as ‘family care or home’
1 DWP (2017a) “Improving Lives: Helping Workless Families”,
• So excluding parents who were ‘unemployed’ but met one of the three criteria listed above, around 22% of long-term workless two-parent families have at least one parent who is unemployed and apparently available to work.
So in summary in total, around 17% of families defined as ‘long-term workless’ using the DWP definitions had at least one parent who was unemployed and apparently available to work. Around one in eight of these families were nested within households where other adults such as an adult child or a member of extended family had been in paid work at at least one of the two points in time.
We have undertaken analysis of the Millennium Cohort Survey from sweeps 1-6 when the cohort members were 14 – effectively most of a childhood. We found only 3.9% were persistently workless households at all sweeps (though they might have worked in between). This compares with 8.9% who were persistently poor in all sweeps. Of the persistently workless 63.7% were lone mothers and 52.6% were receiving disability benefits. In sweep 6, 85% were disabled or lone parents – which means 0.59%2 of families may have been
persistently unemployed over that 14 year period. So long term worklessness is a tiny problem.
In fact the obsession with long-term worklessness really distracts us, possibly deliberately, from the much larger problem of in-work poverty.
Poverty and work
There are two ways of exploring the current association between poverty and work. The first is to explore the poverty rates and composition of those currently poor by their employment status. One major driver of the reduction in child poverty in recent years has been the
increased labour supply of lone parents. As a result, the proportion of children in poverty in a lone-parent household fell from 37% in 2006/07 to 27% in 2015/16. At the same time, there has been an increase in the proportion of children living in working poor households – from 54% to 67% over the same period. According to HBAI 2015/16 Table 4.5db the poverty rate of lone parents working full-time is 15% BHC and 29% AHC. The child poverty rate of couple families where both work full-time is only 3% BHC and 5% AHC but if only one parent is able to work it is 26% BHC and 37% AHC. Work is not necessarily a solution to child poverty. According to HBAI 2015/16 Table 4.3db 68% of poor children are living in poor working households BHC and 69% AHC.
The other method is to use model families and calculate their net incomes given the existing tax and benefit rules and then compare them with the poverty thresholds. In table 2 the York Welfare Benefits Unit have taken the rules for universal credit and simulated the composition of the income of a tenant working 40 hours a week for the post April 2017 minimum wage. It is worth noting two factors: first, all these low paid household types are losing some of their earnings in income tax and national insurance contributions; second, benefits make up a substantial proportion of the net income of these household types. In the case of the couple with two children it is 48% of net income BHC and in the case of the lone parent with one child needing child care it is 49% of net income BHC.
Table 2a: Model families, one earner working 40 hours per week on the minimum wage in April 2017 (£7.50 per hour) UNIVERSAL CREDIT
Single Couple Couple plus 2 Lone parent plus
1
Gross earnings 300 300 300 300
Less income tax -16 -16 -16 -16
Less NI contribs -17 -17 -17 -17
Child benefit - - 34.40 20.70
Universal Credit3 25.06 66.74 211.65 235.06[4]
Council tax reduction - - -
-Total before housing
costs and Council Tax 292.06 313.00 513.05 522.76
Total after housing costs
and Council Tax 149.56 163.00 363.05 380.26
Total after housing costs, Council Tax and any childcare costs
228.26
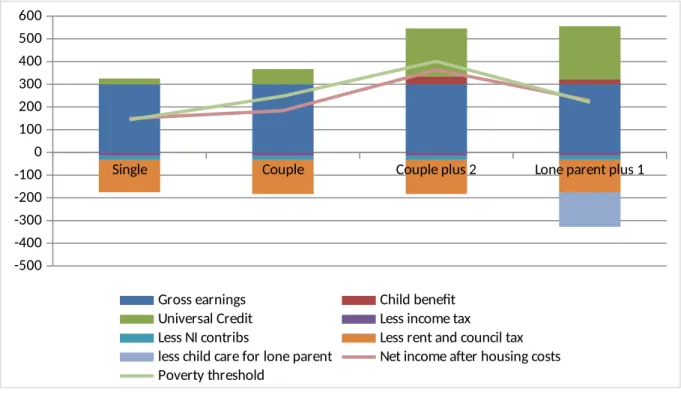
The issue that concerns us is how this relates to poverty. In figures 1 we have shown this. We do not know what median income is going to be in 2017/18 so we have taken the 2015/16 poverty thresholds. Even using this threshold the net income of a couple and a couple with two children do not reach the poverty threshold and a single person and a single parent only just do. If we had used the higher threshold for two years later, and given the freeze in working age benefits, there would certainly be a poverty gap for all these household types – all of them working full-time on the minimum wage, receiving all the benefits they are entitled to would still be in poverty.
3 Assumed rent = £120 per week in the social housing sector.
4 This includes an amount towards child care for the lone parent, £152 per week assumed. Childcare is not
Figure 1: Model families, one earner working 40 hours per week on the minimum wage in April 2017 (£7.50 per hour) UNIVERSAL CREDIT. Comparison with the poverty threshold <60% median 2015/16 income.
Single Couple Couple plus 2 Lone parent plus 1
-500 -400 -300 -200 -100 0 100 200 300 400 500 600
Gross earnings Child benefit
Universal Credit Less income tax
Less NI contribs Less rent and council tax
less child care for lone parent Net income after housing costs Poverty threshold
When the effects of worklessness turn out the effects of income
In claiming the importance of parental work for child outcomes, the government reports as evidence estimates from statistical models. Quite often, this evidence turns out hardly
convincing after a closer scrutiny. Typically, worklessness matters for child outcomes only in most basic of models, particularly the ones where income differences are not accounted for. But when they are accounted for, the effect of worklessness often gets much smaller, and it is income differences that frequently end up having the largest effect on child outcomes.
Improving Lives: Helping Workless Families provides a telling example.
To demonstrate the negative effect of worklessness on children, the paper considered four child outcome measures at age 11 years: a measure of cognitive ability (from British Ability Scales), and three behavioural measure (internalizing problems, externalizing problems, and pro-social behaviours). In each outcome, the paper estimated three models, with an increasing number of explanatory variables. Model 1 included just the effect of workless household and child’s gender. Model 2 added various child and household characteristics, while Model 3 included also the effect of income differences.
For differences in cognitive development, the most basic Model 1 indicated that children in workless households had worse outcomes, in agreement with the government’s claim that parental worklessness is detrimental for children. The size of the negative effect was also significant in statistical terms (DWP, 2017b, Table 1, p. 12)5. With more explanatory
5 DWP (2017b) “Improving Lives: Helping Workless Families. Supporting Methodology Document”,
variables in Model 2, the negative effect of worklessness became smaller (by around one half), but still remained statistically significant. Most tellingly, with added income differences in Model 3, workless households no longer showed a significant difference in cognitive outcomes. In other words, once Model 3 accounted for differences by incomes, children in workless households had comparable cognitive outcomes to households where parents worked, directly contradicting the government’s claim in the paper that it is worklessness that is detrimental for child outcomes.
Moreover, not only was the effect of workless households insignificant, it was income differences that showed significant effects on child outcomes (ibid., p. 13). Evidently, the initial findings in Models 1 and 2 reflected their failure to account properly for income, rather than the importance of worklessness per se.
The pattern remained the same for the remaining three child outcomes, with workless households no longer showing significant differences in child outcomes after income differences were added in Model 3. The paper, however, claimed a “significant effect” on pro-social behaviour (DWP, 2017b, Table 11, p. 24), but was able to do so only after
changing the threshold of statistical significance from 0.05 (the most conventional level) to a more lenient level of 0.10 (DWP, 2017c, p. 14)6. The 0.10 threshold is rarely used in applied
work, and if used, mostly as a last refuge to claim significant results after tests of 0.05 significance level failed to produce desired results. In consequence, this custom-based selection of significance levels does not indicate a sound scientific practice, but rather an extensive data-mining to get results that fit the paper’s agenda, after the conventional statistical analysis failed to do so.
The pattern did not change much after the paper separated households into persistent and episodic worklessness. Once again, the effect of persistent worklessness was greatly alleviated after income differences were accounted in Model 3. Moreover, persistent
worklessness became insignificant in 2 out of 4 child outcomes, including, in particular, child cognitive ability.
In our current work, we have also examined the persistent effects of income poverty and worklessness, using 5 sweeps of Millennium Cohort Study. We examined both direct and indirect effects on cognitive outcomes from 9 months to age 11, using the approach of Structural Equation Modelling (SEM). The direct effects in the SEM are the easiest ones to visualise; they are just estimates for included explanatory variables (such as the effect of poverty at age 11 on test scores at age 11). Indirect effects are not estimated, but derived from various associations within SEM models. For example, imagine the two following
associations between test scores and poverty: first, test scores at age 11 depend on test scores at age 9, and second, test scores at age 9 depend on poverty at age 9. Then the effect of poverty (at age 9) on test scores (at age 11) would be an indirect effect. It is not directly estimated, but could be derived from the effect of poverty on test scores at age 9, and the effect of test scores at age 9 on test scores at age 11.
Most of previous studies focused only on direct effects, but we found that indirect effects of past experience of poverty (such as the effect of poverty at 9 month on test scores at age 11)
6 DWP (2017c) “Improving Lives: Helping Workless Families. Analysis and Research Pack”,
is more detrimental to the cognitive development of children. For worklessness, indirect effects were also more important than direct effects.
When we summed up direct and indirect effects across 5 sweeps of the Millennium Cohort Study, and compared the total effect of poverty and worklessness, we found that the negative effect from poverty was more than eight times larger compared with worklessness. To visualise the magnitude of this difference, it is useful to divide children into 100 groups (or technically speaking, percentiles) by cognitive development. Then poverty experience by age 11 reduced the percentile ranking of children by around 30 positions, whilst the
corresponding reduction for worklessness was just four positions. This means that for the brightest children in the 1st percentile, persistent poverty gives them no chance to succeed in
cognitive development, and places them at the 31 percentile rank, or almost a third of other children. In contrast, the detrimental effect from worklessness is less dramatic, with the brightest children moving their rank from the 1st to the 5th percentile.
Conclusion
The living standards of most working age households is determined by wages and those wages have tended to become a better solution to poverty as they have been regulated by equal pay legislation and the statutory minimum wage. But earning wages is not by itself a solution to poverty. It depends on how wages are taxed and it depends crucially on the value of cash benefits, especially those paid in respect of families with children. Cash benefits have been cut by huge amounts in recent years and that is why poverty is now mainly a problem for those in employment. George Osborne claimed his higher minimum wage for those over 25 pegged to 60% median earnings by 2020 was a "new settlement" - a large scale shift from being a "low wage, high tax, high welfare economy to a higher wage, lower tax, lower welfare".
But the impact of increased wages is being undermined by frozen and cut in-work benefits. The cumulative loss from these cuts since 2010 is £27 bn/year. Just the post 2015 cuts will by 2021 result in couples with two or more dependent children losing £1,450/year and lone parents with two or more will lose £1,750/year7. The Child Poverty Action Group
(forthcoming) has recently published PPI modelling estimates of the impact of the cuts in in work benefits between 2010 and 2016 on eight families. Only one would be consistently better off after the cuts - a couple with two children with a second earner working more than six hours a week in a high housing costs area and with no childcare.
The consequence of these cuts is that the Institute for Fiscal Studies expects UK relative child poverty to increase from 19% in 2014/15 to 27% in 2021/22 before housing costs and from 29% to 36% after housing costs.
7 Beatty, C. & Fothergill, S. (2016). The Uneven Impact of Welfare Reform: The financial losses to places and