On Some Pitfalls in Automatic Evaluation and Significance Testing for MT
Stefan Riezler and John T. Maxwell III
Palo Alto Research Center
3333 Coyote Hill Road, Palo Alto, CA 94304
Abstract
We investigate some pitfalls regarding the discriminatory power of MT evaluation metrics and the accuracy of statistical sig-nificance tests. In a discriminative rerank-ing experiment for phrase-based SMT we show that the NIST metric is more sensi-tive than BLEU or F-score despite their in-corporation of aspects of fluency or mean-ing adequacy into MT evaluation. In an experimental comparison of two statistical significance tests we show that p-values are estimated more conservatively by ap-proximate randomization than by boot-strap tests, thus increasing the likelihood of type-I error for the latter. We point out a pitfall of randomly assessing signif-icance in multiple pairwise comparisons, and conclude with a recommendation to combine NIST with approximate random-ization, at more stringent rejection levels than is currently standard.
1 Introduction
Rapid and accurate detection of result differences is crucial in system development and system bench-marking. In both situations a multitude of systems or system variants has to be evaluated, so it is highly desirable to employ automatic evaluation measures for detection of result differences, and statistical hy-pothesis tests to assess the significance of the de-tected differences. When evaluating subtle differ-ences between system variants in development, or
when benchmarking multiple systems, result differ-ences may be very small in magnitude. This imposes strong requirements on both automatic evaluation measures and statistical significance tests: Evalua-tion measures are needed that have high discrimi-native power and yet are sensitive to the interesting aspects of the evaluation task. Significance tests are required to be powerful and yet accurate, i.e., if there are significant differences they should be able to as-sess them, but not if there are none.
In the area of statistical machine translation (SMT), recently a combination of the BLEU evalua-tion metric (Papineni et al., 2001) and the bootstrap method for statistical significance testing (Efron and Tibshirani, 1993) has become popular (Och, 2003; Kumar and Byrne, 2004; Koehn, 2004b; Zhang et al., 2004). Given the current practice of reporting result differences as small as .3% in BLEU score, assessed at confidence levels as low as 70%, ques-tions arise concerning the sensitivity of the em-ployed evaluation metrics and the accuracy of the employed significance tests, especially when result differences are small. We believe that is important to accurately detect such small-magnitude differences in order to understand how to improve systems and technologies, even though such differences may not matter in current applications.
In this paper we will investigate some pitfalls that arise in automatic evaluation and statistical signifi-cance testing in MT research. The first pitfall con-cerns the discriminatory power of automatic eval-uation measures. In the following, we compare the sensitivity of three intrinsic evaluation measures that differ with respect to their focus on different aspects
of translation. We consider the well-known BLEU score (Papineni et al., 2001) which emphasizes flu-ency by incorporating matches of high n-grams. Fur-thermore, we consider an F-score measure that is adapted from dependency-based parsing (Crouch et al., 2002) and sentence-condensation (Riezler et al., 2003). This measure matches grammatical depen-dency relations of parses for system output and ref-erence translations, and thus emphasizes semantic aspects of translational adequacy. As a third mea-sure we consider NIST (Doddington, 2002), which favors lexical choice over word order and does not take structural information into account. On an ex-perimental evaluation on a reranking experiment we found that only NIST was sensitive enough to de-tect small result differences, whereas BLEU and F-score produced result differences that were statisti-cally not significant. A second pitfall addressed in this paper concerns the relation of power and ac-curacy of significance tests. In situations where the employed evaluation measure produces small result differences, the most powerful significance test is demanded to assess statistical significance of the re-sults. However, accuracy of the assessments of sig-nificance is seldom questioned. In the following, we will take a closer look at the bootstrap test and compare it with the related technique of approxi-mate randomization (Noreen (1989)). In an exper-imental evaluation on our reranking data we found that approximate randomization estimatedp-values more conservatively than the bootstrap, thus increas-ing the likelihood of type-I error for the latter test. Lastly, we point out a common mistake of randomly assessing significance in multiple pairwise compar-isons (Cohen, 1995). This is especially relevant in
k-fold pairwise comparisons of systems or system variants where k is high. Taking this multiplicity problem into account, we conclude with a recom-mendation of a combination of NIST for evaluation and the approximate randomization test for signifi-cance testing, at more stringent rejection levels than is currently standard in the MT literature. This is es-pecially important in situations where multiple pair-wise comparisons are conducted, and small result differences are expected.
2 The Experimental Setup: Discriminative Reranking for Phrase-Based SMT
The experimental setup we employed to compare evaluation measures and significance tests is a dis-criminative reranking experiment on1000-best lists of a phrase-based SMT system. Our system is a re-implementation of the phrase-based system de-scribed in Koehn (2003), and uses publicly avail-able components for word alignment (Och and Ney, 2003)1, decoding (Koehn, 2004a)2, language mod-eling (Stolcke, 2002)3 and finite-state processing (Knight and Al-Onaizan, 1999)4. Training and test data are taken from the Europarl parallel corpus (Koehn, 2002)5.
Phrase-extraction follows Och et al. (1999) and was implemented by the authors: First, the word aligner is applied in both translation directions, and the intersection of the alignment matrices is built. Then, the alignment is extended by adding immedi-ately adjacent alignment points and alignment points that align previously unaligned words. From this many-to-many alignment matrix, phrases are ex-tracted according to a contiguity requirement that states that words in the source phrase are aligned only with words in the target phrase, and vice versa.
Discriminative reranking on a 1000-best list of translations of the SMT system uses an `1 regu-larized log-linear model that combines a standard maximum-entropy estimator with an efficient, in-cremental feature selection technique for `1 regu-larization (Riezler and Vasserman, 2004). Training data are defined as pairs{(sj, tj)}mj=1of source sen-tencessj and gold-standard translations tj that are
determined as the translations in the 1000-best list that best match a given reference translation. The objective function to be minimized is the conditional log-likelihoodL(λ)subject to a regularization term
R(λ), whereT(s)is the set of 1000-best translations for sentences,λis a vector or log-parameters, and
1
http://www.fjoch.com/GIZA++.html
2http://www.isi.edu/licensed-sw/pharaoh/ 3http://www.speech.sri.com/projects/srilm/ 4
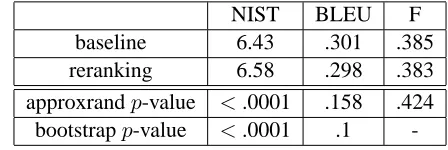
Table 1: NIST, BLEU, F-scores for reranker and baseline on development set
NIST BLEU F
baseline 6.43 .301 .385 reranking 6.58 .298 .383 approxrandp-value <.0001 .158 .424 bootstrapp-value <.0001 .1
-f is a vector of feature functions:
L(λ) +R(λ) = −log m
Y
j=1
pλ(tj|sj) +R(λ)
= −
m
X
j=1
log e
λ·f(tj)
P
t∈T(sj)
eλ·f(t) +R(λ)
The features employed in our experiments con-sist of 8 features corresponding to system compo-nents (distortion model, language model, phrase-translations, lexical weights, phrase penalty, word penalty) as provided by PHARAOH, together with a multitude of overlapping phrase features. For exam-ple, for a phrase-table of phrases consisting of max-imally 3 words, we allow all 3-word phrases and 2-word phrases as features. Since bigram features can overlap, information about trigrams can be gathered by composing bigram features even if the actual tri-gram is not seen in the training data.
Feature selection makes it possible to employ and evaluate a large number of features, without con-cerns about redundant or irrelevant features hamper-ing generalization performance. The`1regularizer is defined by the weighted`1-norm of the parameters
R(λ) =γ||λ||1 =γ
n
X
i=1 |λi|
whereγis a regularization coefficient, andnis num-ber of parameters. This regularizer penalizes overly large parameter values in their absolute values, and tends to force a subset of the parameters to be ex-actly zero at the optimum. This fact leads to a natural integration of regularization into incremental feature selection as follows: Assuming a tendency of the`1 regularizer to produce a large number of zero-valued parameters at the function’s optimum, we start with all-zero weights, and incrementally add features to
the model only if adjusting their parameters away from zero sufficiently decreases the optimization cri-terion. Since every non-zero weight added to the model incurs a regularizer penalty of γ|λi|, it only
makes sense to add a feature to the model if this penalty is outweighed by the reduction in negative log-likelihood. Thus features considered for selec-tion have to pass the following test:
∂L(λ) ∂λi
> γ
This gradient test is applied to each feature and at each step the features that pass the test with maxi-mum magnitude are added to the model. This pro-vides both efficient and accurate estimation with large feature sets.
Work on discriminative reranking has been re-ported before by Och and Ney (2002), Och et al. (2004), and Shen et al. (2004). The main purpose of our reranking experiments is to have a system that can easily be adjusted to yield system variants that differ at controllable amounts. For quick experimen-tal turnaround we selected the training and test data from sentences with 5 to 15 words, resulting in a training set of 160,000 sentences, and a development set of 2,000 sentences. The phrase-table employed was restricted to phrases of maximally 3 words, re-sulting in 200,000 phrases.
3 Detecting Small Result Differences by Intrinsic Evaluations Metrics
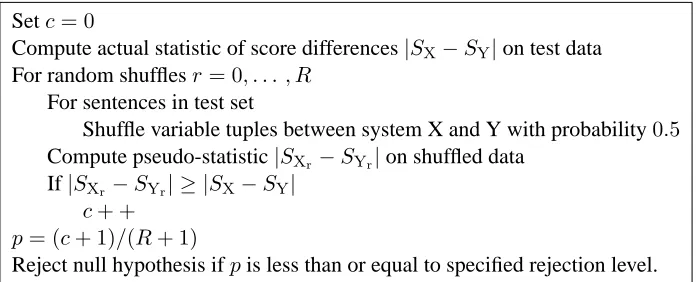
Setc= 0
Compute actual statistic of score differences|SX−SY|on test data For random shufflesr= 0, . . . , R
For sentences in test set
Shuffle variable tuples between system X and Y with probability0.5
Compute pseudo-statistic|SXr−SYr|on shuffled data
If|SXr−SYr| ≥ |SX−SY| c+ +
p= (c+ 1)/(R+ 1)
[image:4.612.133.481.54.195.2]Reject null hypothesis ifpis less than or equal to specified rejection level.
Figure 1: Approximate Randomization Test for Statistical Significance Testing
evaluate document similarity of SMT output against manually created reference translations. The mea-sures differ in their focus on different entities in matching, corresponding to a focus on different as-pects of translation quality.
BLEU and NIST both consider n-grams in source and reference strings as matching entities. BLEU weighs all n-grams equally whereas NIST puts more weight on n-grams that are more informative, i.e., occur less frequently. This results in BLEU favor-ing matches in larger n-grams, correspondfavor-ing to giv-ing more credit to correct word order. NIST weighs lower n-grams more highly, thus it gives more credit to correct lexical choice than to word order.
F-score is computed by parsing reference sen-tences and SMT outputs, and matching grammatical dependency relations. The reported value is the har-monic mean of precision and recall, which is defined as(2× precision × recall)/(precision + recall). Precision is the ratio of matching dependency re-lations to the total number of dependency rere-lations in the parse for the system translation, and recall is the ratio of matches to the total number of depen-dency relations in the parse for the reference trans-lation. The goal of this measure is to focus on as-pects of meaning in measuring similarity of system translations to reference translations, and to allow for meaning-preserving word order variation.
Evaluation results for a comparison of rerank-ing against a baseline model that only includes fea-tures corresponding to the 8 system components are shown in Table 1. Since the task is a comparison of system variants for development, all results are reported on the development set of 2,000
exam-ples of length 5-15. The reranking model achieves an increase in NIST score of .15 units, whereas BLEU and F-score decrease by .3% and .2% respec-tively. However, as measured by the statistical sig-nificance tests described below, the differences in BLEU and F-scores are not statistically significant withp-values exceeding the standard rejection level of .05. In contrast, the differences in NIST score are highly significant. These findings correspond to results reported in Zhang et al. (2004) showing a higher sensitivity of NIST versus BLEU to small re-sult differences. Taking also the rere-sults from F-score matching in account, we can conclude that similar-ity measures that are based on matching more com-plex entities (such as BLEU’s higher n-grams or F’s grammatical relations) are not as sensitive to small result differences as scoring techniques that are able to distinguish models by matching simpler entities (such as NIST’s focus on lexical choice). Further-more, we get an indication that differences of .3% in BLEU score or .2% in F-score might not be large enough to conclude statistical significance of result differences. This leads to questions of power and ac-curacy of the employed statistical significance tests which will be addressed in the next section.
4 Assessing Statistical Significance of Small Result Differences
Setc= 0
Compute actual statistic of score differences|SX−SY|on test data
Calculate sample meanτB = B1 PBb=0|SXb−SYb|over bootstrap samplesb= 0, . . . , B
For bootstrap samplesb= 0, . . . , B
Sample with replacement from variable tuples for systems X and Y for test sentences Compute pseudo-statistic|SXb−SYb|on bootstrap data
If|SXb−SYb| −τB (+τ)≥ |SX−SY| c+ +
p= (c+ 1)/(B+ 1)
[image:5.612.106.506.67.191.2]Reject null hypothesis ifpis less than or equal to specified rejection level.
Figure 2: Bootstrap Test for Statistical Significance Testing
is unknown. Comparative evaluations of outputs of SMT systems according to test statistics such as dif-ferences in BLEU, NIST, or F-score are examples of this situation. The attractiveness of computer-intensive significance tests such as the bootstrap or the approximate randomization method lies in their power and simplicity. As noted in standard textbooks such as Cohen (1995) or Noreen (1989) such tests are as powerful as parametric tests when parametric assumptions are met and they outper-form them when parametric assumptions are vio-lated. Because of their generality and simplicity they are also attractive alternatives to conventional non-parametric tests (see, e.g., Siegel (1988)). The power of these tests lies in the fact that they answer only a very simple question without making too many as-sumptions that may not be met in the experimen-tal situation. In case of the approximate random-ization test, only the question whether two sam-ples are related to each other is answered, with-out assuming that the samples are representative of the populations from which they were drawn. The bootstrap method makes exactly this one assump-tion. This makes it formally possible to draw in-ferences about population parameters for the boot-strap, but not for approximate randomization. How-ever, if the goal is to assess statistical significance of a result difference between two systems the ap-proximate randomization test provides the desired power and accuracy whereas the bootstrap’s advan-tage to draw inferences about population parameters comes at the price of reduced accuracy. Noreen sum-marizes this shortcoming of the bootstrap technique as follows: “The principal disadvantage of [the
boot-strap] method is that the null hypothesis may be re-jected because the shape of the sampling distribution is not well-approximated by the shape of the boot-strap sampling distribution rather than because the expected value of the test statistic differs from the value that is hypothesized.”(Noreen (1989), p. 89). Below we describe these two test procedures in more detail, and compare them in our experimental setup.
4.1 Approximate Randomization
An excellent introduction to the approximate ran-domization test is Noreen (1989). Applications of this test to natural language processing problems can be found in Chinchor et al. (1993).
In our case of assessing statistical significance of result differences between SMT systems, the test statistic of interest is the absolute value of the differ-ence in BLEU, NIST, or F-scores produced by two systems on the same test set. These test statistics are computed by accumulating certain count variables over the sentences in the test set. For example, in case of BLEU and NIST, variables for the length of reference translations and system translations, and for n-gram matches and n-gram counts are accumu-lated over the test corpus. In case of F-score, vari-able tuples consisting of the number of dependency-relations in the parse for the system translation, the number of dependency-relations in the parse for the reference translation, and the number of matching dependency-relations between system and reference parse, are accumulated over the test set.
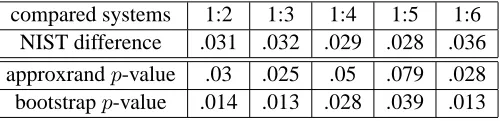
Table 2: NIST scores for equivalent systems under bootstrap and approximate randomization tests.
compared systems 1:2 1:3 1:4 1:5 1:6 NIST difference .031 .032 .029 .028 .036 approxrandp-value .03 .025 .05 .079 .028 bootstrapp-value .014 .013 .028 .039 .013
likely by the other system. So shuffling the variable tuples between the two systems with equal probabil-ity, and recomputing the test statistic, creates an ap-proximate distribution of the test statistic under the null hypothesis. For a test set of S sentences there are 2S different ways to shuffle the variable tuples
between the two systems. Approximate randomiza-tion produce shuffles by random assignments instead of evaluating all 2S possible assignments.
Signifi-cance levels are computed as the percentage of trials where the pseudo statistic, i.e., the test statistic com-puted on the shuffled data, is greater than or equal to the actual statistic, i.e., the test statistic computed on the test data. A sketch of an algorithm for approxi-mate randomization testing is given in Fig. 1.
4.2 The Bootstrap
An excellent introduction to the technique is the textbook by Efron and Tibshirani (1993). In contrast to approximate randomization, the bootstrap method makes the assumption that the sample is a repre-sentative “proxy” for the population. The shape of the sampling distribution is estimated by repeatedly sampling (with replacement) from the sample itself. A sketch of a procedure for bootstrap testing is given in Fig. 2. First, the test statistic is computed on the test data. Then, the sample mean of the pseudo statistic is computed on the bootstrapped data, i.e., the test statistic is computed on bootstrap samples of equal size and averaged over bootstrap samples.
In order to compute significance levels based on the bootstrap sampling distribution, we employ the “shift” method described in Noreen (1989). Here it is assumed that the sampling distribution of the null hypothesis and the bootstrap sampling distribution have the same shape but a different location. The location of the bootstrap sampling distribution is shifted so that it is centered over the location where the null hypothesis sampling distribution should be centered. This is achieved by subtracting from each
value of the pseudo-statistic its expected value τB
and then adding back the expected value τ of the test statistic under the null hypothesis.τBcan be
es-timated by the sample mean of the bootstrap sam-ples;τ is 0 under the null hypothesis. Then, similar to the approximate randomization test, significance levels are computed as the percentage of trials where the (shifted) pseudo statistic is greater than or equal to the actual statistic.
4.3 Power vs. Type I Errors
comparisons, the bootstrap would assess statistical significance in 3 out of 5 cases whereas statistical significance would not be assessed under approxi-mate randomization. Assuming equivalence of the compared system variants, these assessments would count as type-I errors.
4.4 The Multiplicity Problem
In the experiment on type-I error described above, a more stringent rejection level than the usual.05was assumed. This was necessary to circumvent a com-mon pitfall in significance testing fork-fold pairwise comparisons. Following the argumentation given in Cohen (1995), the probability of randomly assess-ing statistical significance for result differences in
k-fold pairwise comparisons grows exponentially in
k. Recall that for a pairwise comparison of systems, specifying thatp < .05means that the probability of incorrectly rejecting the null hypothesis that the sys-tems are not different be less than.05. Caution has to be exercised ink-fold pairwise comparisons: For a probabilitypc of incorrectly rejecting the null
hy-pothesis in a specific pairwise comparison, the prob-abilitype of at least once incorrectly rejecting this
null hypothesis in an experiment involving k pair-wise comparisons is
pe ≈1−(1−pc)k
For large values ofk, the probability of concluding result differences incorrectly at least once is unde-sirably high. For example, in benchmark testing of 15 systems,15(15−1)/2 = 105pairwise compar-isons will have to be conducted. At a per-comparison rejection level pc = .05 this results in an
experi-mentwise errorpe = .9954, i.e., the probability of
at least one spurious assessment of significance is
1−(1−.05)105 =.9954. One possibility to reduce the likelihood that one ore more of differences as-sessed in pairwise comparisons is spurious is to run the comparisons at a more stringent per-comparison rejection level. Reducing the per-comparison rejec-tion level pc until an experimentwise error ratepe
of a standard value, e.g.,.05, is achieved, will favor
pe over pc. In the example of 5 pairwise
compar-isons described above, a per-comparison error rate
pc = .015was sufficient to achieve an
experimen-twise error rate pe ≈ .07. In many cases this
tech-nique would require to reducepc to the point where
a result difference has to be unrealistically large to be significant. Here conventional tests for post-hoc comparisons such as the Scheff´e or Tukey test have to be employed (see Cohen (1995), p. 185ff.).
5 Conclusion
Situations where a researcher has to deal with subtle differences between systems are common in system development and large benchmark tests. We have shown that it is useful in such situations to trade in expressivity of evaluation measures for sensitivity. For MT evaluation this means that recording differ-ences in lexical choice by the NIST measure is more useful than failing to record differences by employ-ing measures such as BLEU or F-score that incorpo-rate aspects of fluency and meaning adequacy into MT evaluation. Similarly, in significance testing, it is useful to trade in the possibility to draw inferences about the sampling distribution for accuracy and power of the test method. We found experimental evidence confirming textbook knowledge about re-duced accuracy of the bootstrap test compared to the approximate randomization test. Lastly, we pointed out a well-known problem of randomly assessing significance in multiple pairwise comparisons. Tak-ing these findTak-ings together, we recommend for mul-tiple comparisons of subtle differences to combine the NIST score for evaluation with the approximate randomization test for significance testing, at more stringent rejection levels than is currently standard in the MT literature.
References
Nancy Chinchor, Lynette Hirschman, and David D. Lewis. 1993. Evaluating message understanding sys-tems: An analysis of the third message understand-ing conference (MUC-3). Computational Lunderstand-inguistics, 19(3):409–449.
Paul R. Cohen. 1995. Empirical Methods for Artificial
Intelligence. The MIT Press, Cambridge, MA.
Richard Crouch, Ronald M. Kaplan, Tracy H. King, and Stefan Riezler. 2002. A comparison of evaluation metrics for a broad-coverage stochastic parser. In
Pro-ceedings of the ”Beyond PARSEVAL” Workshop at the 3rd International Conference on Language Resources and Evaluation (LREC’02), Las Palmas, Spain.
statistics. In Proceedings of the ARPA Workshop on
Human Language Technology.
Bradley Efron and Robert J. Tibshirani. 1993. An
In-troduction to the Bootstrap. Chapman and Hall, New
York.
Kevin Knight and Yaser Al-Onaizan. 1999. A primer on finite-state software for natural language processing. Technical report, USC Information Sciences Institute, Marina del Rey, CA.
Philipp Koehn, Franz Josef Och, and Daniel Marcu. 2003. Statistical phrase-based translation. In
Proceed-ings of the Human Language Technology Conference and the 3rd Meeting of the North American Chapter of the Association for Computational Linguistics (HLT-NAACL’03), Edmonton, Cananda.
Philipp Koehn. 2002. Europarl: A multilingual corpus for evaluation of machine translation. Technical re-port, USC Information Sciences Institute, Marina del Rey, CA.
Philipp Koehn. 2004a. PHARAOH. a beam search de-coder for phrase-based statistical machine translation models. user manual. Technical report, USC Informa-tion Sciences Institute, Marina del Rey, CA.
Philipp Koehn. 2004b. Statistical significance tests for machine translation evaluation. In Proceedings of the
2004 Conference on Empirical Methods in Natural Language Processing (EMNLP’04), Barcelona, Spain.
Shankar Kumar and William Byrne. 2004. Minimum Bayes-risk decoding for statistical machine transla-tion. In Proceedings of the Human Language
Technol-ogy conference / North American chapter of the Asso-ciation for Computational Linguistics annual meeting (HLT/NAACL’04), Boston, MA.
Eric W. Noreen. 1989. Computer Intensive Methods for Testing Hypotheses. An Introduction. Wiley, New
York.
Franz Josef Och and Hermann Ney. 2002. Discrimina-tive training and maximum entropy models for statis-tical machine translation. In Proceedings of the 40th
Annual Meeting of the Association for Computational Linguistics (ACL’02), Philadelphia, PA.
Franz Josef Och and Hermann Ney. 2003. A system-atic comparison of various statistical alignment mod-els. Computational Linguistics, 29(1):19–51.
Franz Josef Och, Christoph Tillmann, and Hermann Ney. 1999. Improved alignment models for statistical ma-chine translation. In Proceedings of the 1999
Confer-ence on Empirical Methods in Natural Language Pro-cessing (EMNLP’99).
Franz Josef Och, Daniel Gildea, Sanjeev Khudanpur, Anoop Sarkar, Kenji Yamada, Alex Fraser, Shankar Kumar, Libin Shen, David Smith, Ketherine Eng, Viren Jain, Zhen Jin, and Dragomir Radev. 2004. A smorgasbord of features for statistical machine transla-tion. In Proceedings of the Human Language
Technol-ogy conference / North American chapter of the Asso-ciation for Computational Linguistics annual meeting (HLT/NAACL’04), Boston, MA.
Franz Josef Och. 2003. Minimum error rate train-ing in statistical machine translation. In Proceedtrain-ings
of the Human Language Technology Conference and the 3rd Meeting of the North American Chapter of the Association for Computational Linguistics (HLT-NAACL’03), Edmonton, Cananda.
Kishore Papineni, Salim Roukos, Todd Ward, and Wei-Jing Zhu. 2001. Bleu: a method for automatic evaluation of machine translation. Technical Report IBM Research Division Technical Report, RC22176 (W0190-022), Yorktown Heights, N.Y.
Stefan Riezler and Alexander Vasserman. 2004. Incre-mental feature selection and`1 regularization for
re-laxed maximum-entropy modeling. In Proceedings of
the 2004 Conference on Empirical Methods in Natural Language Processing (EMNLP’04), Barcelona, Spain.
Stefan Riezler, Tracy H. King, Richard Crouch, and An-nie Zaenen. 2003. Statistical sentence condensation using ambiguity packing and stochastic disambigua-tion methods for lexical-funcdisambigua-tional grammar. In
Pro-ceedings of the Human Language Technology Confer-ence and the 3rd Meeting of the North American Chap-ter of the Association for Computational Linguistics (HLT-NAACL’03), Edmonton, Cananda.
Libin Shen, Anoop Sarkar, and Franz Josef Och. 2004. Discriminative reranking for machine translation. In
Proceedings of the Human Language Technology con-ference / North American chapter of the Associa-tion for ComputaAssocia-tional Linguistics annual meeting (HLT/NAACL’04), Boston, MA.
Sidney Siegel. 1988. Nonparametric Statistics for the
Behavioral Sciences. Second Edition. MacGraw-Hill,
Boston, MA.
Andreas Stolcke. 2002. SRILM - an extensible language modeling toolkit. In Proceedings of the International
Conference on Spoken Language Processing, Denver,
CO.
Ying Zhang, Stephan Vogel, and Alex Waibel. 2004. Interpreting BLEU/NIST scores: How much improve-ment do we need to have a better system? In
Proceed-ings of the 4th International Conference on Language Resources and Evaluation (LREC’04), Lisbon,