Title: Plasma cBIN1 Score (CS) Identifies HFpEF and Can Predict Cardiac Hospitalization in Stable Ambulatory Patients
Short Title: Nikolova, CS as a blood based score of HFpEF patients
Authors: Andriana P. Nikolova 1, Tara C. Hitzeman 1, Rachel Baum1, Bing Xu 1, Sosse
Agvanian1, Yu Xie 1, Dael R. Geft 1,2, David H. Chang 1,2, Jaime D. Moriguchi 1,2, Antoine Hage 1,2, Babak Azarbal 1,2, Lawrence S. Czer 1,2, Michelle M. Kittleson 1,2, Jignesh K. Patel 1,2, Alan
H. B. Wu 3, Jon A. Kobashigawa 1,2, Michele Hamilton 1,2, TingTing Hong 1,2*, Robin M. Shaw 1,2*
1 Division of Cardiology, Cedars-Sinai Heart Institute and Department of Medicine, Cedars-Sinai
Medical Center, Los Angeles, CA 90048, USA
2 Division of Cardiology, Department of Medicine, University of California Los Angeles, Los Angeles,
CA 90095, USA
3 Department of Laboratory Medicine, University of California San Francisco, San Francisco,
CA 94110, USA
*Co-corresponding authors: TingTing Hong, MD, PhD and Robin M. Shaw, MD, PhD 8700 Beverly Blvd., Davis Bldg. #1016
Los Angeles, CA 90048 Fax: 310-9673891 Tel: 310-9673842
Email: [email protected] and [email protected]
ABBREVIATIONS: AUC – area under the curve
BIN1 – bridging integrator 1
BMI – body mass index
BNP – brain natriuretic peptide
cBIN1 – cardiac bridging integrator 1
CS – cBIN1 ScoreHF – heart failure
HFpEF – heart failure with preserved ejection fraction
HR – hazard ratio
IQR – interquartile range
LVEF – left ventricular ejection fraction
NT-proBNP - N-terminal prohormone of brain natriuretic peptide
NYHA – New York Heart Association
ROC – receiver operating characteristic
ABSTRACT
Objective: We determined, in stable ambulatory heart failure with preserved ejection fraction (HFpEF) subjects and matched controls, the capability of a novel blood based cardiac-specific
cBIN1 Score (CS) to diagnose heart failure and prognosticate future hospitalization.
Background: Heart failure (HF) poses a costly health care burden worldwide with rising prevalence. Abnormal calcium signaling is intrinsic to HF pathophysiology and correlates with
reduced expression of a cardiac membrane scaffolding protein, cardiac bridging integrator 1
(cBIN1). We hypothesize that CS, a numerical score derived from plasma cBIN1 concentration,
is a diagnostic and prognostic biomarker of HF.
Methods: Plasma cBIN1 is quantified by an ELISA test, and CS is calculated as the natural log of the normalized reciprocal of plasma cBIN1 concentration. We determined CS among 52
clinically stable individuals with HFpEF (LVEF ≥ 50%) (mean age 57 ± 15 years old, 63% men)
and 104 age and sex matched volunteers with no known history of HF. We obtained plasma
concentrations of NT-proBNP, a marker of volume status, as comparison. Baseline
co-morbidities and one year longitudinal clinical information were obtained through electronic
medical records.
Results: Median CS is 0 (IQR -0.4 – 0.6) in the control cohort and is increased to 1.8 in the HFpEF cohort (IQR 1.5 – 2.3, p < 0.0001). For HFpEF diagnosis, CS has a receiver operating
characteristic (ROC) area under the curve (AUC) of 0.94 (95% CI 0.95 – 0.99) and NT-proBNP
of 0.89 (95% CI 0.83 – 0.95). Kaplan-Meier analysis of one year cardiovascular hospitalizations
reveals that HFpEF patients with CS ≥ 1.8 have a hazard ratio (HR) of 4.0 (95% CI 1.4 – 11.2,
Conclusions: In a cohort of stable ambulatory HF patients with cardiomyopathies of multiple etiologies and preserved ejection fraction, a positive CS correlates with worsening myocardial
health and predicts future hospitalization. CS, a marker of cardiac muscle health, provides a
novel index to informing the management of stable ambulatory HF patients.
KEY WORDS: biomarkers; heart failure with preserved ejection fraction (HFpEF); cBIN1; cBIN1 Score (CS)
INTRODUCTION
Heart failure (HF) is an ever-growing epidemic worldwide with high burden of both
morbidity and mortality [1, 2]. Approximately 50% of this patient population has a phenotype
characterized by a preserved left ventricular ejection fraction (LVEF) [1]. HF is a clinical
diagnosis, which reflects the sequelae of diseased myocardium manifesting ultimately with
familiar symptoms that include fluid retention, effort intolerance, and dyspnea. In our current
clinical armamentarium, we have limited diagnostic tools to assess myocardial health. As
surrogates, we rely on markers reflective of myocardial stretch as well as inflammatory,
metabolic and fibrotic pathways, which are not specific to HF pathogenesis, but are affected in a
broad array of conditions such as diabetes and hypertension.
The most validated biomarker family used in clinical practice is brain natriuretic peptide
(BNP) and its N-terminal peptide (NT-proBNP), which increase in response to volume and
pressure overload in the myocardium [3]. Albeit useful for the diagnosis of acute HF in patients
presenting with dyspnea, approximately 30% of symptomatic heart failure with preserved
ejection fraction (HFpEF) patients with chronic HF symptoms have normal BNP levels, despite
elevation in pulmonary capillary wedge pressures. Such patients are less frequently prescribed
needed therapy with diuretics for symptom relief [4, 5]. Furthermore, BNP metabolism is
affected by adiposity, thus limiting its use in a patient population most in need of a HF marker,
namely the obese [6-8]. In this single-center study, we explore a novel biomarker of myocardial
health, the cardiac isoform of bridging integrator 1 (cBIN1). cBIN1 is a t-tubule membrane
scaffolding protein in cardiomyocytes, which organizes the cardiac dyad-containing
[9-cBIN1 is transcriptionally decreased in heart tissue from end-stage HF patients as well as animal
models of HF [10, 17]. Furthermore, cardiac origin cBIN1 circulates in blood making it
accessible to assay from a venous blood sample [18]. In a previous cohort of arrhythmogenic
cardiomyopathy patients, reduced plasma levels of BIN1 measured by a generic (not cardiac
specific) test, correlated with HF stage and predicted future arrhythmias [19]. We recently cloned
the cardiac isoform cBIN1 and found that it generates membrane microdomains within t-tubules
[9]. These microdomains are turned over into blood as cBIN1-microparticles and cardiac origin
cBIN1 concentration can be specifically assayed from plasma by ELISA [18]. In this study, we
measured plasma cBIN1 concentration and computed the natural log of the normalized reciprocal
of cBIN1 plasma concentration to create a cBIN1 score (CS), which provides a dimensionless
index of muscle health and rises with worsening muscle failure. We tested the feasibility of CS
as a diagnostic and prognostic marker in a single-center cohort of patients with confirmed
diagnosis of HF on the background of heterogeneous underlying cardiomyopathies with
METHODS
Study Design
The study was approved by the Institutional Review Board (IRB) at Cedars-Sinai
Medical Center (CSMC). Full informed consent was obtained from all subjects prior to
participation in the study. The study involved two human populations including volunteers with
no known history of HF and patients with known HFpEF.
All patients with clinical diagnosis of HFpEF (LVEF ≥ 50% and a history of HF) who
were followed at the Cedars-Sinai Advanced Heart Disease clinic, were eligible for enrollment
regardless of background cardiomyopathy. From July 2014 to November 2015, 52 patients with
stable, chronic HF were enrolled in the study, and blood samples were obtained at the time of
clinic visit. For each patient enrolled, detailed patient chart review was performed to characterize
the HF cohort in terms of demographics, pertinent laboratory values, echocardiographic
parameters and, if available, hemodynamic data per recent cardiac catheterization. NYHA
classification of symptoms was assigned to each HF patient by the treating cardiologist at the
index clinic visit. Additionally, chart review was performed every three months regarding the
occurrence of significant clinical events in one year of follow-up. Outcomes of interest included
any hospitalizations, cardiovascular-related hospitalizations, major adverse cardiac events
(MACE) defined as myocardial infarction, revascularization for stable or unstable coronary or
peripheral vascular symptoms, stroke or transient ischemic attack (TIA), unstable arrhythmias
requiring hospitalization, ICD firing, death, heart transplantation or implantation of a ventricular
assist device (VAD). The echocardiographic parameters obtained in the HF cohort followed the
comparison cohort consisted of 104 age and sex matched volunteers without known cardiac
diagnoses. Plasma from these subjects was obtained from Innovative Research with full
informed consent. These volunteers completed a monitored health questionnaire at the time of
consent regarding height, weight, age, ethnicity, coexisting comorbidities, and current
medications. Each paired questionnaire and blood specimen collected were de-identified by
Innovative Research. Sample processing and storage from the control cohort matched the
protocol below.
Cardiac hospitalization defined as the primary outcome during follow-up
The cohort of 52 HFpEF patients underwent routine follow-up for the next one year at the
Cedars-Sinai Heart Institute Advanced Heart Disease clinic. Cardiac hospitalization was
predefined as any hospitalization after the time of cBIN1 blood draw, where the primary
diagnosis was cardiac in origin. All chart review and adjudication were done by a two-physician
panel who were not involved in the clinical care of the patients (AN and RMS).
Sample Processing and CS Determination
All plasma samples for the HF patients were collected at the time of clinic visit(s) and
subsequently processed and stored in the Cedars-Sinai Medical Center Heart Institute Biobank
per protocol. Whole venous blood was collected into lavender top (EDTA) tubes and stored
immediately at 4ºC for less than four hours. The plasma was separated from cells by spinning
tubes in a refrigerated centrifuge at 2,250 g for 20 minutes. Then, over ice, 0.5 ml aliquots of
with dry ice and ethanol, and stored in a -80ºC freezer. Clinical data were obtained from chart
review and stored in a de-identified Microsoft Access database, indexed by aliquot bar code.
The concentration of cBIN1 was determined using an assay provided by Sarcotein
Diagnostics. In brief, a cBIN1 specific sandwich ELISA test was used, which employs a mouse
monoclonal anti-BIN1 exon 17 as capture antibody (Sigma-Aldrich) and a HRP-conjugated
detection recombinant antibody specific for exon 13 (Sarcotein Diagnostics). 96-well plates were
coated with capture antibody, followed by loading with patient plasma samples. To detect the
full plasma cBIN1 content from plasma microparticles, each plasma sample was subjected to
osmotic shock to break up the microparticles by dilution with distilled water (3 volumes water, 1
volume plasma) before loaded to the ELISA plate [18]. Bound cBIN1 was detected using the
HRP-conjugated anti-BIN1 antibody, with concentration determined from known protein
standards. The ELISA reagents were purchased from BD Biosciences (BD OptEIA reagents kit,
catalog 550534). Using positive control plasma samples with known cBIN1 concentrations, we
validated that this assay is highly precise and reproducible with an inter-plate variability of < 5%.
CS is the natural log of the ratio of the median cBIN1 of controls (10ng/ml) to that of
measured cBIN1:
ln 10 1
We express our findings as CS, a normalized reciprocal, to be consistent with clinical convention
of an elevated biomarker of HF to correlate with worsening cardiac status. Natural log of the
NT-proBNP assay
NT-proBNP values were obtained from the plasma of control and HFpEF patients. The
Cedars-Sinai Medical Center clinical laboratory sends out the plasma samples to Quest
Diagnostics Laboratory to perform the proBNP assay using electrochemiluminescence.
NT-proBNP was chosen over BNP due to its superior stability and higher mean recovery (residual
immunoreactivity) when obtained from stored frozen plasma [21, 22]. Similarly, a natural log
transformation of NT-proBNP was also performed and used for analyses.
Statistical Methods
Data distributions were assessed for normality based on the quantile-quantile plot (QQ
plot) and the Kolmogorov-Smirnov test. Continuous variables with a normal distribution were
expressed and analyzed as means and standard deviations (SD) and compared using a two-sided
Student’s t-test. Continuous variables with non-normal distributions were analyzed with medians
and interquartile ranges (IQR), and compared using the Mann-Whitney U-test. Categorical
variables were compared using the chi-square test. Receiver operating characteristic (ROC)
analysis was performed to determine the sensitivity and specificity of CS and NT-proBNP
concentrations to diagnose HF. Since NT-proBNP has a non-normal distribution,
log-transformations were used to assess the relationship with LV mass. CS and NT-proBNP were
analyzed using Pearson’s correlation analysis. Kaplan-Meier analysis was used to compare the
differences in hospital-free survival rates between patients with high and low levels of CS using
the log-rank test. Statistical analyses were conducted using SAS Version 9.3.1 software (SAS
Institute Inc., Cary, NC) and RStudio Version 1.0.143 (RStudio, Inc., Boston, MA). Two-sided
RESULTS
Study cohorts
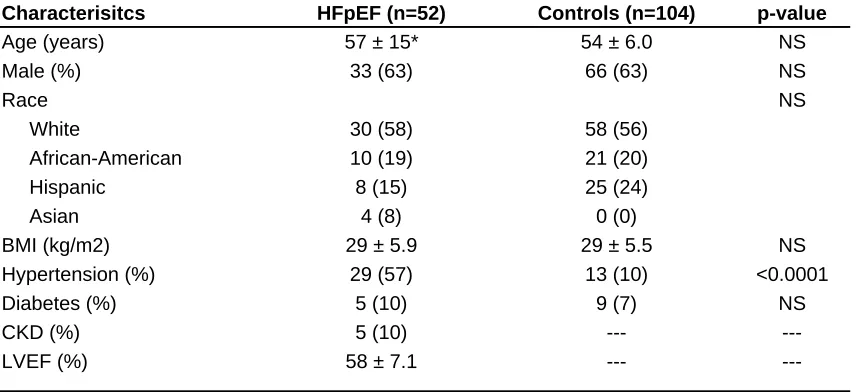
The HFpEF cohort consists of 33 men (63%) with a mean age of 57 ± 15 (mean ± SD)
years and a BMI of 29 ± 5.9 kg/m2 (Table 1). In the HFpEF cohort (Table 2), 75% of the
patients suffer from NYHA Class II or greater degree of symptoms. Notably, 38% of the HF
patients have normal diastolic parameters per echocardiography. The HFpEF patients exhibit
excellent medical optimization of traditional cardiovascular risk factors as shown by
well-controlled blood pressure and heart rate (displayed values are representative of the patient’s
known long term hemodynamic control), LDL cholesterol, hemoglobin A1c as well as
non-smoking status. The most common class of medications used in this group is beta-adrenergic
blocking agents, followed by angiotensin converting enzyme or receptor inhibitors, and diuretics.
Most HFpEF (40/52) patients have normal renal function with mean estimated glomerular
filtration rate (eGFR) of 90 mL/kg/min per the Cockcroft-Gault equation). Additionally, 104
volunteers were recruited for this study and matched for age and sex with the HFpEF subjects
(Table 1).
CS is elevated in HFpEF patients
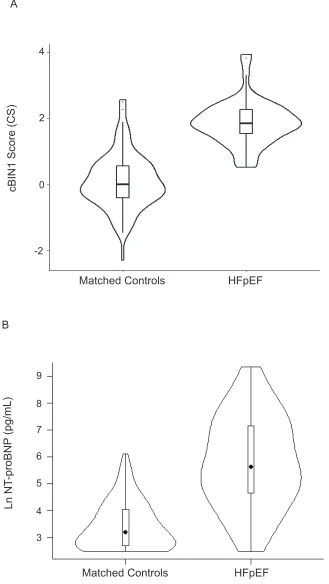
The distribution of CS levels in the controls and HFpEF patients are seen in the violin
plots of Figure 1A, indicating normal distribution of the values in both cohorts, with minimal
overlap between the two groups. In the control cohort, CS has a median of 0.0 (open circle) with
an interquartile range (IQR) of -0.4 to 0.6 (black boxed area). As compared to controls, CS levels
p<0.0001). The mean CS in the HFpEF cohort (1.8 ± 0.7) is more than two standard deviations
higher than the mean CS in the control cohort (0.1 ± 0.8).
In addition to CS, NT-proBNP, a well-established HF marker of hemodynamic load, was
measured at the Cedars-Sinai clinical labs using the same frozen plasma samples for both
cohorts. Natural log of NT-proBNP levels were calculated to aid with the comparison of the data
sets. The distribution of ln NT-proBNP levels in the two studied cohorts is summarized in
Figure 1B. In matched controls, median ln NT-proBNP level is 3.2 (IQR 2.7 - 4.1), which is increased to 5.6 (IQR 4.6 - 7.1) in the HFpEF group (p < 0.0001). Distribution of ln NT-proBNP
levels is positively skewed in both cohorts. An apparent large overlap of plasma NT-proBNP
level distribution between the two cohorts is observed and occurs whether the scale is linear or
logarithmic (Supplemental Figure 1).[23]
CS Diagnoses HF
Since the CS level is higher in HFpEF patients, we proceeded to evaluate the
performance of CS relative to NT-proBNP in identifying patients with HF. Figure 1 juxtaposes
the performance of the two biomarkers - CS (panel A) and ln NT-proBNP (panel B). Both the CS
and NT-proBNP assays discriminate between the control and stable HFpEF cohorts; however
with greater overlap in the two distributions with the NT-proBNP assay. Furthermore, in the 13
HF patients characterized by mild symptoms as determined by NYHA Class I, median CS levels
were already increased to 1.7 which is close to the median of the HFpEF cohort (IQR 1.2 – 2.0).
In contrast, in this subset of early asymptomatic HF patients, NT-proBNP concentrations were
only modestly elevated and in some subjects within age and sex adjusted normal levels, with a
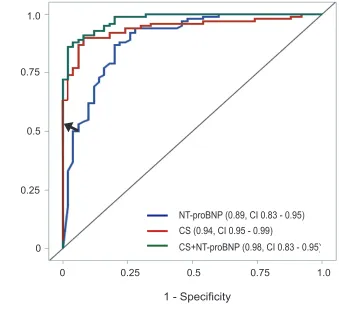
capability of CS to distinguish subjects with HF from those without, ROC curves were
generated. The diagnosis of HF by CS yielded an area under the curve (AUC) of 0.94 (95% CI
0.91 – 0.98) while the AUC for NT-proBNP was 0.89 (95% CI 0.83 – 0.95). Furthermore, an
additive effect was observed when the two tests were combined, which resulted in a significantly
improved AUC of 0.98 (95% CI 0.83 – 0.95) when compared to either CS or NT-proBNP alone
(p = 0.01 and p = 0.003 respectively) (Figure 2). Using a CS value of 1.8 as a diagnostic cutoff,
which is the median value in the HFpEF cohort and is greater than two standard deviations above
the mean value in the control cohort, CS detects HF patients with a positive predictive value
(PPV) of 88% and negative predictive value (NPV) of 81% (arrow in Figure 2).
In HFpEF patients, CS correlates with LV Mass
cBIN1 is a ventricular cardiomyocyte t-tubule membrane scaffolding protein, which
organizes membrane microdomains that regulate calcium transients and its levels are decreased
in failing cardiomyocytes [13, 18]. A known pathophysiological hallmark of HF is the
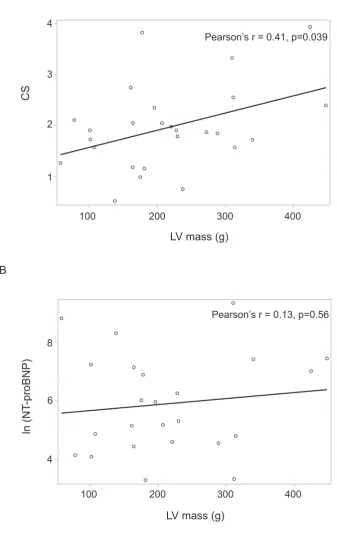
development of LV hypertrophy [15, 24, 25]. We analyze the relationship between CS and LV
mass, as estimated by echocardiographic parameters per the most recent chamber quantification
guidelines by the ASE [20]. In 26 HFpEF patients who had an echocardiogram within three
months of study enrollment, CS levels were determined together with LV mass and LV
geometry. We found concentric LV hypertrophy in the HFpEF cohort (LV mass 220 ± 92 g,
Table 2). CS has a significant positive correlation with increasing LV mass (r = 0.41, p = 0.039) (Figure 3A). In contrast, NT-proBNP does not significantly correlate with LV mass (r = 0.13, p
cBIN1 role in t-tubule remodeling.[9, 13] These results provide confidence that the cBIN1 assay
is not reflective of myocardial mass, but rather serves as an indicator of myocardial health and
remodeling. Of note, CS did not correlate with either eGFR or BMI in the HFpEF (Pearson’s
r=0.0 p=0.99, and r=-0.05 p=0.74, respectively), further supporting the specificity of CS for
myocardial health. For NT-proBNP, there was a strong inverse correlation with eGFR and a
trend towards inverse correlation for BMI (Pearson’s r=-0.67 p<0.001, and r=-0.25 p=0.08).
Elevated CS prognosticates cardiovascular hospitalization in HFpEF patients
Next, we explored whether, in addition to its diagnostic value (Figure 2), CS can serve as
a prognostic marker in predicting future clinical outcomes in patients with HFpEF. Using
Kaplan-Meier curves, we explored whether, within the HFpEF group, patients with elevated CS
values had worse outcomes as defined by cardiovascular events in the subsequent one year
period. The high prevalence of morbidity and mortality among the 52 patients in the HFpEF
cohort is illustrated by the following frequency of events within one year of follow-up: 27
patients had sustained a hospitalization for any event, 26 patients required hospitalization for
cardiovascular related event, 5 patients suffered a MACE, 3 patients had an AICD discharge, 2
patients died from cardiovascular causes, 4 underwent a heart transplantation and 1 underwent
LVAD implantation.
Figure 4A illustrates the outcomes for the HFpEF patients within one year of follow-up as stratified per CS level ≥ 1.8 versus < 1.8. Among patients with CS ≥1.8, 55% underwent at
least one hospitalization related to a cardiovascular event, as compared to 21% of the patients in
the HFpEF group with CS < 1.8 (p = 0.005, log-rank test). Given that cBIN1 and NT-proBNP
we tested whether prognosis is improved when CS is combined with the NT-proBNP test. The
HFpEF cohort was stratified into four subgroups using CS cut-off of 1.8 and NT-proBNP cut-off
of 300 pg/mL (the median levels of these biomarkers in the HFpEF cohort). It is evident that the
sicker patients (those with high CS and high NT-proBNP) have a higher rate of at least one
cardiovascular event (75% of the patients) than the relatively healthier patients who have a low
CS and low NT-proBNP values (6%). Using CS alone, the hazard ratio (HR) for cardiovascular
related hospitalizations of patients within 12 months of follow-up is 4.0 for those patients with
CS ≥ 1.8 compared to those with CS < 1.8 (95% CI 1.41 – 11.22, p = 0.009). If NT-proBNP is
used alone to prognosticate CV hospitalization, HR for NT-proBNP ≥ 300 pg/ml is 5.4 compared
to NT-proBNP < 300 pg/ml (CI 1.75 – 16.69, p = 0.0034). However, using the above cut-off
values, when combining the two biomarkers, CS ≥ 1.8 and NT-proBNP ≥ 300 pg/ml carried a
high HR of 21.4 compared to CS < 1.8 and NT-proBNP < 300 pg/ml (95% CI 2.7 – 171.6, p =
DISCUSSION
Current HF Assessment
HF is a global epidemic for which there is a need for improved diagnostic and therapeutic
approaches [1, 26]. Our current blood based diagnostic armamentarium is extremely limited and
per the 2017 AHA/ACC HF guidelines, only natriuretic peptides carry a class I recommendation
for use in clinical practice [26]. Even for natriuretic peptides, there are published concerns
regarding clinical parameters which affect their sensitivity and specificity. For instance, the
interaction of NT-proBNP in the obese patients is complex and highly important in the current
demographic of HF patients. In the Atherosclerosis Risk in Communities (ARIC) Heart Failure
Community Surveillance Study, of 10,000 patients studied, only 32% of the participants were
normal weight, with the rest being overweight or obese [7]. It is well established from multiple
large cohort studies that NT-proBNP has an inverse correlation with body mass index (BMI).
Furthermore, many patients suffering from obesity have associated comorbidities such as
obstructive sleep apnea, and pulmonary hypertension, which can lead to NT-proBNP elevation,
thus decreasing its specificity for diagnosing HF. In PARADIGM-HF, natriuretic peptide levels
were predictive of the primary outcome (the composite of death from cardiovascular causes or a
first hospitalization for HF) except in the moderately/severely obese group where such an
association was weak [27].
An additional interesting phenomenon has been reported now by post hoc analyses of two
randomized clinical trials focused on HFpEF patients, namely the I-PRERSERVE and TOPCAT
trials [28, 29]. Both analyses have shown a greater treatment benefit in patients with the lowest
NT-proBNP levels. These subgroups of patients do include individuals whose natriuretic peptide
presence of a stage of HFpEF not captured by conventional tests that is still responsive to therapy
with neurohormonal modulating agents. Conversely, there likely exist more advanced stages of
HFpEF characterized by elevated natriuretic peptide levels which might show irreversible
cardiac remodeling not amenable to therapy. We believe this demonstrates the need for a
biomarker to capture these early stages of myocardial pathology that are not well detected by
current diagnostic tests.
In recent years, there has been a surge in the introduction of novel biomarkers of HF [6,
30-36]. The variety of biomarkers is reflective of the diverse pathological domains of this
syndrome such as myocardial fibrosis, increased collagen deposition, activation of alternative
metabolic pathways and upregulation of pro-inflammatory cascades. Soluble ST2 (sST2),
galectin-3 (Gal-3), high sensitivity Troponin T (hs TnT), and growth differentiating factor 15
(GDF-15) all have been explored. Clinical studies in which they have been characterized have
primarily examined their prognostic value in HF. As such, there is a IIB level of evidence for use
of sST2 and Gal-3 as additive risk stratification tools in chronic as well as acute HF.[26] Most
new biomarkers do not originate from cardiomyocytes, and performance characteristics and
specificity can be limited [6, 36]. A biomarker originating from cardiac muscle and correlating
with cardiac health could potentially serve both diagnostic and prognostic roles, as well as
management in stable ambulatory patients.
cBIN1 based CS is a marker of biochemical health of cardiomyocytes
T-tubule remodeling and the resultant abnormal calcium transients are central to the
the membrane microdomains which organize dyadic L-type calcium channel (LTCC) and
ryanodine receptor (RyR) couplons [11, 12]. The integrity of cBIN1-microdomains is critical for
synchronized calcium release and efficient excitation-contraction coupling. In HF, myocardial
cBIN1 is transcriptionally downregulated [17] impairing cardiac contractility and promoting
ventricular arrhythmias [9].
It was recently found that the cBIN1-organized microdomains at the cardiomyocyte
t-tubule membrane are continuously turned over and released externally into blood [18]. The
resultant cardiac origin cBIN1 in plasma can be measured by ELISA and is reduced in patients
with HF [18]. In this study we introduce CS, a measure of failing muscle health, which is based
on the log of the normalized reciprocal of ELISA measured cBIN1 concentration. An important
performance characteristic of CS is its clear separation between individuals with HF and those
without HF (Figure 1). In fact, the mean CS in the HFpEF cohort (1.8) is more than two
standard deviations higher than the mean CS in the control cohort (0.0). Moreover, the ROC
curves (Figure 2) for CS and NT-proBNP demonstrate the additive role of the two tests in the
diagnosis of patients with HFpEF, reflective of their different pathophysiological role in HF. By
enhancing the power of NT-proBNP in detecting HFpEF, a cBIN1-based blood test provides an
additive value to existing diagnostic tests in this diverse and complex patient population.
In addition to the diagnostic value of CS, it is important to note that CS directly correlates
with LV mass in the HFpEF cohort, and high CS levels predict worse clinical outcomes. Reports
from animal models indicate that t-tubules widen in hypertrophied HFpEF hearts [46], similar to
the phenomenon observed in systolic failure models of cBIN1 deficient hearts [9]. LV
remodeling is likely a global organ level response to a cellular loss of t-tubule function. Systolic
patients [47]. With cBIN1 deficiency and the consequent t-tubule abnormality, mammalian
hearts present with diminished cardiac reserve and electrical instability, thus with increased
incidence of both pump failure and ventricular arrhythmias [9]. This link between the cellular
role of cBIN1 and overall cardiac function helps explain the value of CS in predicting
cardiovascular related hospitalizations in HFpEF patients during a one year follow-up period
(Figure 4).
Another notable feature of CS is that it does not correlate with BMI nor, in the HFpEF
cohort, creatinine clearance. These factors have been found to influence NT-proBNP levels and
thus, limit use of natriuretic peptides in patients with obesity or with kidney dysfunction, which
constitute a large portion of the HF demographics. Thus, we believe that NT-proBNP and CS
used together can enhance our diagnostic power in the HF domain by reflecting two different
aspects of HF pathophysiology.
CS is a potential biomarker of early stable HF
The ideal diagnostic tool for HF will capture cellular remodeling prior to the onset of
cardiac symptoms. Early diagnosis is even more challenging for HFpEF, given that a large
proportion of HFpEF patients cannot be captured by the currently validated and available
diagnostic tests, including echocardiographic parameters of diastolic dysfunction and
NT-proBNP. For example, the investigators of the TOPCAT clinical trial characterize their HFpEF
Similarly, in our current cohort, even with a demonstrated high rate of morbidity and mortality (Figure 4), more than half of the study subjects (27 patients) have NT-proBNP value of less than
300 pg/mL (a cut-off used in many clinical trials as an enrollment criterion for HFpEF patients)
and 38% of the patients have normal diastolic function per echocardiography. In fact, all patients
with NYHA Class I and II symptoms have NT-proBNP levels < 300 pg/mL and thus, would not
be captured in many of the contemporary HFpEF clinical trials. In the same cohort, CS is already
markedly increased in these patients with minor HF symptoms as classified by NYHA Class I
and II. Thus, CS potentially could be able to detect early asymptomatic HF. CS has a normal
distribution in the control cohort (Figure 1), suggesting that there are multiple stages of cellular
remodeling occurring in a cohort that is yet to develop HF symptoms. Potential early detection
by CS carries the promise of intervening at still reversible stages of the disease process,
especially when the cardiomyopathy is caused by poorly controlled cardiovascular risk factors,
such as obesity, hypertension or diabetes.
Study Limitations and Future Directions
Our study consists of a heterogeneous cohort of cardiomyopathies selected due to a
documented HF diagnosis and preserved ejection fraction on echocardiography. We compared
CS to a well-validated and established marker, NT-proBNP, in patients who are clinically stable.
We are encouraged by the additive performance of the two tests, indicating different mechanistic
origins: muscle health versus volume status, respectively. Future directions will assess cBIN1 in
patients with reduced ejection fraction, as well as expand the single center study to multicenter
ACKNOWLEDGMENTS
We thank Dr. Eduardo Marbán and Dr. Prediman Krishan Shah for review of this manuscript and
helpful suggestions, Sarcotein Diagnostics for providing the recombinant anti-BIN1 exon 13
antibody required for the cBIN1-ELISA assay. Funding for this research including NIH/NHLBI
HL133286, HL094414, HL138577, American Heart Association grants 16BGIA27770151,
FIGURE LEGENDS
Figure 1. Violin plots of cBIN1 score (CS) and ln NT-proBNP in the study cohorts. Panel A shows the median CS values and IQR in the matched control group (median 0.0, IQR -0.4 – 0.6)
and the HFpEF group (median 1.8, IQR 1.5 – 2.3). The figure shows clear separation between
the two cohorts based on CS values with p < 0.0001 per the Mann-Whitney U-test. Panel B
contains median ln NT-proBNP values and IQR of the matched control (median 3.2 pg/mL, IQR
2.7 – 4.1) and HFpEF patients (median 5.6 pg/mL, IQR 4.6 – 7.1) with p < 0.0001 per the
Mann-Whitney U-test. The Panel B plot demonstrates substantial overlap between the two study
groups.
Figure 2. Receiver operating characteristic (ROC) curves for NT-proBNP, CS, and the two assays combined. The area under the curve (AUC) for NT-proBNP is 0.89 (blue curve, 95% CI 0.83 – 0.95) and for CS is 0.94 (red curve, 95% CI 0.95 – 0.99). The AUC of the combined tests
of NT-proBNP and CS is 0.98 (green curve, 95% CI 0.83 – 0.95), which shows that combining
the two assays results in superior discriminating power between the control and heart failure
cohorts as compared to NT-proBNP and CS alone (p = 0.003 and p = 0.01, respectively). The
arrow indicates a CS cut-off value of 1.8 which confers a positive predictive value (PPV) of 88%
and negative predictive value (NPV) of 81% for the diagnosis of HF in the studied HFpEF
cohort.
Figure 3. CS and NT-proBNP correlation with left ventricular (LV) mass. LV mass was estimated by echocardiography parameters per the cubed method. Panel A indicates that CS
shows that no correlation is demonstrated between NT-proBNP and LV mass (r = 0.13, p = 0.56,
Pearson’s correlation).
Figure 4. Kaplan-Meier curves for cardiovascular (CV) hospitalization free survival. Panel A displays the CV hospitalization free survival for the HFpEF patients using a CS cut-off value
of 1.8, which is the median CS in this cohort (hazard ratio (HR) 3.98, 95% CI 1.41 – 11.22, p =
0.009 for CS ≥ 1.8 versus CS < 1.8). Panel B exhibits the Kaplan-Meier curves for the HFpEF
patients using a combination of the CS and NT-proBNP assays with cut-off values of 1.8 and
300 pg/mL respectively. This panel suggests that prognostication of CV hospitalizations within 1
year of follow-up in the studied cohort can be strengthened by combining the two diagnostic
tests (CS ≥ 1.8 and NT-proBNP ≥ 300 pg/ml was associated with a HR of 21.42 compared to CS
< 1.8 and NT-proBNP < 300 pg/ml, 95% CI 2.68 – 171.60, p = 0.004).
Supplemental Figure 1. Violin plots for NT-proBNP in the HFpEF patients and matched controls. The figure shows the median NT-proBNP level in the control cohort is 25 pg/mL with IQR 15 – 58 pg/mL, with higher levels observed in the HFpEF cohort (median 277 pg/mL, IQR
99 – 1264 pg/mL,). While the levels in the two groups are statistically different with p < 0.0001
per the Mann-Whitney U-test, the plots demonstrate the wide range of distribution of
NT-proBNP values in the HF patients with considerable overlap with values observed in matched
controls.
TABLES
REFERENCES
1. Go, A.S., et al., Heart disease and stroke statistics--2014 update: a report from the American Heart Association. Circulation, 2014. 129(3): p. e28-e292.
2. Florea, V.G., et al., Heart Failure With Improved Ejection Fraction: Clinical
Characteristics, Correlates of Recovery, and Survival: Results From the Valsartan Heart Failure Trial. Circ Heart Fail, 2016. 9(7).
3. Maisel, A.S., et al., Rapid measurement of B-type natriuretic peptide in the emergency diagnosis of heart failure. N Engl J Med, 2002. 347(3): p. 161-7.
4. Anjan, V.Y., et al., Prevalence, clinical phenotype, and outcomes associated with normal B-type natriuretic peptide levels in heart failure with preserved ejection fraction. Am J Cardiol, 2012. 110(6): p. 870-6.
5. Meijers, W.C., et al., Patients with heart failure with preserved ejection fraction and low levels of natriuretic peptides. Neth Heart J, 2016. 24(4): p. 287-95.
6. Ibrahim, N.E., et al., Established and Emerging Roles of Biomarkers in Heart Failure Clinical Trials. Circ Heart Fail, 2016. 9(9).
7. Khalid, U., et al., BNP and obesity in acute decompensated heart failure with preserved vs. reduced ejection fraction: The Atherosclerosis Risk in Communities Surveillance Study. Int J Cardiol, 2017. 233: p. 61-66.
8. Kitzman, D.W. and S.J. Shah, The HFpEF Obesity Phenotype: The Elephant in the Room. J Am Coll Cardiol, 2016. 68(2): p. 200-3.
9. Hong, T., et al., Cardiac BIN1 folds T-tubule membrane, controlling ion flux and limiting arrhythmia. Nat Med, 2014. 20(6): p. 624-32.
10. Hong, T.T., et al., BIN1 is reduced and Cav1.2 trafficking is impaired in human failing cardiomyocytes. Heart Rhythm, 2012. 9(5): p. 812-20.
11. Hong, T.T., et al., BIN1 localizes the L-type calcium channel to cardiac T-tubules. PLoS Biol, 2010. 8(2): p. e1000312.
12. Fu, Y., et al., Isoproterenol Promotes Rapid Ryanodine Receptor Movement to Bridging Integrator 1 (BIN1)-Organized Dyads. Circulation, 2016. 133(4): p. 388-97.
13. Hong, T. and R.M. Shaw, Cardiac T-Tubule Microanatomy and Function. Physiol Rev, 2017. 97(1): p. 227-252.
14. Reynolds, J.O., et al., Junctophilin-2 gene therapy rescues heart failure by normalizing RyR2-mediated Ca2+ release. Int J Cardiol, 2016. 225: p. 371-380.
15. Loffredo, F.S., et al., Heart failure with preserved ejection fraction: molecular pathways of the aging myocardium. Circ Res, 2014. 115(1): p. 97-107.
16. Gomez, A.M., et al., Defective excitation-contraction coupling in experimental cardiac hypertrophy and heart failure. Science, 1997. 276(5313): p. 800-6.
17. Caldwell, J.L., et al., Dependence of cardiac transverse tubules on the BAR domain protein amphiphysin II (BIN-1). Circ Res, 2014. 115(12): p. 986-96.
18. Xu, B., et al., The ESCRT-III pathway facilitates cardiomyocyte release of cBIN1-containing microparticles. PLoS Biol, 2017. 15(8): p. e2002354.
20. Lang, R.M., et al., Recommendations for chamber quantification: a report from the American Society of Echocardiography's Guidelines and Standards Committee and the Chamber Quantification Writing Group, developed in conjunction with the European Association of Echocardiography, a branch of the European Society of Cardiology. J Am Soc Echocardiogr, 2005. 18(12): p. 1440-63.
21. Mueller, T., et al., Long-term stability of endogenous B-type natriuretic peptide (BNP) and amino terminal proBNP (NT-proBNP) in frozen plasma samples. Clin Chem Lab Med, 2004. 42(8): p. 942-4.
22. Nowatzke, W.L. and T.G. Cole, Stability of N-terminal pro-brain natriuretic peptide after storage frozen for one year and after multiple freeze-thaw cycles. Clin Chem, 2003. 49(9): p. 1560-2.
23. Solomon, S., et al., Angiotensin Receptor Neprilysin Inhibition in Heart Failure With Preserved Ejection Fraction. JACC Heart Fail, 2017. 5(7): p. 471-482.
24. Burchfield, J.S., M. Xie, and J.A. Hill, Pathological ventricular remodeling: mechanisms: part 1 of 2. Circulation, 2013. 128(4): p. 388-400.
25. King, M.K., et al., Selective matrix metalloproteinase inhibition with developing heart failure: effects on left ventricular function and structure. Circ Res, 2003. 92(2): p. 177-85.
26. Yancy, C.W., et al., 2017 ACC/AHA/HFSA Focused Update of the 2013 ACCF/AHA Guideline for the Management of Heart Failure: A Report of the American College of Cardiology/American Heart Association Task Force on Clinical Practice Guidelines and the Heart Failure Society of America. Circulation, 2017.
27. Nadruz, W., et al., Impact of Body Mass Index on the Accuracy of N-Terminal Pro-Brain Natriuretic Peptide and Brain Natriuretic Peptide for Predicting Outcomes in Patients With Chronic Heart Failure and Reduced Ejection Fraction
Insights From the PARADIGM-HF Study (Prospective Comparison of ARNI With ACEI to Determine Impact on Global Mortality and Morbidity in Heart Failure Trial). Circulation, 2016. 134(22): p. 1785-1787.
28. Anand, I.S., et al., Prognostic value of baseline plasma amino-terminal pro-brain natriuretic peptide and its interactions with irbesartan treatment effects in patients with heart failure and preserved ejection fraction: findings from the I-PRESERVE trial. Circ Heart Fail, 2011. 4(5): p. 569-77.
29. Anand, I., et al., Interaction Between Spironolactone and Natriuretic Peptides in Patients With Heart Failure and Preserved Ejection Fraction. JACC: Heart Failure, 2017. 5(4): p. 241-252.
30. Zile, M.R., et al., Prevalence and significance of alterations in cardiac structure and function in patients with heart failure and a preserved ejection fraction. Circulation, 2011. 124(23): p. 2491-501.
31. Motiwala, S.R., et al., Measurement of novel biomarkers to predict chronic heart failure outcomes and left ventricular remodeling. J Cardiovasc Transl Res, 2014. 7(2): p. 250-61.
32. Gaggin, H.K., et al., Head-to-head comparison of serial soluble ST2, growth
34. de Boer, R.A., et al., Galectin-3 in heart failure with preserved ejection fraction. Eur J Heart Fail, 2013. 15(10): p. 1095-101.
35. Zile, M.R., et al., Plasma Biomarkers Reflecting Profibrotic Processes in Heart Failure With a Preserved Ejection Fraction: Data From the Prospective Comparison of ARNI With ARB on Management of Heart Failure With Preserved Ejection Fraction Study. Circ Heart Fail, 2016. 9(1).
36. AbouEzzeddine, O.F., et al., Galectin-3 in heart failure with preserved ejection fraction. A RELAX trial substudy (Phosphodiesterase-5 Inhibition to Improve Clinical Status and Exercise Capacity in Diastolic Heart Failure). JACC Heart Fail, 2015. 3(3): p. 245-52. 37. Seidel, T., et al., Sheet-Like Remodeling of the Transverse Tubular System in Human
Heart Failure Impairs Excitation-Contraction Coupling and Functional Recovery by Mechanical Unloading. Circulation, 2017. 135(17): p. 1632-1645.
38. Sanchez-Alonso, J.L., et al., Microdomain-Specific Modulation of L-Type Calcium Channels Leads to Triggered Ventricular Arrhythmia in Heart Failure. Circ Res, 2016. 119(8): p. 944-55.
39. Frisk, M., et al., Elevated ventricular wall stress disrupts cardiomyocyte t-tubule structure and calcium homeostasis. Cardiovasc Res, 2016. 112(1): p. 443-51. 40. He, J., et al., Reduction in density of transverse tubules and L-type Ca(2+) channels in
canine tachycardia-induced heart failure. Cardiovasc Res, 2001. 49(2): p. 298-307. 41. Cho, G.W., F. Altamirano, and J.A. Hill, Chronic heart failure: Ca(2+), catabolism, and
catastrophic cell death. Biochim Biophys Acta, 2016. 1862(4): p. 763-77.
42. Marks, A.R., Calcium cycling proteins and heart failure: mechanisms and therapeutics. J Clin Invest, 2013. 123(1): p. 46-52.
43. Bito, V., et al., Crosstalk between L-type Ca2+ channels and the sarcoplasmic reticulum: alterations during cardiac remodelling. Cardiovasc Res, 2008. 77(2): p. 315-24.
44. Louch, W.E., et al., T-tubule disorganization and reduced synchrony of Ca2+ release in murine cardiomyocytes following myocardial infarction. J Physiol, 2006. 574(Pt 2): p. 519-33.
45. Fugier, C., et al., Misregulated alternative splicing of BIN1 is associated with T tubule alterations and muscle weakness in myotonic dystrophy. Nat Med, 2011. 17(6): p. 720-5.
46. Oliveira Junior, S.A., et al., Diet-induced obesity causes metabolic, endocrine and cardiac alterations in spontaneously hypertensive rats. Med Sci Monit, 2010. 16(12): p. BR367-73.
47. Norman, H.S., et al., Decreased cardiac functional reserve in heart failure with preserved systolic function. J Card Fail, 2011. 17(4): p. 301-8.
48. Shah, A.M., et al., Cardiac structure and function in heart failure with preserved
Characterisitcs HFpEF (n=52) Controls (n=104) p-value
Age (years) 57 ± 15* 54 ± 6.0 NS
Male (%) 33 (63) 66 (63) NS
Race NS
White 30 (58) 58 (56)
African-American 10 (19) 21 (20)
Hispanic 8 (15) 25 (24)
Asian 4 (8) 0 (0)
BMI (kg/m2) 29 ± 5.9 29 ± 5.5 NS
Hypertension (%) 29 (57) 13 (10) <0.0001
Diabetes (%) 5 (10) 9 (7) NS
CKD (%) 5 (10) ---
---LVEF (%) 58 ± 7.1 ---
cBIN1 Score (CS) 52 (100) 1.8 (1.5 - 2.3)* NT-proBNP (pg/mL) 50 (96) 277 (99 - 1264)* BNP (pg/mL) 45 (87) 184 ± 256 History of Smoking 9 (17)
NYHA Class
I 13 (25)
II 19 (37)
III 17 (33)
IV 2 (4)
Cardiomyopathy Type
Infiltrative (sarcoid, amyloid) 5 (10)
HOCM 5 (10)
Familial restrictive 3 (6)
Valvular 6 (12)
Other 33 (63)
History of PAD/MI/PCI 13 (29) History of arrhythmias 29 (60) Presence of defibrillator 15 (31) Echocardiography parameters
LVEF (%) 52 (100) 58 ± 7
LVIDd (mm) 48 (92) 48 ± 8.5
LV Mass (g) 48 (92) 220 ± 92
Diastolic Class
Normal 15 (38)
Class I 11 (28)
Class II 5 (13)
Class III 8 (21)
PASP (mmHg)
< 30 20 (38)
≥ 30 18 (35)
Laboratory Results
Serum K (mEg/L) 47 (90) 4.4 ± 0.4
eGFR (mL/min) 52 (100) 90 ± 35
LDL (mg/dL) 36 (69) 100 ± 38
Hemoglobin A1c (%) 30 (58) 6 ± 0.9
Hemoglobin (g/dL) 41 (79) 13.4 ± 1.9 Hemodynamic parameters
Systolic BP (mmHg) 46 (69) 117 ± 16 Diastolic BP (mmHg) 46 (69) 69 ± 10
Heartrate (bpm) 45 (68) 68 ± 11
Medication Therapy
ACEI/ARB 43 (89)
Diuretics 33 (70)
Aldosterone antagonists 33 (69)
Nitrates 20 (45)
Statin 10 (23)
Anticoagulants 17 (36)
Antiplatelet agents 34 (72)
Matched Controls HFpEF
4
2
0
-2 cBIN1 Score (CS)
Ln NT
-proBNP
(pg/mL)
B
0 0.25 0.5 0.75 1.0 1.0
0.75
0.5
0.25
0
NT-proBNP (0.89, CI 0.83 - 0.95) CS (0.94, CI 0.95 - 0.99)
CS+NT-proBNP (0.98, CI 0.83 - 0.95)
Sensitivity
B
100 1 2 3 4
100 200 300 400
CS
LV mass (g)
Pearson’s r = 0.41, p=0.039
100 200 300 400
LV mass (g) 4
6 8
ln (NT
-proBNP)
0.75
0.5
0.25
0
0 2 4 6 8 10 12
CV Hospitalization Free Survival
Months
CS < 1.8
CS ≥ 1.8
p=0.005, Log-Rank Test
Group No. at risk
24 23 23 23 20 19 19 22 21 18 14 13 10 10
1.0
0.75
0.5
0.25
0
0 2 4 6 8 10 12 CV Hospitalization Free Survival
Months Group No. at risk
16 16 16 16 15 15 15
9 9 8 8 8 7 7
CS<1.8, NT-proBNP<300
CS≥1.8, NT-proBNP<300
CS<1.8, NT-proBNP≥300 CS≥1.8, NT-proBNP≥300
p<0.0001, Log-Rank test
NT
-proBNP
(pg/ml)
Matched Controls HFpEF
1200