FORMULATION AND EVALUATION OF DICLOFENAC SODIUM SUSTAINED RELEASE TABLETS USING MELT GRANULATION TECHNIQUE
5
0
0
Full text
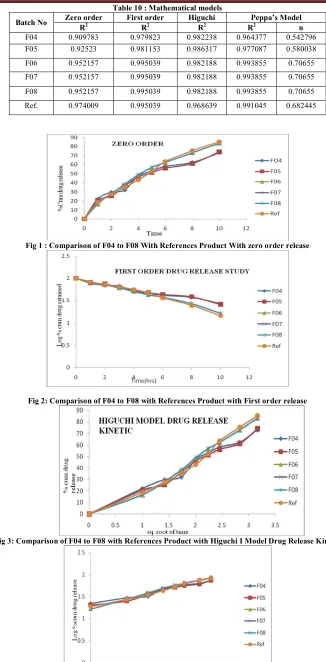
(2) Asija Rajesh et al. IRJP 2012, 3 (5) percentage listed in Table 8 and no tablets differ in weight by more than double that percentage. Weight variation allowed as USPXX- NF XV Percentage difference allowed Average weight of tablet (mg) 10 <130 130-324. 7.5. >324. 5. Tablet thickness Variation in the tablet thickness may cause problems in counting and packaging in addition to weight variation beyond the permissible limits. Tablet thickness should be controlled within a ± 5% of a standard value. Tablet thickness was measured by Vernier caliper 3. Content uniformity Five tablets were selected randomly and powdered. A quantity of this powder corresponding to 10 mg of Diclofenac sodium was dissolved in 50 ml of 7.2 phosphate buffer stirred for 60 min and filtered. 1 ml of the filtrate was diluted to 50 ml with 7.2 phosphate buffer. Absorbance of this solution was measured at 228 nm using7.2 phosphate buffer as blank and content of Diclofenac sodium was estimated. In vitro drug release/dissolution studies The tablet samples were subjected to in-vitro dissolution studies using USP Type II dissolution apparatus at 37±2°C and 50 rpm speed. As per the official recommendation of USFDA, 900 ml of 7.4 Phosphate Buffer was used as dissolution medium. Aliquot equal to 10 ml was withdrawn at specific time intervals and, The dissolution media volume was complimented with fresh and equal volume of 7.4 Phosphate Buffer. The aliquots were filtered and scanned with appropriate dilution and amount of Diclofenac sodium released from the tablet samples was determined spectrophotometrically at a wavelength of 276 nm by comparing with the standard calibration curve. RESULT AND DISCUSSION In present work the release data of F01, F02 and F03 are not under U.S.P Limit for dissolution of Sustained Release Tab. In the present work, the formulations F04 to F08 In- vitro release studies were carried out for all the formulations as per USP type II tablet dissolution tester employing rotating paddle at 100 rpm using 900 ml of phosphate buffer of pH 7.4 as dissolution medium. The results were evaluated for 10 hr. As per the results of dissolution study formulations F04, F05, F06, F07, and F08 showed 73.4, 74.2, 83.4, 83.4, and 83.4 % respectively. From the above trial batches F01, F02, and F03 were released more compared to reference drug release. Where F05 and F06 batches were released less. compared to reference drug release. F07 and F08 batches drug released were nearest to the reference drug release. Above released data of F007 batch was match with reference so we can judge the optimized batch as F007. The coefficient of determination (R2) was considered as main parameter for interpreting the release kinetics. R2 values for the zero order kinetics (0.909-0.952), first order kinetics (0.973-0.995) and higuchi’s kinetics (0.982-0.986). In order to predict the release mechanism, the data was subjected to Korsmayer-peppas treatment. The release exponent values were determined as shown in Table. F04, F05, F06, F07, and F08 formulations followed first order kinetic All batches followed Higuchi’s plot since the regression coefficient (R2) is found to be linear, this confirms that the drug release through the matrix was diffusion. Slope (n) value of F004, F04 and F05 formulations were between 0.5 to 1.0 so followed non- Fickian diffusion mechanism. Any formulation does not have (n) value greater than 1.0 so that case-II transport mechanism is not followed. REFERENCES 1) Brannon PL. Medical Plastics & Biomater. 1998; 199(6): 34-46. 2) Brahmannkar DM, Jaiswal SB. Biopharmaceutics and Pharmacokinetic. 1985; 335-346, page no 17. 3) Leon Lachman et.al; The Theory and Practice of Industrial Pharmacy, 3rd edition page no 293. 4) Vyas SP, Khar RK. Controlled drug delivery. Concepts and advances. 1st Ed. Vallabh prakashan. Delhi; 2002: 1-150, 167. 5) Li. Xiaoling. Design of controlled release drug delivery system. J.R. Bhaskara 120-121. 6) Robinson JR, Lee LH. Controlled Drug Delivery. Fundamentals and Applications. 2nd edition. 1987; 29: 312-319. 7) Lachman L, Lieberman HA, Kanig JL. The theory and practice of industrial pharmacy, Varghese Publishing House Bombay; 1987: 293345, 430. 8) Li LC, Peck GE. Water Based Silicone Elastomer Controlled Release Tablet Film Coating III - Drug Release Mechanisms. Drug Development and Industrial Pharmacy. 1989; 15 (12): 1943-1968. 9) Benita S, Donbrow M, Dissolution Rate Control of the Release Kinetics of Water-Soluble Compounds from Ethyl Cellulose Film-Type Microcapsule. International Journal of Pharmaceutics. 1982; 12: 251264. 10) Yie W, Chien, Rate controlled drug delivery systems, 2nd Ed, Marcel Dekker. New York. Revised and expanded 2005. 11) Vyas SP, Khar RK. Controlled drug delivery: concepts and advances, 1st ed. Delhi: Vallabh prakashan; 2002,pp.267-347. 12) Swati Jagade,Swapnil G horpade, Dhaval bhavsar, Bhanudas Kuchekar and Aniruddha Chabukswar, J. Chem.Pharm.Res., 2010, 2(2),330-338 13) Rowe RC, Sheskey PJ, Handbook of pharmaceutical excipients, 6th ed, 2006 . 14) Hydroxypropyl cellulose: klucel product data, [cited 2011 Apr 12]. Available from URL: www.signetchem.com 15) Lactose monohydrate, [cited 2011 Apr 12]. Available from URL: http://www.chemblink.com. 16) Monograph of magnesium Stearate, [cited 2011 Apr 12]. Available from URL: http://www.lohmann-chemikalien.de.. Page 217.
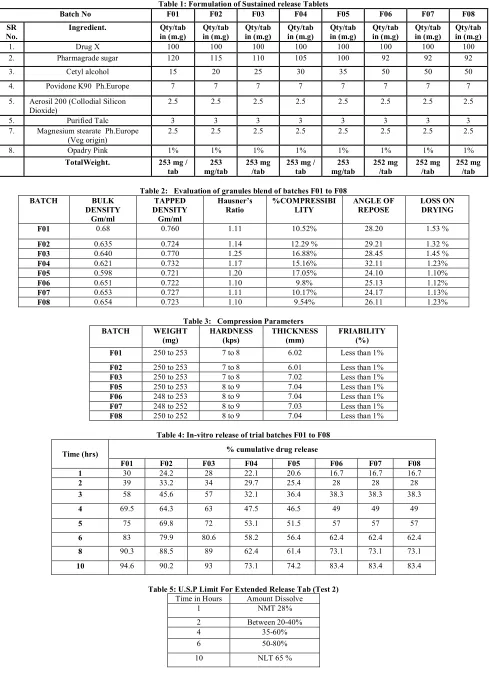
(3) Asija Rajesh et al. IRJP 2012, 3 (5) Table 1: Formulation of Sustained release Tablets F01 F02 F03 F04. Batch No. F05. F06. F07. F08. Drug X Pharmagrade sugar. Qty/tab in (m.g) 100 120. Qty/tab in (m.g) 100 115. Qty/tab in (m.g) 100 110. Qty/tab in (m.g) 100 105. Qty/tab in (m.g) 100 100. Qty/tab in (m.g) 100 92. Qty/tab in (m.g) 100 92. Qty/tab in (m.g) 100 92. 3.. Cetyl alcohol. 15. 20. 25. 30. 35. 50. 50. 50. 4.. Povidone K90 Ph.Europe. 7. 7. 7. 7. 7. 7. 7. 7. 2.5. 2.5. 2.5. 2.5. 2.5. 2.5. 2.5. 2.5. 3 2.5. 3 2.5. 3 2.5. 3 2.5. 3 2.5. 3 2.5. 3 2.5. 3 2.5. SR No. 1. 2.. 5. 5. 7. 8.. Ingredient.. Aerosil 200 (Collodial Silicon Dioxide) Purified Talc Magnesium stearate Ph.Europe (Veg origin) Opadry Pink TotalWeight.. F01. BULK DENSITY Gm/ml 0.68. F02 F03 F04 F05 F06 F07 F08. 0.635 0.640 0.621 0.598 0.651 0.653 0.654. BATCH. 1%. 1%. 1%. 1%. 1%. 1%. 1%. 1%. 253 mg / tab. 253 mg/tab. 253 mg /tab. 253 mg / tab. 253 mg/tab. 252 mg /tab. 252 mg /tab. 252 mg /tab. Table 2: Evaluation of granules blend of batches F01 to F08 TAPPED Hausner’s %COMPRESSIBI ANGLE OF DENSITY Ratio LITY REPOSE Gm/ml 0.760 1.11 10.52% 28.20 0.724 0.770 0.732 0.721 0.722 0.727 0.723. 1.14 1.25 1.17 1.20 1.10 1.11 1.10. 12.29 % 16.88% 15.16% 17.05% 9.8% 10.17% 9.54%. 1.53 %. 29.21 28.45 32.11 24.10 25.13 24.17 26.11. Table 3: Compression Parameters WEIGHT HARDNESS THICKNESS (mg) (kps) (mm). FRIABILITY (%). F01. 250 to 253. 7 to 8. 6.02. Less than 1%. F02 F03 F05 F06 F07 F08. 250 to 253 250 to 253 250 to 253 248 to 253 248 to 252 250 to 252. 7 to 8 7 to 8 8 to 9 8 to 9 8 to 9 8 to 9. 6.01 7.02 7.04 7.04 7.03 7.04. Less than 1% Less than 1% Less than 1% Less than 1% Less than 1% Less than 1%. BATCH. LOSS ON DRYING. 1.32 % 1.45 % 1.23% 1.10% 1.12% 1.13% 1.23%. Table 4: In-vitro release of trial batches F01 to F08 % cumulative drug release. Time (hrs) 1 2 3. F01 30 39 58. F02 24.2 33.2 45.6. F03 28 34 57. F04 22.1 29.7 32.1. F05 20.6 25.4 36.4. F06 16.7 28 38.3. F07 16.7 28 38.3. F08 16.7 28 38.3. 4. 69.5. 64.3. 63. 47.5. 46.5. 49. 49. 49. 5. 75. 69.8. 72. 53.1. 51.5. 57. 57. 57. 6. 83. 79.9. 80.6. 58.2. 56.4. 62.4. 62.4. 62.4. 8. 90.3. 88.5. 89. 62.4. 61.4. 73.1. 73.1. 73.1. 10. 94.6. 90.2. 93. 73.1. 74.2. 83.4. 83.4. 83.4. Table 5: U.S.P Limit For Extended Release Tab (Test 2) Time in Hours Amount Dissolve 1 NMT 28% 2 4 6. Between 20-40% 35-60% 50-80%. 10. NLT 65 %. Page 218.
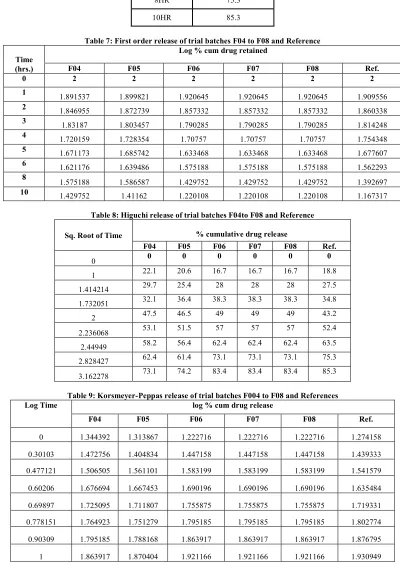
(4) Asija Rajesh et al. IRJP 2012, 3 (5) Table 6: Drug release profile of Reference Tablet Time(hrs). % Drug Release. 1 HR. 18.8. 2HR. 27.5. 3HR. 34.8. 4HR. 43.2. 5HR. 52.4. 8HR. 75.3. 10HR. 85.3. Table 7: First order release of trial batches F04 to F08 and Reference Log % cum drug retained Time (hrs.) 0 1 2 3 4 5 6 8 10. F04 2. F05 2. F06 2. F07 2. F08 2. Ref. 2. 1.891537. 1.899821. 1.920645. 1.920645. 1.920645. 1.909556. 1.846955. 1.872739. 1.857332. 1.857332. 1.857332. 1.860338. 1.83187. 1.803457. 1.790285. 1.790285. 1.790285. 1.814248. 1.720159. 1.728354. 1.70757. 1.70757. 1.70757. 1.754348. 1.671173. 1.685742. 1.633468. 1.633468. 1.633468. 1.677607. 1.621176. 1.639486. 1.575188. 1.575188. 1.575188. 1.562293. 1.575188. 1.586587. 1.429752. 1.429752. 1.429752. 1.392697. 1.429752. 1.41162. 1.220108. 1.220108. 1.220108. 1.167317. Table 8: Higuchi release of trial batches F04to F08 and Reference % cumulative drug release. Sq. Root of Time 0 1 1.414214 1.732051 2 2.236068 2.44949 2.828427 3.162278. Log Time. F04 0. F05 0. F06 0. F07 0. F08 0. Ref. 0. 22.1. 20.6. 16.7. 16.7. 16.7. 18.8. 29.7. 25.4. 28. 28. 28. 27.5. 32.1. 36.4. 38.3. 38.3. 38.3. 34.8. 47.5. 46.5. 49. 49. 49. 43.2. 53.1. 51.5. 57. 57. 57. 52.4. 58.2. 56.4. 62.4. 62.4. 62.4. 63.5. 62.4. 61.4. 73.1. 73.1. 73.1. 75.3. 73.1. 74.2. 83.4. 83.4. 83.4. 85.3. Table 9: Korsmeyer-Peppas release of trial batches F004 to F08 and References log % cum drug release F04. F05. F06. F07. F08. Ref.. 0. 1.344392. 1.313867. 1.222716. 1.222716. 1.222716. 1.274158. 0.30103. 1.472756. 1.404834. 1.447158. 1.447158. 1.447158. 1.439333. 0.477121. 1.506505. 1.561101. 1.583199. 1.583199. 1.583199. 1.541579. 0.60206. 1.676694. 1.667453. 1.690196. 1.690196. 1.690196. 1.635484. 0.69897. 1.725095. 1.711807. 1.755875. 1.755875. 1.755875. 1.719331. 0.778151. 1.764923. 1.751279. 1.795185. 1.795185. 1.795185. 1.802774. 0.90309. 1.795185. 1.788168. 1.863917. 1.863917. 1.863917. 1.876795. 1. 1.863917. 1.870404. 1.921166. 1.921166. 1.921166. 1.930949. Page 219.
(5) Asija Rajesh et al. IRJP 2012, 3 (5) Table 10 : Mathematical models First order Higuchi R2 R2 0.979823 0.982238 0.981153 0.986317. F04 F05. Zero order R2 0.909783 0.92523. F06. 0.952157. 0.995039. 0.982188. 0.993855. 0.70655. F07. 0.952157. 0.995039. 0.982188. 0.993855. 0.70655. F08. 0.952157. 0.995039. 0.982188. 0.993855. 0.70655. Ref.. 0.974009. 0.995039. 0.968639. 0.991045. 0.682445. Batch No. Peppa’s Model R2 n 0.964377 0.542796 0.977087 0.580038. Fig 1 : Comparison of F04 to F08 With References Product With zero order release. Fig 2: Comparison of F04 to F08 with References Product with First order release. Fig 3: Comparison of F04 to F08 with References Product with Higuchi I Model Drug Release Kinetic. Fig 4: Comparison of F04 to F08 with References Product with Krosmeyer -Pepaas Drug Release Kinetics. Source of support: Nil, Conflict of interest: None Declared. Page 220.
(6)
Figure
Related documents
Methods: Using one years ’ data from the US Federal Drug Administrations Adverse Event Reporting System, we identified MedDRA preferred terms that collectively accounted for 95% of
It then discusses the impact of these reforms on the corporate sector under five main heads: corporate governance, risk management, capital structure, group structure and
Interestingly, when the cells were treated with a mixture of both the miRNAs, a marked increase (~2 fold) in total apoptotic cell population was observed, whereas the early
A high number incidental findings detected on CTAC images are classified as clinically significant or indeterminate at the time of the radiological report but, despite this, very
The formation of nominal derivatives in the arabic language
with a view to computational linguistics
There is no compatibility between the semantic features of Verbs of bending and those of the qualificative adjective , where the features (situation entity) of the verbs
The extension of the analysis to 2D highlights the exis- tence of a correlation in the degree of localization in the initial and asymptotic evolution regions of finite energy
