https://doi.org/10.5194/nhess-19-2541-2019 © Author(s) 2019. This work is distributed under the Creative Commons Attribution 4.0 License.
Machine learning analysis of lifeguard flag
decisions and recorded rescues
Chris Houser, Jacob Lehner, Nathan Cherry, and Phil Wernette
Faculty of Science, University of Windsor, 401 Sunset Avenue, Windsor, Ontario, N9C 2J9, Canada Correspondence:Chris Houser ([email protected])
Received: 27 April 2019 – Discussion started: 18 June 2019
Revised: 18 September 2019 – Accepted: 15 October 2019 – Published: 19 November 2019
Abstract.Rip currents and other surf hazards are an emerg-ing public health issue globally. Lifeguards, warnemerg-ing flags, and signs are important, and to varying degrees they are effective strategies to minimize risk to beach users. In the United States and other jurisdictions around the world, life-guards use coloured flags (green, yellow, and red) to indicate whether the danger posed by the surf and rip hazard is low, moderate, or high respectively. The choice of flag depends on the lifeguard(s) monitoring the changing surf conditions along the beach and over the course of the day using both re-gional surf forecasts and careful observation. There is a po-tential that the chosen flag is not consistent with the beach user perception of the risk, which may increase the potential for rescues or drownings. In this study, machine learning is used to determine the potential for error in the flags used at Pensacola Beach and the impact of that error on the number of rescues. Results of a decision tree analysis indicate that the colour flag chosen by the lifeguards was different from what the model predicted for 35 % of days between 2004 and 2008 (n=396/1125). Days when there is a difference between the predicted and posted flag colour represent only 17 % of all rescue days, but those days are associated with ∼60 % of all rescues between 2004 and 2008. Further anal-ysis reveals that the largest number of rescue days and total number of rescues are associated with days where the flag deployed over-estimated the surf and hazard risk, such as a red or yellow flag flying when the model predicted a green flag would be more appropriate based on the wind and wave forcing alone. While it is possible that the lifeguards were overly cautious, it is argued that they most likely identified a rip forced by a transverse-bar and rip morphology common at the study site. Regardless, the results suggest that beach users may be discounting lifeguard warnings if the flag colour is
not consistent with how they perceive the surf hazard or the regional forecast. Results suggest that machine learning tech-niques have the potential to support lifeguards and thereby reduce the number of rescues and drownings.
1 Introduction
and the UK) or areas and times to avoid entering the wa-ter (e.g. Costa Rica and the US). Unfortunately, not every country uses the same flagging convention, and there are re-gional variations that can lead to confusion amongst beach users. The United States and Canada use green, yellow, and red coloured flags to indicate whether the danger posed by the surf and rip hazard is low, moderate, or high, respec-tively (Houser et al., 2017). A beach manager or lifeguard decides on the surf hazard and the flag colour to fly based on a combination of daily updates on rip conditions provided by local lifeguards as well as a rip forecast from the US Na-tional Weather Service (NWS). Most rip forecasts are based on a simple correlation between the number of rip-related rescues and meteorological and oceanographic conditions on that day (Lushine, 1991a, b; Lascody, 1998; Engle et al., 2012; Dusek and Seim, 2013; Kumar and Prasad, 2014; Scott et al., 2014; Moulton et al., 2017). These forecasts do not ac-count for the surf zone morphology, which may be conducive to the development of rips on days when wave breaking is relatively weak. Even under green flag days, the presence of shore-attached nearshore bars (called a transverse-bar and rip morphology; Wright and Short, 1984) can force a current of ∼0.5 m s−1that can pose a threat to weak swimmers (Houser et al., 2013).
Rip currents can still be present even if a regional fore-cast predicts that the hazard potential is low based on wind and wave conditions. Beach users can be at risk if the flag colour is based solely on the regional forecast. To be effec-tive, the flag system requires lifeguards to continuously as-sess surf conditions and monitor swimmers and bathers, and ultimately intervene if someone does not heed the warning implied by a yellow or red flag indicating moderate and high (“do not enter the water”) hazard levels respectively. Recent evidence suggests that many beach users do not adhere to warnings if their own experience (whether accurate or not) or behaviour of others on the beach contradicts the hazard, as indicated by the warning flag (Houser et al., 2017; Ménard et al., 2018). Beachgoers may lose trust in authority (i.e. the lifeguards) if a forecast is perceived, wrongly or rightly, to be inaccurate (Espluga et al., 2009). If the forecast is for dan-gerous surf conditions and a yellow or red flag is placed on the beach when conditions appear to the beach user to be relatively calm, the beach user may discount or ignore the forecast now and in the future if they enter the water and do
ing, as well as the daily number of rescues performed by life-guards. A decision tree, a form of machine learning, is used to predict the posted flag colour using lifeguard observations in combination with wind and wave forcing. The modelled flag colour, based solely on wave and wind forcing, can be compared to the flag colour posted by the lifeguards on a particular day to identify days when there is a difference and how that influences the number of rescues performed on that day. It is hypothesized that there will be a greater number of rescues performed on days when there is a difference be-tween the predicted and posted flag colour. Specifically, it is hypothesized that a greater number of rescues will occur on days when the model underestimated the hazard level com-pared to the lifeguard who made their decision based on lo-cal observations including the presence of semi-permanent rip channels. In this scenario, the public may believe that the lifeguard is being overly cautious, leading to people entering the water.
2 Study site
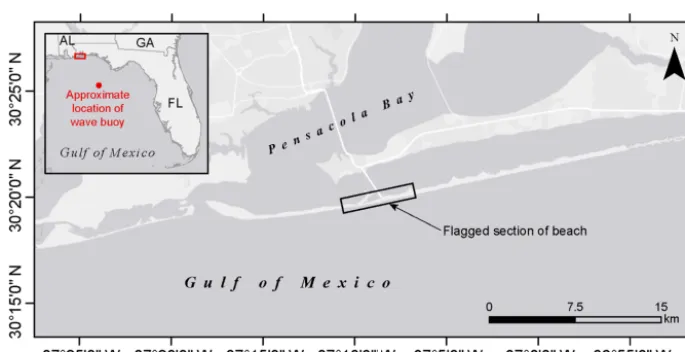
Figure 1.Map of study site showing location of the flagged section of beach and approximate location of the wave buoy used in the analysis and for regional rip forecasts (ESRI, 2019).
Rescues, assists, and prevents are recorded regardless of whether they are conducted in a “guarded” area, a designated swimming area where there are typically many beach users (Casino Beach, Fort Pickens Gate Beach, and Park East), or along the∼13 km of unguarded beach where lifeguards conduct regular patrols and respond to emergency calls. As shown by Barrett and Houser (2013), there are rip current hotspots with semi-permanent alongshore variation in the nearshore morphology due to a ridge and swale bathymetry on the inner shelf (Fig. 2). The innermost bar varies along-shore at a scale of∼1000 m, consistent with the ridge and swale bathymetry (Houser et al., 2008), and tends to exhibit a transverse-bar and rip morphology immediately landward of the deeper swales (Barrett and Houser, 2012; see Fig. 1). His-torically, most drownings and rescues on this popular beach have occurred at these rip hotspots because they correspond to the main access points along the island (Houser et al., 2015b; Trimble and Houser, 2017).
Santa Rosa Island experienced widespread erosion and washover during Hurricane Ivan in September 2004. The storm reinforced the alongshore variation in the nearshore bar morphology and forced the bars farther offshore. As de-scribed in Houser et al. (2015a), the nearshore bars migrated landward and recovered to the beachface for 3 years follow-ing the storm. Durfollow-ing this period, the inner-bar morphology transitioned from a rhythmic bar and beach morphology to a transverse-bar and rip morphology before ultimately attach-ing to the beachface in May 2008 (Houser and Barrett, 2010). This changing bar morphology is a primary control on the presence of rip channels, with the greatest density of rips present in 2005 as the innermost bar first started to develop a transverse-bar and rip morphology (Houser et al., 2011).
3 Methodology
Offshore wave conditions and wind forcing function are based on long-term meteorological and oceanographic records from an offshore wave buoy located∼100 km south-east of the study area (buoy 42039; Fig. 1). Between 2004 and 2008, this was the closest buoy to Pensacola Beach and had been previously used to estimate the incident wave field (Wang and Horwitz, 2007; Claudino-Sales et al., 2008, 2010; Houser et al., 2011), and it was the basis for the rip hazard at Pensacola Beach until a new buoy was placed closer to the beach in 2009. The available wave data from buoy 42039 included offshore significant wave height, significant wave period, and direction, and the wind data included speed and direction. Local water level data were acquired from a sta-tion at the Port of Pensacola just north of the study site. A decision tree analysis was used to determine what com-bination of wave and wind forcing was associated with the flag posted by the Santa Rosa Island Authority on that day. After training on the available dataset, the model produces a decision tree that can be used for future decisions about what flag colour should be posted, although further training would be required to validate the model and operationalize. The modelled (i.e. predicted) flag colour is then compared to the posted flag colour for all days to determine if there is a relationship between the flag colour and the number of res-cues. The comparison is also used to determine if there is a specific combination of wind and wave forcing on the days when the modelled flag colour and the posted flag colour do not align.
ex-Figure 2.Satellite image of the flagged section of beach in April 2004 (before Hurricane Ivan) showing the presence of transverse-bar and rip morphology of the innermost bar and the variable nature of the outermost bar for the flagged section of beach. The aerial image is not necessarily representative of the nearshore morphology throughout the remainder of the study (© Google Earth 2019).
plain the results in a given dependent variable. To develop a decision tree, the first step is declaring the root node; this cor-responds to the target variable that will be predicted through-out the model. Then, the independent variable that provides the most information about the target values is identified. The root node is then split on this independent variable into statistically significant different subgroups using theF test. These subgroups are then split using the predictor variables that provide the most information about them. CHAID anal-ysis continues this process until terminal nodes are reached and no splits are statistically significant. Previous use of CHAID analysis in hazard studies includes landslide pre-diction (e.g. Althuwaynee et al., 2014), farmer perception of flooding hazard (Bielders et al., 2003; Tehrany et al., 2015), and property owner perception and decision making along an eroding coast (Smith et al., 2017).
4 Results
The decision tree model was trained on the 1125 d with com-plete data between 2004 and 2008. Over this same period there were 145 d with rescues. The annual number of rescues and rescue days (i.e. days with one or more rescues) varied by year, with a peak in both the total number of rescues and the number of rescue days in 2005. The number of rescues was at a minimum in 2007, while the number of rescue days was at a minimum in 2006 (Fig. 3). The number of rescues de-creased linearly between 2005 and 2007 as the nearshore bar morphology continued to recover following Hurricane Ivan and welded to the beachface, consistent with previous ob-servations at the site (Houser et al., 2011). It is important to note that the CHAID analysis does not incorporate nearshore morphology as an independent variable because changes in nearshore morphology were not tracked daily over the study
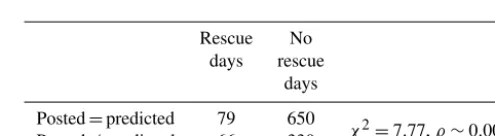
Table 1.Results ofχ2analysis of posted and predicted flag colour versus rescue and no rescue days at Pensacola Beach, Florida, be-tween 2004 and 2008.
Rescue No days rescue
days
Posted=predicted 79 650
χ2=7.77,ρ∼0.005 Posted6=predicted 66 330
period. In this respect, differences between the posted and predicted flag colour may reflect lifeguard observations of nearshore morphology conducive to the development of rip currents despite winds and waves typical of green flag con-ditions.
The decision tree analysis suggests that the posted flag colour was not predicted by the model on 35 % of days be-tween 2004 and 2008 (n=396). There was a total of 342 res-cues over 66 days when the model predicted a different flag than was posted representing over 60 % of all rescues (Ta-ble 1). By comparison, 40 % of all rescues (n=224) oc-curred over 79 days when the predicted and posted flags were the same.χ2analysis suggests that the number of res-cue days is significantly greater at the 95 % confidence level when the predicted and posted flags are different (χ2=7.77, ρ∼0.005). This supports the hypothesis that there are a greater number of rescues performed on days when there is a discrepancy between the predicted and posted flag colour.
Figure 3.Interannual variation in number of rescues and rescue days at Pensacola Beach between 2004 and 2008.
Table 2.Results ofχ2analysis of posted and predicted flag colour versus rescue and no rescue days at Pensacola Beach, Florida, be-tween 2004 and 2008.
Rescue No days rescue
days
Posted>predicted 47 171
χ2=18.11,ρ∼0.0001 Posted<predicted 19 159
Posted=predicted 79 650
(χ2=18.11,ρ∼0.0001). The number of rescue days was over-represented when the posted flag colour was red or yel-low, but the model predicted that the flag should have been yellow or green, respectively, suggesting that posting what a beach user may perceive as an overly cautious flag can present a danger. These 47 d were associated with 268 of the total 566 rescues between 2004 and 2008, or∼7.2 rescues per day when the island authority posted a more cautious flag than was predicted by the model . In comparison, the number of rescues (n=298) was under-represented on days when the posted flag suggested conditions were not as haz-ardous (n=74) as the model or were identical to the model (n=224).
The greatest number of rescues were performed on days when the posted flag was yellow (moderate hazard, moder-ate surf and/or currents), but the model predicted a green flag (low hazard, relatively calm surf and/or currents) based on the wind and wave forcing. Specifically, a total of 231 res-cues were performed on 37 of the 168 d when the posted flag was yellow, and the model predicted that the flag colour should be green. In comparison, there were only 12 rescues on 3 of 20 d when the posted flag was red (high hazard, strong surf and/or currents) and the model-predicted flag colour was green. Finally, there were 25 rescues preformed on 7 of 30 d when a red flag was posted, and the model predicted a yellow flag was appropriate. The number of rescues and rescue days when the posted flag was more cautious than predicted by the model were at a maximum in 2005 and linearly decreased to
Table 3.Number of days and rescues (in brackets) based on the combination of posted and predicted flag colours.
Predicted flag
G Y R
Posted flag G 475 (48) 83 (7) 15 (1) Y 168 (231) 154 (125) 80 (66) R 20 (12) 30 (25) 100 (51)
a minimum in 2007 as the bar morphology recovered from Hurricane Ivan.
While there were fewer-than-expected rescue days when the posted flag was green or yellow and the model predicted a yellow or red flag, rescues were still performed on those days. There was a total of 66 rescues on 13 of 80 d when the posted flag was yellow, but the model predicted a red flag should be posted (Table 3). Only seven rescues were performed on 5 of the 83 d when the posted flag was green and the model predicted a yellow flag, with even fewer res-cues performed on days when the posted flag was green but should have been red. The number of rescues and rescue days when the posted flag was lower than the predicted flag de-creased from 2004 to 2007, with a statistically significant outlier in 2008. The large number of rescues in 2008 is the result of 2 d with 13 rescues each (19 April and 14 Septem-ber), when a yellow flag was being flown, but the model pre-dicted a red flag was more appropriate. This suggests that the difference between posted and predicted flag colours can vary inter-annually with changes in the nearshore morphol-ogy and/or changes in the individual who makes the flag de-cision.
5 Discussion
had a transverse-bar and rip morphology, which is common at this location. The morphology of the nearshore and other variables that could influence whether a beach user will en-ter the waen-ter or not (e.g. weather, number of beach users, or presence of seaweed) are not captured by the current model, which is based on wind and wave forcing alone. The model developed in this study is similar to rip forecasts produced by the US National Weather Service (NWS) and does not include local variables known to the beach manager based on experience and years of careful observation. Discrepan-cies between the predicted and posted flag colours provide a basis for future model development and expansion. Incorpo-rating more data into the model will cause it to evolve and better capture the variables that influence the colour of flag chosen by the lifeguards, while ensuring that the model re-mains computationally efficient. Introducing additional vari-ables, such as nearshore morphology, to the model has the potential to better capture a lifeguard or beach manager’s un-derstanding of what constitutes dangerous surf conditions at their beach. At the same time, it is also important to examine the accuracy of beach managers and lifeguards in assessing the nearshore morphology and potential for rip development. The model predictions and most forecasts are based solely on wind and wave forcing (Lushine, 1991a, b; Lascody, 1998; Engle et al., 2012; Dusek and Seim, 2013; Kumar and Prasad, 2014; Scott et al., 2014; Moulton et al., 2017). Noticeably absent from the current model is surf zone mor-phology, which ultimately determines whether a rip can de-velop under those conditions or not. The beach manager and lifeguard can observe the nearshore morphology and assess the potential for rip development, which would lead to them putting out a yellow or red flag when the model would pre-dict a green or yellow flag as being appropriate. While beach managers and lifeguards are being prudent, their assessment may not conform to those of the beach user who decides on whether the water is safe or not based on wave-breaking con-ditions (Caldwell et al., 2013; Brannstrom et al., 2014, 2015). Most beach users assume that larger breaking waves are more dangerous, and many will not enter the water if they (and the model) believe that it is a red flag condition. This may par-tially explain why there were fewer-than-expected rescues on days when the posted flag colour was green or yellow and the model predicted a yellow or red flag, respectively. In-dependent of the flag or warning signs, beach users appear
and Brannstrom et al. (2014) most beach users along the Gulf Coast of the US assume that the calm flat water of a rip is safer than adjacent areas where the waves are breaking. The lifeguard, however, may observe a bar morphology that is conducive to the development of rips and post a yellow flag to warn about the potential for rips, despite the weak wind and wave forcing. As observed by Barrett and Houser (2012), rips with speeds of∼0.5 m s−1 can develop on green flag days because of the transverse-bar and rip morphology that is present in the inner-nearshore. This would suggest that post-ing a green flag should never be permitted when wind and swell waves are breaking over the bar, even if the regional forecast suggests a low-level hazard that day. As shown by Scott et al. (2014), rescues are still possible with seemingly fine-weather conditions when a green flag would be predicted by the model or in regional forecasts. Even in the presence of a small swell wave, breaking can be induced as water levels fall with the tide (Castelle et al., 2016).
It is difficult for beach users to spot a rip or assess the potential for rip development, and they may assume that the lifeguard is being overly cautious if they perceive fine-weather conditions and the lifeguard posts a yellow or red flag. Going to the beach is a reward-based activity, and many people commit significant personal and financial investment to be at the beach (Ménard et al., 2018). If they believe that the lifeguard is wrong they will ignore the warning and re-main committed to entering the water. The longer and more times that their perceptions are inconsistent with the experi-ence and knowledge of the lifeguard, the more trust in au-thority is lost – a beach that is perceived to be safe based on experience will always be safe despite warnings to the con-trary (Ménard et al., 2018). This is an example of confirma-tion bias, in which an opinion quickly becomes entrenched and subsequent evidence is used to either bolster the belief or is rapidly discarded. How this can be addressed to reduce the number of rescues is an important focus for future research on rips and other hazards in general.
the model will only be accurate if the bar morphology and conceptual knowledge of the lifeguard is included as input variables. Getting the beach user to observe and heed that forecast and warning, however, will remain a challenge.
6 Conclusions
Lifeguards and beach managers decide on warnings and flag colours based on careful monitoring of the changing surf conditions along the beach and over the course of the day using both regional surf forecasts and direct observation. A decision tree analysis predicts a flag colour different to the one flown on ∼35 % of days between 2004 and 2008 (n=396/1125) and that those differences account for only 17 % of all rescue days and ∼60 % of the total number of rescues. The posting of a yellow flag when the model would predict a green flag based solely on the wind and wave forc-ing was found to be responsible for the largest number of rescues over the study period. Variables such as the nearshore morphology and the potential for rip development are not in-cluded in traditional forecasts or the model developed in this paper, and most beach users use a simple assessment of wave breaking to determine if the water is safe. Even though a life-guard will post the appropriate flag based on direct observa-tion of the bar morphology and experience, the beach user, like simple models based solely on meteorological data, may not believe that warning and still enter the water. This sug-gests that reducing the number of rip and surf rescues will require that we are able to address confirmation bias on the part of the beach user, which can cause them to lose their confidence in the lifeguards.
Data availability. The flag and lifeguard data were provided to the authors by the Santa Rosa Island Authority, who maintain owner-ship and access to the data. The buoy data can be freely accessed at https://www.ndbc.noaa.gov/ (last access: November 2019).
Author contributions. CH had a role in the conceptualization, in-vestigation, and writing of the manuscript. JL and NC performed the formal analysis and developed the methodology. PW was involved in the conceptualization and advising. All authors were involved in the writing, review, and editing processes.
Competing interests. The authors declare that they have no conflict of interest.
Acknowledgements. This study was partly funded through a NSERC Discovery Grant to Chris Houser.
Review statement. This paper was edited by Mauricio Gonzalez and reviewed by Alejandro Gutiérrez Echeverría and one anony-mous referee.
Financial support. This research has been supported by the NSERC Discovery.
References
Althuwaynee, O. F., Pradhan, B., Park, H. J., and Lee, J. H.: A novel ensemble decision tree-based CHi-squared Automatic In-teraction Detection (CHAID) and multivariate logistic regres-sion models in landslide susceptibility mapping, Landslides, 11, 1063–1078, 2014.
Arozarena, I., Houser, C., Echeverria, A. G., and Brannstrom, C.: The rip current hazard in Costa Rica, Nat. Hazards, 77, 753–768, 2015.
Barrett, G. and Houser, C.: Identifying hotspots of rip current ac-tivity using wavelet analysis at Pensacola Beach, Florida, Phys. Geogr., 33, 32–49, 2012.
Bielders, C. L., Ramelot, C., and Persoons, E.: Farmer perception of runoff and erosion and extent of flooding in the silt-loam belt of the Belgian Walloon Region, Environ. Sci. Policy, 6, 85–93, 2003.
Brander, R. W., Bradstreet, A., Sherker, S., and MacMahan, J.: Re-sponses of swimmers caught in rip currents: Perspectives on mit-igating the global rip current hazard, Int.J. Aquat. Res. Educ., 5, 11, 2011.
Brander, R., Dominey-Howes, D., Champion, C., Del Vecchio, O., and Brighton, B.: Brief Communication: A new perspec-tive on the Australian rip current hazard, Nat. Hazards Earth Syst. Sci., 13, 1687–1690, https://doi.org/10.5194/nhess-13-1687-2013, 2013.
Brannstrom, C., Trimble, S., Santos, A., Brown, H. L., and Houser, C.: Perception of the rip current hazard on Galveston Island and North Padre Island, Texas, USA, Nat. Hazards, 72, 1123–1138, 2014.
Brannstrom, C., Brown, H. L., Houser, C., Trimble, S., and Santos, A.: “You can’t see them from sitting here”: Evaluating beach user understanding of a rip current warning sign, Appl. Geogr., 56, 61–70, 2015.
Brewster, B. C., Gould, R. E., and Brander, R. W.: Estimations of rip current rescues and drowning in the United States, Nat. Hazards Earth Syst. Sci., 19, 389–397, https://doi.org/10.5194/nhess-19-389-2019, 2019.
Brighton, B., Sherker, S., Brander, R., Thompson, M., and Brad-street, A.: Rip current related drowning deaths and rescues in Australia 2004–2011, Nat. Hazards Earth Syst. Sci., 13, 1069– 1075, https://doi.org/10.5194/nhess-13-1069-2013, 2013. Caldwell, N., Houser, C., and Meyer-Arendt, K.: Ability of beach
users to identify rip currents at Pensacola Beach, Florida, Nat. Hazards, 68, 1041–1056, 2013.
Castelle, B., Scott, T., Brander, R., and McCarroll, R. J.: Rip current types, circulation and hazard, Earth-Sci. Rev., 163, 1–21, 2016. Claudino-Sales, V., Wang, P., and Horwitz, M. H.: Factors
im-J. Coast. Res., 29, 909–925, 2013.
Engle, J., Macmahan, J., Thieke, R. J., Hanes, D. M., and Dean, R. G.: Formulation of a Rip Current Predictive Index Using Rescue Data, in: Proc. National Conf. on Beach Preservation Technol-ogy, FSBPA, 26–28 September 2049, Naples, Florida, 2012. Espluga, J., Farré, J., Gonzalo, J., Horlick-Jones, T., Prades, A.,
Oltra, C., and Navajas, J.: Do the people exposed to a technolog-ical risk always want more information about it? Some observa-tions on cases of rejection, in: Safety, Reliability and Risk Anal-ysis, CRC Press, Taylor & Francis, Londres, 1301–1308, 2009. ESRI: Pensacola Beach, 1:36 000, World Light Gray
Base, 30 August 2019, available at: http://www.arcgis. com/home/webmap/viewer.html?useExisting=1&layers= ed712cb1db3e4bae9e85329040fb9a49, last access: 23 Octo-ber 2019.
Fallon, K. M., Lai, Q., and Leatherman, S. P.: Rip current literacy of beachgoers at Miami Beach, Florida, Nat. Hazards, 90, 601–621, 2018.
Gallop, S. L., Woodward, E., Brander, R. W., and Pitman, S. J.: Perceptions of rip current myths from the central south coast of England, Ocean Coast. Manage., 119, 14–20, 2016.
Google Earth 7.0: Pensacola Beach 30.332240◦N,
−87.151810◦W, elevation 5 Km, available at: http: //www.google.com/earth/index.html, last access: 23 Octo-ber 2019.
Houser, C. and Barrett, G.: Divergent behavior of the swash zone in response to different foreshore slopes and nearshore states, Mar. Geol., 271, 106–118, 2010.
Houser, C., Hapke, C., and Hamilton, S. Controls on coastal dune morphology, shoreline erosion and barrier island response to ex-treme storms, Geomorphology, 100, 223–240, 2008.
Houser, C., Barrett, G., and Labude, D.: Alongshore variation in the rip current hazard at Pensacola Beach, Florida, Nat. Hazards, 57, 501–523, 2011.
Houser, C., Arnott, R., Ulzhöfer, S., and Barrett, G.: Nearshore Cir-culation over Transverse Bar and Rip Morphology with Oblique Wave Forcing, Earth Surf. Proc. Land., 38, 1269–1279, 2013. Houser, C., Wernette, P., Rentschler, T., Jones, H., Hammond, B.,
and Trimble, S.: Post-storm beach and dune recovery: implica-tions for barrier island resilience, Geomorphology, 234, 54–63, 2015a.
Houser, C., Murphy, T., and Labude, D.: Alongshore correspon-dence of beach users and rip channels at Pensacola Beach, Florida, Nat. Hazards, 78, 2175–2183, 2015b.
Houser, C., Trimble, S., Brander, R., Brewster, B. C., Dusek, G., Jones, D., and Kuhn, J.: Public perceptions of a rip current hazard education program: “Break the Grip of the Rip!”, Nat. Hazards
Lushine, J. B.: A study of rip current drownings and related weather factors, in: Natl. Wea. Dig, 16, 1991a.
Lushine, J. B.: Rip Currents: Human Impact and Forecastibility, in: Coastal Zone ’91, ASCE, Long Beach, California, 3558–3569, 1991b.
Matthews, B., Andronaco, R., and Adams, A.: Warning signs at beaches: Do they work?, Safety Sci., 62, 312–318, 2014 Ménard, A. D., Houser, C., Brander, R. W., Trimble, S., and
Sca-man, A.: The psychology of beach users: importance of confir-mation bias, action, and intention to improving rip current safety, Nat. Hazards, 94, 953–973, 2018.
Moulton, M., Dusek, G., Elgar, S., and Raubenheimer, B.: Compar-ison of Rip Current Hazard Likelihood Forecasts with Observed Rip Current Speeds, Weather Forecast., 32, 1659–1666, 2017. Scott, T., Masselink, G., Austin, M. J., and Russell, P.: Controls on
macrotidal rip current circulation and hazard, Geomorphology, 214, 198–215, 2014.
Silva-Cavalcanti, J. S., Costa, M. F., and Pereira, P. S.: Rip currents signaling and users behaviour at an overcrowded urban beach, Ocean Coast. Manage, 155, 90–97, 2018.
Smith, C. S., Gittman, R. K., Neylan, I. P., Scyphers, S. B., Morton, J. P., Fodrie, F. J., Grabowski, J. H., and Peterson, C. H.: Hur-ricane damage along natural and hardened estuarine shorelines: Using homeowner experiences to promote nature-based coastal protection, Mar. Policy, 81, 350–358, 2017.
Tehrany, M. S., Pradhan, B., and Jebur, M. N.: Flood susceptibility analysis and its verification using a novel ensemble support vec-tor machine and frequency ratio method, Stoch. Environ. Res. Risk Assess., 29, 1149–1165, 2015.
Trimble, S. and Houser, C.: Seawalls and Signage: How Beach Ac-cess Management Affects Rip Current Safety, in: Beach Man-agement Tools – Concepts, Methodologies and Case Studies, Springer, Cham, 497–524, 2017.
Tuscaloosa News: Panhandle Island to step up lifeguard patrol, The Tuscaloosa News, 3 April 2002.
Vlodarchyk, B., Olivito, A., and Houser, C.: Spatial and Tempo-ral Variation of Surf Drownings in the Great Lakes: 2010–17, J. Coast. Res., 35, 794–804, 2019.
Wachinger, G., Renn, O., Begg, C., and Kuhlicke, C.: The risk per-ception paradox – implications for governance and communica-tion of natural hazards, Risk Analysis, 33, 1049–1065, 2013. Wang, P. and Horwitz, M. H.: Erosional and depositional
charac-teristics of regional overwash deposits caused by multiple hurri-canes, Sedimentology, 54, 545–564, 2007.
in Australia for beachgoers, rural residents and international tourists, Aust. New Zeal. J. Publ. Health, 36, 385–391, 2012. Woodward, E., Beaumont, E., Russell, P., Wooler, A., and Macleod,
R.: Analysis of rip current incidents and victim demographics in the UK, J. Coast. Res., 65, 850–856, 2013.