Morphometric Analysis of a selected drainage system in the northern part of the Western Desert of Egypt.
Mona Elsoghier
MSc student candidate Geology Department, South Valley University
Abstract:
Geographic Information System (GIS) and image processing techniques were employed to study the geomorphic and the morphometric features of a selected drainage system in the Western Desert of Egypt. The computed morphometric parameters including linear, areal and relief aspects. Reveled that the basin is influenced by rainfall potential zone and the underlying rock unites. The studied watershed, stream frequency (1.4) indicating moderate frequency. This reflects a positive correlation with drainage density. The bifurcation ratio (3.6) revealed that the studied structurally controlled. Circulatory ratio and elongation ratio show elongated in shape, the high elongated channel gradient, low discharge of runoff and highly permeability revealing tectonically active and revealing the groundwater potential zones.
1. Introduction:
The morphometric analysis of the drainage system reveals climate, geomorphology, structural, and geologic features. The geomorphologic investigation helps to describe the evolution of surface drainage (Horton, 1945; lopold and Maddock.1953; Abrahams, 1984). Morphometric analysis of watershed also gives a quantitative description of the drainage system (strahler, 1964). The important of morphometric analysis can be used to correlate the hydrologic characteristic with physiographic characteristics of drainage basins such as size, slope, shape, and drainage density, the slope of drainage area, size and length of the tributaries. Hydrologists and geomorphologists were identified that certain relation is significant between runoff and geographic and geomorphic characteristics of the drainage systems. (Abedkareem 2016), the drainage basin analysis can be also used in any investigation of ground water potential, and management. Remote sensing data contributed in understanding the geomorphic characteristic, identification of erosion-prone area, evolving water conservation strategies selection of sites for cheek dams and reservoirs .Therefore, the present study was conducted using Geographical information system (GIS) techniques for analyzing the morphometric parameters of the drainage system. In order to understand the geologic and geomorphic characteristics of the studied basin.
2. Material and method:
The present study is located in the northern part of the Western Desert of Egypt. The morphometric analysis was performed by remote sensing and GIS techniques. In this article the morphometric analysis was performed on the selected basin of the Qattara Depression. Stream order was generated by Strahler law which branched stream as first order. The second order stream was formed when the two first orders was linked. Two second order connects together to form the third order. Morphometric parameters are processed by standard method and formula (Horton, 1932 &1945; Strahler, 1964; Smith, 1954; Miller, 1953; Schumn, 1956; Nookaratm, 2005). The computed parameters show in Table1.
3. Study area:
and the Upper clastic division of Oligocene to Recent age. Sandstones and other Quaternary deposits with some minor Oligocene rocks are occupying the north eastern part of the study area.
Fig1. Stream-network extractio
n of studied
basin (a); Digital elevatio
n
model(b) stream-networks; (c) stream-order. 4. Result of morphometric analysis:
4.1. Stream order:
The stream segments were ordered according to Strahler (1952). It described the relative position of stream segments in an erosional drainage basin network (Golts and Rosenthal, 1993).The stream order was first supported by Horton (1945). While Strahler (1952) was reformed it. Strahler (1967) method used for analysis the study area. It depended on the intersection of two first-order links will follow with a second- order link. Consequently, the intersection of two second-order link will follow with the third-order link etc. It was noticed that there is a decrease in the stream frequency as the stream third-order increases. Based on Strahler (1952,1967)The studied basin was classified into seven orders (Fig.1c). 4.2. Stream length:
The stream of relatively smaller lengths reflects of areas with higher slopes and finer textures. Stream lengths increase in the first order and decrease as the stream order increases. This represents the relation between the climate, vegetation, and resistance rock and soil to erosion. The stream lengths of the studied basin range from 13.85 m to 1775.51 m with an averaged about 502.73 m.
4.3. Stream number (Nu):
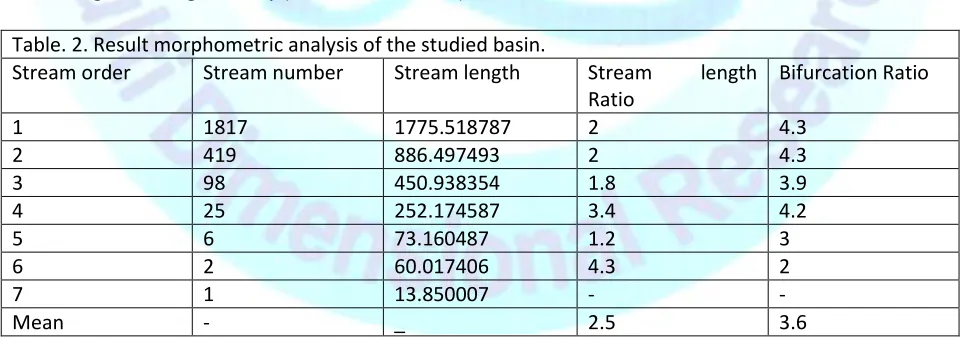
Each order has a number of streams that is computed as stream number. Longer lengths of streams show flatter gradients. The stream number values are listed in Table 2.
4.4. Bifurcation ratio (Rb)
drainage pattern (Strahler, 1964). Little differences in the environmental conditions of the sub-basin is indicated by values of the bifurcation ratio. The mean bifurcation ratio value of this basin is 3.6 which indicate that the geological structure is less disturbing the drainage pattern.
4.5. Stream length ratio (RL):
Stream length ratio plays an important role in detecting the relationship between the surface flow, discharge and erosion stage of the basin. Mean stream length represents a dimensional property that illustrating the components of drainage network. It is computed by dividing the total length of the stream of an order by a total number of segments in the order (Table.1). Stream length ratio is the ratio of the mean (LU) of a segment of order to mean length of segments of the next lower order which was likely to constant throughout the successive orders of the basin. The stream lengths show that the mean stream lengths of the stream segments of each of the successive orders of the watershed have approximately a direct geometric sequence. The first term is the average length of segments of the first order. The stream lengths (Rl) value is (3512.2), which prove the variations in the slope and
Table.1 indicate morphometric parameters
parameters symbol formula reference
Linear aspect
Stream order Su Straheler(1952)
Number of streams Nu Nu=No.of stream segments 0f given order Horton(1945)
Total length of streams L u Lu=Length of stream (Km) Straheler(1964)
Bifurcation Ratio Rb Rb=Nu\Nu+1
Nu+1 = No. of stream segments of next
higher order Nu = known above
Straheler(1964)
Mean Bifurcation Ratio Rbm Rbm = average of bifurcation ratios of all
orders length of the stream (KM)
Straheler(1964)
Stream length Ratio Rl Rl =Lu\Lu-1
Lu = know above
Lu-1 = stream length of next lower order
Straheler(1964)
Mean Stream length Ratio Lsm Lsm = average of stream length of all
orders
Horton(1945)
Basin Geometry
Basin Area A Area from which water drains to common
stream and boundary determined by opposite ridge
Schumm(1956)
Basin length Lb Lb = Largest horizontal distance between
2 points
Schumm(1956)
Basin perimeter P P = outer boundary of drainage basin
measured in kilometer
Schumm(1956)
Areal and relief aspect
Drainage density Dd Dd = Ʃ Lu ∕ A
Dd = Drainage density (Km\Km2)
Lu = total stream length
A = Area
Stream frequency Fs Fs = Ʃ Nu ∕ A
Nu and A = known above
Horton(1932)
Basin relief Bh Bh = Zx – Zm
Bh = Basin relief in kilometer
Zx = maximum elevation of basin
Zm = minimum elevation of the basin
Straheler(1952)
Relief ratio Rh Rh = Bh ∕ Lb
Rh = Relief ratio in kilometer
Bh = Basin Relief and Lb = Basin Length
Schumm(1956)
Ruggedness number Rn Rn = Bh × Dd
Bh = Relief ratio and Dd = Drainage
density
Texture ratio T T = N1 ∕ P
N1=No.of streams in given order and
P=Perimeter
Schumm(1965)
factor Form Rf Rf = A ∕ (Lb)²
A= Area and Lb length
Horton(1932)
Circulatory ratio Rc Rc = 4πA ∕ P²
A=Basin area (Km2) and P=perimeter of Basin (Km)
Miller(1953)
Elongation ratio Re Re = √ (A−π) ∕ Lb
A= Area (Km2) and Lb= length of basin
(Km)
Schumm(1956)
Length of overland flow Lg Lg = 1 ∕ 2Dd
Dd= Drainage density (Km2\Km)
Horton(1945)
Constant channel
maintenance
Lof Lof = 1 ∕ Dd
Dd= Drainage density
Schumm(1956)
Infiltration number IF IF = Dd × Fs
Dd= Drinage density and Fs= stream
frequency
Faniran(1968)
Channel gradient Cg Cg = Bh ∕ *(π ∕ 2) × Lb]
Cg=longest dimension parallel to the
principal drainage line
Bh= basin relief , Lb= length of basin
Broscoe(1959)
The stream length ratio varying between 1.2 to 4.3 (Table 2). 4.6. Basin area: (A)
Basin area (A) defined as the total area projected upon a horizontal plane. Schumm (1956) founded an interesting relation between the total watershed area and the total stream lengths, which are reinforced by the contributing areas (Table.1). Horton (1945), watershed was sorted by size into the category of large basin. The total basin area is 2705 Km2 (Table.3).
4.7. Basin perimeter (P):
Basin perimeter is the length of the boundary of the basin. It is also determined the length of the divides between watersheds. It used as a sign of watershed size and shape. The perimeter of this basin is about 510.80 Km.
4.8. Basin length (Lb):
Basin length was the travel time of surface runoff especially the flood waves passing through the basin. The length of this basin is about 18.593 Km.
4.9. Drainage density (Dd):
Drainage density is defined as the closeness of spacing of channel, thus it gives a quantitative measure of the average length of stream channel for the whole basin. Low drainage density proved the erosion resistant fractured rocks and evidence for that the rainfall infiltrates to recharge the ground- water aquifers. The high drainage density indicate weak or impermeable sub-surface material, and mountainous region which have coarse drainage texture appeared with low drainage density. The fine drainage texture characterized by high drainage density. The computed drainage density (Dd) of the present study is 1.3 that represents a moderate drainage density.
4.10. Stream frequency (FS):
It is the total number of stream segments of all orders per unit area (Horton, 1932). It reflects the lithological characteristics. The basins of the structural hills give high-level of stream frequency and drainage density, while the basins of alluvial deposits revealing low values (Horton, 1945). The stream frequency of the studied basin is about 0.9 that reveals moderate Fs and indicates the positive correlation with the drainage density values which the increase in stream population with respect to increasing in drainage density (Abdelkareem 2016).
Table. 2. Result morphometric analysis of the studied basin.
Stream order Stream number Stream length Stream length
Ratio
Bifurcation Ratio
1 1817 1775.518787 2 4.3
2 419 886.497493 2 4.3
3 98 450.938354 1.8 3.9
4 25 252.174587 3.4 4.2
5 6 73.160487 1.2 3
6 2 60.017406 4.3 2
7 1 13.850007 - -
Mean - _ 2.5 3.6
4.11. Basin relief (Bh):
The basin relief is defined as the difference between the maximum elevation and minimum elevation of the basin (Table 1). It is about 0.4 of the studied basin that reveals a moderate relief.
According to schumm (1956), the relief ratio is the ratio between the total relief of the basin and the longest dimension of the basin parallel to the main drainage line. It determines the overall steepness of a drainage basin and expressed the intensity of erosional process operating on the slope of the basin. The loose sediments are closely correlated with relief ratio which shows the relation between the relief ratio and hydrologic characteristics of a basin (schumm, 1956). The relief ratio of the studied basin is 0.02 reveling a low relief.
4.13. Ruggedness (Rn):
Ruggedness number represents slope index and gives a good description of a relief ruggedness within the watershed (melton, 1965). High values of ruggedness number lead to a steep and long slope of the basin. Strahler's (1968) suggested that the ruggedness number calculated with the drainage density basin relief and the slope steepness related with its length. Low ruggedness value of the basin means less prone to soil erosion and yield intrinsic structural complexity in association with relief and drainage density. The ruggedness number is about 0.52 that reveal low value (table 3).This low value infers to less prone to soil erosion and has a complexity of true in a relationship with relief and drainage density. 4.14. Texture ratio:
Texture ratio plays an important role in analysis of the drainage basin which is influenced by relief aspect of the terrain. Smith (1958) classified the texture ratio of the basins into three classes as the following: coarse (<6.4 km-1), intermediate (6.4-16 km-1) and fine (>16 km-1). The computed texture ratio
of the studied basin is about 3.6 that indicate a fine texture (Table.3). 4.15. Form Factor (Rf):
The Form Factor (Horton, 1932) represents a mean numerical index that indicates the shape of the basin and its valued ranges from 0.1 to 0.8. Also, known as the dimensionless ratio of basin area to the square of basin length. Basin shape detected by simple dimensionless ratios of the basic measurements of area, perimeter and length (Singh, 1998). Basins that have a low value of form factor mostly like to be more elongated, less intense rainfall simultaneously and take lower peak runoff of longer duration (Gupta 1999). The basins of high values of form factor represent a high peak runoff of longer duration. The studied basin donates the high value of form factor which is about 7.8(table 3). This impels a larger peak of flows of short duration.
4.16. Circulatory ratio (Rc):
Miller (1953) defined the circulatory ratio as the ratio of basin area to the area of the circle with the same perimeter of the basin. He described the basin of the circularity ratio of numeric number 1 (one) value was of circular shape indicating uniform infiltration and takes long time to reach excess water at basin outlet. The basin of circularity ratios ranges 0.4 to 0.5 represents a strongly elongated and highly permeable homogeneous geologic material that refers to low active tectonic. The studied basin is about 0.5 value of the circulatory ratio referring to an elongated shape, low discharge of runoff and highly permeability of the subsoil condition (Table.3).Circulatory ratio of the studied basin is 0.13 that reveals a very elongated basin.
4.17. Elongation ratio (Re):
4.18. Length of over land flow (Lx):
Length of over land flow was very important factor which affected with both hydrologic and physiographic development of the drainage basin. Horton (1945) defined it as the runoff of the rain water on the ground surface before it excites insures channels. The average of this length is about half the distance between the stream channels. It influenced with infiltration through the soil that varies in time and space. Basin of the study area confirms the low range of length of overland flow that is about 0.4. The low value means that surface water concentrates faster than the basin of high value.
4.19. Constant channel maintenance (Lof):
The constant channel maintenance (Schumm, 1956) has a dimension of length and increase in magnitude because the scale of the land-form unit increases. Strahler (1957) indicate of that the relative size of landform units in a drainage basin and give specific genetic connotation in this method. The value ofConstant channel maintenance basin is 0.8 indicates that the surface needs in basis for a creation of one linear foot of the stream channel.
4.20. Channel gradient (Cg):
Horton's low of stream slopes reflects that there is a fairly based relationship between the slope of the streams and their orders. This show that an inverse geometric channel slope reduces with increasing order number. The slope of channel decreases by increasing the order number of the basin. Also, we notice that the stream not be linear but it is braided form. The channel gradient of the studied basin is 0.01that refers to the low slope of channel.
4.21. Infiltration number (Lf): Table.3. Areal and relief aspect
Parameter Value
Area 2705.680495
Perimeter 510.807387
Basin order 7
Drainage density 1.3
Stream frequency 0.9
Zx 251
Zm -95
Basin relief 0.4
Basin Length 18.593
Relief ratio 0.02
Ruggedness number 0.52
Texture ratio 3.6
factor Form 7.8
Circulatory ratio 0.13
Elongation ratio 0.5
Length of overland flow 0.4
Constant channel maintenance
0.8
Infiltration number 1.2
Channel gradient 0.01
Infiltration number describes as the results of drainage density and stream frequency that provides us with an interpretation of the infiltration characteristics of the basin. Low runoff and high infiltration appeared when the infiltration number was low value. This factor presented by Faniran (1968). It provided an important information about impermeable lithology and higher relief. The value of the computed infiltration number is about 1.2 that reflects low runoff.
4.22. Main channel length (Cl):
The main channel length refers to the length of the longest basin from the outflow point of designated basin to the upper limit to the basin boundary. The longest channel founded in this basin having 70 km.
5. Conclusions:
The morphometric analysis carried out in a selected drainage system in northern part of the Western Desert of Egypt indicated that the basin of low relief terrain, ruggedness, high elongated in shape and fine texture that revealed structural control. The morphometric parameters evaluated using GIS-assisted to understand various terrain parameters such as nature of the bedrock, infiltration capacity, and runoff. The computed values refer to low runoff and high infiltration capacity. The overall results revealed that analysis of drainage system displayed significant information on geomorphic and hydrologic conditions.
6. References:
Abdelkareem, M.2016 Targeting flash flood potential areas using remotely sensed data and GIS techniques, Natural Hazards, pp. 1–19. AHN: The AHN Netherlands,
http://www.ahn.nl/index.html, 2015.
Horton RE1940 approach towards physical interpretation of infiltration capacity. Proceedings of the Soil Science Society of America 5: 399-417.
Horton RE 1945 Erosional Development of streams and their drainage basins, Hydrophysical approach to quantitative morphology. Geological Society of American Bulletin 56: 275-370.
Melton MA 1958 Correlation structure of morphometric properties of drainage system and their controlling agents. Journal of Geology 66: 442-460.
Miller, V.C., 1953, “A quantitative geomorphic study of drainage basin characteristics in the Clinch Mountain area, Varginia and Tennessee”, Project NR 389042, Tech.
Rept.3., Columbia University, Department of Geology, ONR, Geography Branch, New York.
Makram, F. 1993 Hydrogeological and Hydrogeochemical Studies on Some Localities in South Eastern Desert, Egypt. Ph.D. Thesis, Faculty of Science, Suez Canal University, Egypt, 260 p.
Obi Reddy GP, Maji AK, Gajbhiye KS 2002 GIS for morphometric analysis of drainage basins. Geological Survey of India 11: 9-14.
Pakhmode V, Kulkarni H, Deolankar SB 2003 Hydrological drainage analysis in watershed Programmed planning, A case study from the
Deccan basalt, India.
Strahler AN 1950 Equilibrium theory of erosional slopes, approached by frequency distribution analysis. Am Jour Sci 248: 800-814.
Strahler AN 1957 Quantitative analysis of watershed geomorphology. American Geophysical Union Transactions 38: 912-920.
Strahler, A.N., 1957. “Quantitative analysis of watershed geomorphology”, Trans. Amer. Geophys. Union. 38.