I
d e n t i f i c a t i o n
a n d
A
n a l y s i s
OF
M u t a t i o n s i n t h e
T S C l
G e n e
Dharini Jeganathan
A Th e sis Su b m it t e d f o r t h e Deg r eeo f Do c t o r o f Ph il o s o p h y o f t h e Un iv er sity o f Lo n d o n
June 2000
MRC
Hu m a n Bio c h e m ic a l Ge n e t ic s Un it Th e Ga l t o n La b o r a t o r yDe p a r t m e n t o f Bio l o g y Un iv e r sit y Co l l e g e Lo n d o n
All rights reserved
INFORMATION TO ALL USERS
The quality of this reproduction is dependent upon the quality of the copy submitted.
In the unlikely event that the author did not send a complete manuscript and there are missing pages, these will be noted. Also, if material had to be removed,
a note will indicate the deletion.
uest.
ProQuest U642821
Published by ProQuest LLC(2016). Copyright of the Dissertation is held by the Author.
All rights reserved.
This work is protected against unauthorized copying under Title 17, United States Code. Microform Edition © ProQuest LLC.
ProQuest LLC
789 East Eisenhower Parkway P.O. Box 1346
Tuberous Sclerosis Complex (TSC) an autosomal dom inant disorder which may cause m any abnormalities including skin rashes, renal lesions, seizures, learning disability and behavioural problem s is caused by m utations in either of two genes TSC l or TSC2. This thesis focuses on the analysis of the recently cloned TSC l gene. M utation screening revealed that virtually all TSCl m utations are predicted to truncate the protein product. This provided a model system for the investigation of nonsense m ediated mRNA decay (NMD), an enigmatic surveillance mechanism that m ay offer the cell some protection against such "dom inant-negative" nonsense m utations. Analysis of lym phoblastoid cell lines in seven TSCl patients show ed a striking reduction of the m utant transcript com pared to the norm al transcript in five cases.
this approach as a diagnostic tool. Here, the discrim ination betw een alleles was less sensitive w ith RNA obtained directly from blood sam ples than from lym phoblastoid lines. It was also found that an alternative transcript lacking exon 5 of TSC l was a prom inent feature of RNA from fresh lymphocytes.
A further series of experiments on lymphoblastoid cell lines gave rise to three m ain findings of general interest. Firstly, the position of the m utation w ithin the gene could not be used to predict the extent of NMD. Secondly, patients w ith the same mutation, w hether or not know n to be related, appeared to have comparable levels of NMD implying that the variation in severity seen within the same family is unlikely to be the result of variation in NMD. Thirdly, exposure of the cells in culture to puromycin, a translational inhibitor, reduced the imbalance betw een 'norm al' and 'm u tan t' transcript. This suggested that NMD depends on translation or translational associated machinery, where its control m ay be determ ined directly by the m utation or by another factor yet to be identified.
I w ould like to thank Professor Sue Povey for giving me the opportunity to w ork in her laboratory and Professor David H opkinson for kindly w riting for a studentship for my PhD. I am extremely privileged to have been under the guidance of Sue who is a patient, enthusiastic, innovative supervisor that encourages her students tow ards independent thought. I am certain this will be the m ost valuable gift for m y scientific career.
I w ould like to extend my thanks to several people w ho have contributed to this thesis in their ow n way: M argaret (for the never-ending cell culture), Steve (for his unlim ited supply of jokes, which were almost always beyond me!), Mari- W yn (for advice on every aspect of life), Janet (for her brains!), Jonathan (for educating me about the skills of w riting a m anuscript), Claire (for her constant encouragem ent and endless cups of tea), Rosemary, Chris, M arina and Nalini (for their support along the way) and finally John for his superm an skills with the computer.
I w ould like to say a special thank you to Steve Jeremiah and Professor Matteo Adinolfi for kindly proof-reading this thesis.
Thank you to my fellow partners in crime Ed, Jamie, Yip, Dagan and H arry for being supportive peers and brightening my days!
Ab s t r a c t 2
Ac k n o w l e d g e m e n t s 4
De d i c a t i o n 5
Ta b l e o f c o n t e n t s 6
Ta b l e o f f ig u r e s 16
Ta b l e o ft a b l e s 20
Ab b r e v i a t io n s 23
Ch a p t e r o n e: in t r o d u c t io n_________________________________________ ^
1.1 Wh a t ist u b e r o u s s c l e r o s is Co m p l e x (t s c)? 29
1 .2 Cl in ic a l m a n i f e s t a t i o n s 30
1.2.1. A historical perspective 30
1.2.2. The current diagnostic criteria for TSC 31
1 .3 Ge n e t ic so ft s c 32
1 .4 Lin k a g e s t u d ie s 32
1 .5 Po s i t i o n a l c l o n i n g o ft h et s c g e n e s 34
1.5.1. Identification of TSC2 34
1.6 C h a r a c t e r i s a t i o n o f t h e t s c g e n e s 39
1.6.1. TSC2 39
1.6.2. TSCl 40
1.7 T h e p r o t e i n p r o d u c t s o f t h e t s c g e n e s 42
1.7.1. Tuberin - the TSC2 protein product 42
1.7.2. H am artin - the TSCl protein product 44
1.8 E x p r e s s io n o f t h e t s c g e n e s 45
1.8.1. Expression of Tuberin 45
1.8.2. Expression of H am artin 46
1.9 D o TUBERIN AND HAMARTIN PARTICIPATE IN THE SAME PATHWAY? 47
1.10 A n i m a l m o d e l s 48
1.10.1. Rat 48
1.10.2. Mice 51
1.10.3. Drosophila 53
1.11 D o THE TSC GENES FUNCTION AS TUMOUR SUPPRESSORS? 54
1.11.1. Knudson - two hit hypothesis 54
1.11.2. LOH studies in TSC 57
1.11.3. LOH in the TSC genes in sporadic tum ours 60
1.12 M u t a t i o n s c a n n i n g 63
1.12.1. W hat is m utation scanning? 63
1.12.2. Why is it im portant to screen an identified gene? 64
1.12.3. C urrent m utation scanning approaches 65
1.13 M u t a t i o n s c a n n i n g i n TSC2 71
1.13.1. Germline m utations in the TSC2 gene 71
1.13.2. Large rearrangem ents of TSC2 including contiguous
gene deletions involving PKD l 75
1.14 Loss OF FUNCTION MUTATIONS 77
1.15 C o n s e q u e n c e s o f a p r e m a t u r e t e r m i n a t i o n c o d o n ( p tc )
IN HUMAN DISEASE 78
1.15.1. Truncated polypeptide 78
1.15.2. Exon skipping 79
1.15.3. Nonsense m ediated mRNA decay (NMD) 82
1.15.3.1. C elegans 82
1.15.3.2. S. cerevisiae 83
1.15.3.3. H. sapiens 88
1.15.3.3.1. p-thalassemia 88
1.15.3.3.2. Marfans syndrom e (MFS) 89
1.16 F a c t o r s t h a t c o n t r i b u t e t o v a r i a b i l i t y i n c l i n i c a l s e v e r i t y 91
Ch a p t e r t w o: Ma t e r ia l s a n d Me t h o d s_____________________________ 95
2.1 M a t e r i a l s 96
2.1.1. Tuberous sclerosis patients and "'control" individuals 96 2.1.2. "Monochromosomal" somatic cell hybrid panel 96
2.2 C h e m i c a l s a n d r e a g e n t s 97
2.3 A p p a r a t u s 99
2.4 M e t h o d s 100
2.4.1. Cell culture 100
2.4.2. Bacterial culture 100
2.4.3. Plasmid DNA preparation 100
2.4.4. DNA extraction from cultured cells 101
2.4.5. Total RNA isolation from cultured cells 101
2.4.6. Total RNA extraction from blood 101
2.4.6.1. Collection of blood for RNA extraction 101
2.4.6.2. Extracting RNA from lymphocytes 101
2.4.7. Estimation of DNA concentration 102
2.4.8. Restriction digests 102
2.4.10. Polymerase Chain Reaction (PGR) 103
2.4.11. Reverse Transcription PGR (RT-PGR) 104
2.4.11.1. R T 1; Synthesis of first strand cDNA using RNA from
lymphoblastoid lines and fibroblasts 104
2.4.11.2. RT 2: Synthesis of first strand cDNA using RNA from
blood 105
2.4.11.3. Reverse-transcription (RT-PGR) prim ers and conditions 105
2.4.12. Agarose gel electrophoresis 106
2.4.13. 32p Oligolabelling 107
2.4.14. Southern blotting & hybridisation 107
2.4.14.1. Preparation of patient blots 107
2.4.14.2. Hybridisation 108
2.4.15. Single strand conformational polym orphism (SSGP) 109
2.4.16. Silver staining 109
2.4.17. Cycle sequencing using Thermo Sequenase w ith ^sp Terminators 110
2.4.17.1. Preparation of PGR product for sequencing 110
2.4.17.2. 33p Chain term ination sequencing 110
2.4.18. Quantification by Phosphoim aging 111
C h a p t e r t h r e e : A c o m p l e t e m u t a t i o n s c r e e n o f t h e
TSCl
g e n e in 79U N R E LA TED TU BERO US SCLEROSIS PA TIEN TS 113
3.1 T h e c o l l a b o r a t i o n t h a t i d e n t i f i e d TSCl 114
3 .2 O u r m u t a t i o n s c r e e n i n g s t r a t e g y i n TSCl 1 1 7
3.3 So u t h e r n b l o ta n a l y s is 118
3.4 PGR OF MONOCHROMOSOMAL HYBRID PANEL 121
3.5 S e q u e n c i n g o f e x o n 15 in c h r o m o s o m e 9 - l i n k e d p a t i e n t s 121
3.6 SSCP SCREENING 121
3 .7 He t e r o d u p l e xa n a l y s is (H A ) 1 2 7
3.8 Se q u e n c i n g t h e e n t ir e c o d i n g r e g io n i n t h e r e m a i n i n g 9 -l in k e d
PATIENTS 1 2 7
Ch a p t e r f o u r: Im p l ic a t io n s of s c r e e n in g i n t h e"pr o b l e m fa m il ie s"
132
4.1 P r o b l e m f a m i l y 5214 s o l v e d - A case of non-non penetrance 133
4.2 P r o b l e m f a m i l y 5528 s o l v e d - Ungual fibroma not diagnostic of TSC 136
4.3 A NEW PROBLEM FAMILY 5301 SOLVED - A case of somatic and germline
mosaicism 138
C h a p t e r fiv e : I d e n t i f i c a t i o n o f a l l e l i c i m b a l a n c e in
TSCl
p a t i e n t s141
5.1 RT-PCR a n a l y s i s o f TSCl m u t a t i o n s 142
5.2 A p p r o a c h u s e d f o r q u a n t i f y i n g t h e l e v e l s o f mRNA e x p r e s s i o n 147
5.2.1.Phosphorim age analysis 147
5.2.2.VaIidation of this semi-quantitative RT-PCR procedure 153
5.3 Q u a n t i f i c a t i o n o f l e v e l s o f mRNA e x p r e s s i o n i n TSCl l y m p h o i d l i n e s
AND FIBROBLASTS 157
C h a p t e r six: A p p l i c a t i o n o f
TSCl
a l l e l i c im b a l a n c e in t h eMOLECULAR DIAGNOSIS OF TUBEROUS SCLEROSIS_______________________ 1 ^
6.1 T h e d e v e l o p m e n t o f a d i a g n o s t i c a s s a y t o d i f f e r e n t i a t e TSCl
FROM TSC2PATIENTS 170
6.2 A DIAGNOSTIC ADAPTATION TO OVERCOME THE LIMITATIONS OF ALLELIC
IMBALANCE IN TSCl 182
6.3 U s e o f a l l e l i c i m b a l a n c e i n t h e w e s s e x p o p u l a t i o n p r e v a l e n c e s t u d y 184
Ch a p t e r s e v e n; In v e s t ig a t io n of f a c t o r s t h a t m a y in f l u e n c e the
LEVELS OF ALLELIC IMBALANCE IN
TSCl
PATIENTS 1937.1 T h e p o s i t i o n a n d n a t u r e o f TSClm u t a t i o n s 194
7.2 V a r i a t i o n i n s e v e r i t y o f TSCl a s s o c i a t e d d i s e a s e 196
Ch a p t e r e ig h t: Dis c u s s io n 199
8.1 G e r m l i n e m u t a t i o n s i n t h e TSCl g e n e 200
8.2 C o m p a r i s o n o f TSCl a n d TSC2m u t a t i o n s 206
8.3 I m p l i c a t i o n s f o r t h e m o l e c u l a r d i a g n o s i s o f t s c 208
8.5 No n s e n s e m e d i a t e d mR N A d e c a y u s e f u lt o t h e g e n e t ic is ta s w ella s t o
THE CELL? 214
8.5.1. How is it useful to the geneticist? 214
8.5.2. H ow is it useful to the cell? 220
8.6 Is NM D A NUCLEAR OR A CYTOPLASMIC EVENT? 221
8.7 C o m p a r i s o n o f y e a s t a n d m a m m a li a n NM D 225
8 .8 Ad d i t i o n a l c o m p l e x it ie so f N M D 225
8.6 A MODEL FOR MAMMALIAN NMD? 226
8.10 T h e s t o r y s o f a r i n TSC r e s e a r c h a n d a r e a s f o r f u t u r e s t u d y 229
8 .7 Co n c l u s i o n s f r o m t h is t h e s is 23 2
Ap p e n d i x I: Pr im e r s e q u e n c e s 2 34
TSC l genomic prim ers 235
TSC l cDNA prim ers 237
Ap p e n d i x II: De s c r ip t io n o fc o m m o n c l in ic a l m a n i f e s t a t i o n s o ft s c 239
Ap p e n d i x III: H G M P p r o g r a m c o m m a n d s 244
Bib l io g r a p g y 25 3
F i g u r e 1.1 Some major clinical features of TSC 33
F i g u r e 1.2 The TSCl region on chromosome 9 38
F i g u r e 1.3 The cDNA structures of TSCl and TSC2 41
F i g u r e 1.4 Knudson's two hit hypothesis 55 F i g u r e 1.5 Deletion mutations in TSC2 detected by dynamic molecular
combing 76
F i g u r e 1.6 The model proposed for NM D in yeast 87
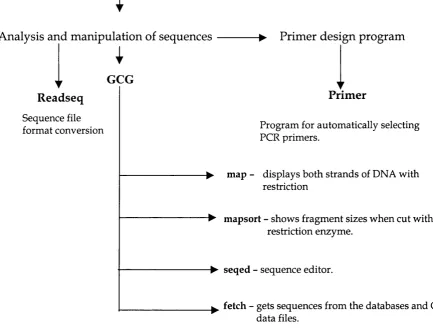
F i g u r e 2.1 Commonly used HGMP programs 112
F i g u r e 3.1 Southern blot analysis of TSC patients and CEFH individuals with
clone 255666 from SURF 6 116
F i g u r e 3.2 A restriction map of the TSCl coding region w ith probes used for
southern blot analysis 119
F i g u r e 3.3 Southern blot analysis of TSC patients probed w ith TSCl clones 120
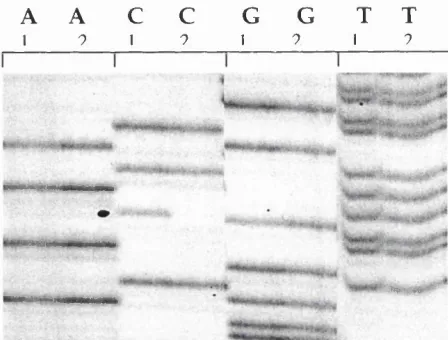
F i g u r e 3.4 SSCP analysis of exon 7 and exon 6 of TSCl 123 & 124
F i g u r e 3.5 Characterisation of mutation in exon 7 and exon 21 of TSCl 125
F i g u r e 3.6 Panel sequencing of exon 18 of TSCl in 9-linked patients 128
F i g u r e 3.7 Characterisation of polymorphisms in exon 10,16 and 23 of TSCl 128
F i g u r e 3.8 Distribution of mutations and polymorphisms across the TSCl gene
found in our screening panel 131
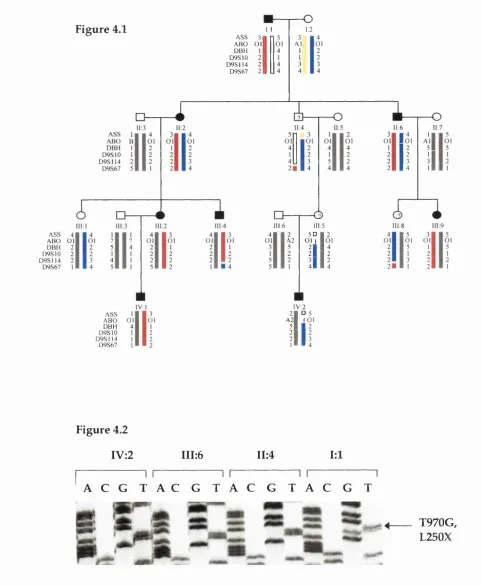
F i g u r e 4.1 Pedigree of family 5214 134
F i g u r e 4.2 Exclusion of a TSCl mutation (L250X) in the apparent non-penetrant
branch 134
F i g u r e 4.3 Pedigree of family 5528 137
F i g u r e 4.4 Characterisation of a TSCl mutation in fam ily 5528 137
F i g u r e 4.6 Characterisation of a TSCl mutation in fam ily 5301 139
F i g u r e 5.1 Identification of allelic imbalance in two TSCl mutations 143
F i g u r e 5.2 Location of primers for RT-PCR of TSCl mutations 145
F i g u r e 5.3 RT-PCR analysis of five TSCl mutations 146 F i g u r e 5.4a Steps involved in phosphoimageing 148
F i g u r e 5.4b Comparison of the imaging plate used in phosphoim ageing to
standard X-ray film autoradiography 148
F i g u r e 5.5 Quantification of bands upon phosphoim ageing 150
F i g u r e 5.6 A graph showing linear increase in PSI/mm^ value in relation to gel
exposure time 154
F i g u r e 5.7 Comparison of allelic imbalance in lymphoblastoid lines and
fibroblasts 158
F i g u r e 5.8 Levels of normal to mutant transcript in seven TSCl lym phoid lines
and two fibroblast samples 159
F i g u r e 5.9 Identification and characterisation of genetic variation in the
3' UTR of TSCl 161
F i g u r e 5.10 Location of primers for RT-PCR of TSCl polymorphic sites 164 F i g u r e 5.11 Normal variation in allelic imbalance in twelve heterozygous
controls 165
F i g u r e 5.12 RT-PCR analysis of TSCl polymorphic sites in TSCl patients and
controls 166
F i g u r e 5.13 Levels of allelic imbalance at the site of mutation compared to the
F i g u r e 6.1 RT-PCR analysis of the blind study cell lines at TSCl polymorphic
sites 174
F i g u r e 6.2 Analysis of three heterozygous sites w ithin the 3' UTR
polymorphism 4002insT in TSCl 180
F i g u r e 6.3 RT-PCR analysis of TSCl cell lines before and after treatment with
puromycin 183
F i g u r e 6.4 Levels of normal to mutant transcript in cells treated and untreated
w ith puromycin 183
F i g u r e 6.5 Identification of alternative splicing w ithin TSCl, in RNA extracted
from fresh lymphocytes 186
F i g u r e 6.6 Characterisation of the alternative splicing event in TSCl in RNA
from fresh lymphocytes 187
F i g u r e s 6.7 Levels of normal to mutant message in RNA from fresh
lymphocytes in members of family 5214 188
F i g u r e 6.8 RT-PCR analysis of patients from the Wessex study predicted to be
TSCl from the allelic imbalance assay 191
F i g u r e 7.1 Levels of NMD with various mutations across the TSCl gene 195
F i g u r e 7.2 Analysis of the variation in clinical severity with levels of allelic
imbalance in members of family 5 2 1 4 1 9 7
F i g u r e 7 .3 Analysis of the variation in clinical severity w ith levels of allelic
imbalance in members of family 5477 198
T a b l e 1.1 LOH at 9q34 and 16pl3.3 in TSC lesions 58
T a b l e 1.2 Markers used for LOH studies of 9q34 and 16pl3.3 59
T a b l e 1.3 Summary of current approaches in mutation detection 67
T a b l e 1.4 Mutation screening in the TSC2 gene 74
T a b l e 1.5 Factors that contribute to variability in clinical severity 91
T a b l e 3.1 Fragment sizes detected during southern blot analysis of the TSCl
gene 118
T a b l e 3.2 Summary of mutations detected by SSCP in the various classes of
TSC patients 122
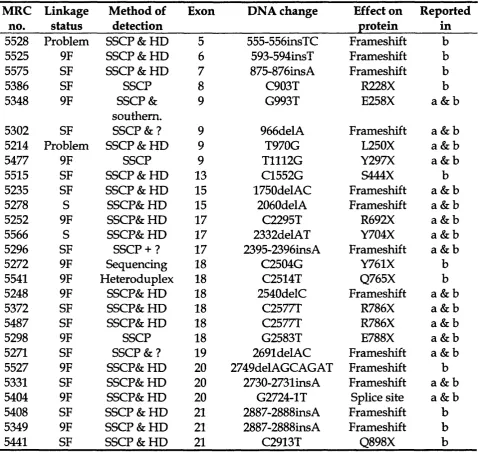
T a b l e 3.3 Mutations detected in TSCl in our panel of patients 129
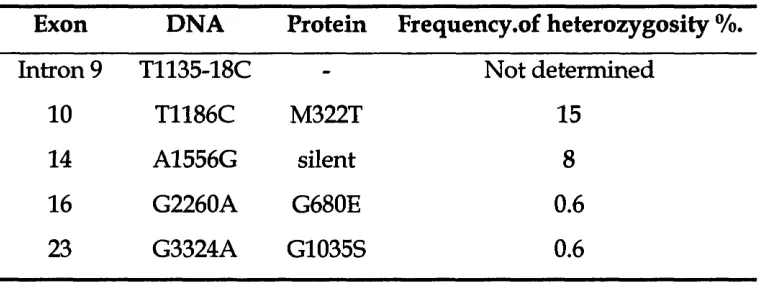
T a b l e 3.4 Polymorphisms detected in TSCl in our panel of patients 130
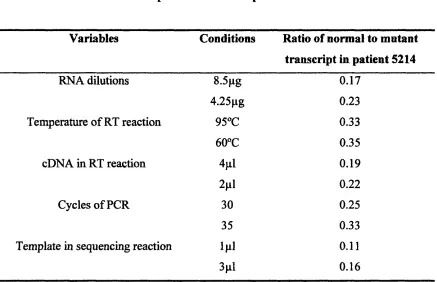
T a b l e 5.1 The effect of various factors on the ratio of normal to mutant
transcript in the same sample 156
T a b l e 5.2 Common TSCl polymorphisms used in this study 163
T a b l e 6.1 Summaries the typings of the blind study cell lines for common
TSCl polymorphisms 171
T a b l e 6.2 The typings in the TSCl screening panel for three common TSCl
polymorphisms (exon 10,14 and 22) 173
T a b l e 6.3 A blind study to differentiate TSCl from TSC2 patients based on
allelic imbalance at the TSCl locus 175
T a b l e 6.4 The effect of the number of cycles of PCR on the discrimination of
cell lines 177
T a b l e 6.5 Analysis of three heterozygous points in the 3' UTR polymorphism
T a b l e 6.6 The typings of ten lymphoid lines from the Wessex study for TSCl
polymorphisms used in the allelic imbalance assay 190
T a b l e 6.7 Predictions of the allelic imbalance assay on ten cell lines from the
Wessex study 192
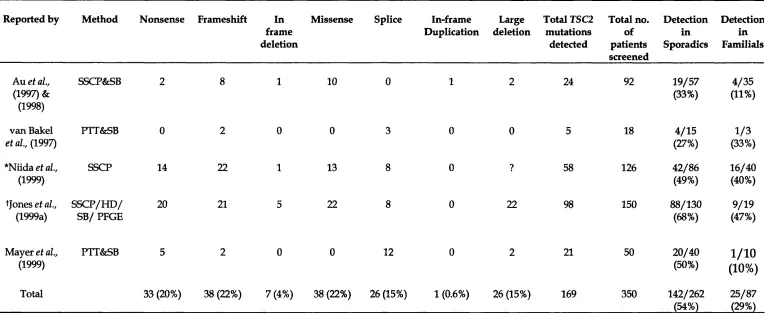
T a b l e 8.1 Summaries the mutation screening results of the TSCl gene from
various groups 201
T a b l e 8 .2 Proportion of protein truncating mutations in several genetic
3' UTR 3 prim e untranslated region
5' RACE 5' rapid amplification of cDNA ends 5' UTR 5 prim e untranslated region
AML angiomyolipoma
AFC adenom atous polyposis coli
APS am m onium persulphate
AT ataxia- telangiectasia
ATM ataxia- telangiectasia m utated
BAG bacterial artificial chromosome
BLAST basic local alignm ent search tool
Bp base pair
BRCAl breast cancer type 1
CCR Coriell Cell Repositories
CDK cyclin dependant kinases
cDNA complem entary DNA
CEPH Centre d' Etudes du Polymorphisme H um ain
CM centim organ
CT com puted tom ography
ddHzO deionised and distilled water
DEPC diethyl pyrocarbonate
DHPLC denaturing high performance liquid chrom atography
DM SO dim ethyl sulfoxide
DSE dow nstream sequence element
ECACC European collection of cell cultures eRF eukaryotic release factor
EST expressed sequence tag
F B N l fibrillin 1
FISH fluorescence in situ hybridisation FPGS folyl poly glutam ate synthetase
GAP GTPase activating protein
GITC guanidinium isothiocyanate
GRAIL gene recognition and analysis internet link
HA heteroduplex analysis
H G M D hum an gene m utation database H G M P hum an genome m apping project
HPRT hypoxanthine phosphoribosyl transferase
Ig imm unoglobin
IRE iron regulatory element
IRP iron regulatory protein
Kb kilobase pairs
LL09NCO1 flow sorted chromosome 9 cosmid library m ade at Lawrence Livermore National Laboratories
LOH loss of heterozygosity
MES Marfans syndrom e
MRI magnetic resonance imaging
m RNA m essenger RNA
N F l neurofibromatosis type 1
NM D nonsense m ediated mRNA decay
OM IM online M endelian inheritance in m an
ORF open reading frame
PAC p i artificial chromosome
PAGE polyacrylamide gel electrophoresis
PGR polymerase chain reaction
PFGE pulsed field gel electrophoresis
PTC prem ature term ination codon
PTT protein truncation test
R B I retinoblastom a type 1
RC renal carcinoma
RT-PCR reverse transcription polymerase chain reaction rTSC l rat tuberous sclerosis complex type 1
rTSC2 rat tuberous sclerosis complex type 2
SB Southern blot
SEGA Subependym al giant cell astrocytoma
SES splicing enhancer sequence
SNP single nucleotide polym orphism
SSCP single stranded conformation polym orphism analysis
TCR T-cell receptor
TEMED N N N 'N -tetram ethylethylenediam ide
TPI triosephosphate isomerase
TSC tuberous sclerosis complex
T scl m ouse tuberous sclerosis complex type 2
T SC l tuberous sclerosis complex type 1 (on chrom osome 9) Tsc2 m ouse tuberous sclerosis complex type 2
TSC2 tuberous sclerosis complex type 2 (on chrom osome 16)
U units
C
h a p t e r
o n e
1.1 Wh a t is Tu b e r o u s Sc l e r o s is Co m p l e x (TSC)?
Tuberous Sclerosis complex, formerly known as Epiloia or Boumeville disease (Boumeville DM. 1880) is an autosomal dominant disorder (Gunther and Penrose 1935) best known for its neurocutaneous manifestations. Benign tumours known as hamartomas occur in many organs of the body, including the skin, brain, eyes, heart, kidney, lung and liver (Gomez 1988). Complications include epilepsy (65%), intellectual disability (50%) and behavioural problems (40%). The phenotype is highly variable both between and within families. The frequency of the disease is estimated at > 1/10,000 live births (Obsome et ah, 7991), where 60-70% of cases are sporadic (i.e., no family history of the disease) and represent de novo mutations (Fleury et al, 7980; Sampson et al, 7989). Penetrance is very high and the only well documented case of apparent non penetrance (Webb and Osborne 1991) is now disproved (reported in this thesis and Osborne et ah, 2000). Two TSC-determining genes have been identified TSCl at 9q34 (van Slegtenhorst and The TSCl consortium., 1997) and TSC2 at 16pl3.3 ( The European Chromosome 16 Tuberous Sclerosis Consortium 1993).
1 .2 Cl in ic a l m a n i f e s t a t io n s
1.2.1. A historical perspective
In 1879, Désiré-M agloire Boumeville term ed this disorder "Tuberous sclerosis of the cerebral convolutions" based on post-m ortem exam ination of a patient w ith epilepsy and mental retardation. He recognised w hite nodular tum ours in the corpus striatum that protruded into the lateral ventricles, hence the term cerebral convolutions. The areas of sclerosis in such convolutions had a potato like consistency, hence the term tuberous. In 1908, Vogt defined TSC as a classical triad of mental retardation, fits and angiofibromas formerly adenom a sebaceum. These became the criteria that was used to diagnose TSC. However in 1914, Schuster found evidence that contradicted Vogt's triad of symptoms. He noticed a patient w ith only adenom a sebaceum and no m ental handicap. This was term ed forme fruste to mean "incomplete phenotype" or reduced expression of the TSC gene. It was only in 1932 that Critchley and Earl produced the first publication containing detailed clinical description of 29 patients w ith TSC, all inmates in a residential institution. Here, one patient had average m ental ability and three patients w ere thought not to have fits, once again contradicting Vogt's clinical Triad of symptoms. In addition, they discovered white spots also know n as hypomelanic macules in TSC patients {Tuberous Sclerosis Complex (1999); Tuberous Sclerosis Complex more than skin deep
1.2.2. The current diagnostic criteria for TSC
H am artom as occur in various forms in different organs (Gomez 1988). These are sum m arised in table 1 in the appendix, along w ith the age of onset. Individuals w ithin TSC families vary greatly for these manifestations. For example a parent who is mildly affected e.g. facial rash and macules may have children w ith seizures and mental retardation (Smalley et ah, 2994, N orthrup et ah, 2993).
Traditional diagnosis has been based on combinations of clinical, radiological and histopathological signs. However, non TSC patients also have certain features such as hypomelanic macules, shagreen patch and cardiac rhabdom yom as. To avoid mis-diagnosis, Gomez (1991) defined a hierarchy for diagnosing the manifestations. These criteria for diagnosis have been revised and have become more stringent than before (Roach et ah, 2999).
The boxes below show the present diagnostic criteria for TSC (Roach 1998).
MAJOR FEATURES MINOR FEATURES
• Facial Angiofibromas or forehead • Multiple pits in dental enamel.
fibrous plaque. • Hamartomatous rectal polyps.
• Nontraumatic ungual or periungual • Bone cysts.
fibroma. • Cerebral white matter radial migration
• Hypomelanotic macules (three or more). lines.
• Shagreen patch. • Gingival fibromas.
• Multiple retinal hamartomas. • Nonrenal hamartoma.
• Cortical tuber. • Rentinal achromie patch.
• Subependymal nodule. • “confetti” skin lesions.
• Subependymal giant cell astrocytoma. • Cardiac rhabdomyoma, single or
multiple.
• Lymphangiomyomatosis (LAM).
• Renal angiomyolipoma (Renal AMLs).
• D efinite TSC diagnosis requires - either tw o major features or one major feature plus two m inor features.
• Probable TSC diagnosis requires - One major plus one m inor feature.
• Possible TSC diagnosis requires - either one major feature or two or more m inor features.
• Recent (unpublished) recom mendations require two separate hamartom as in each individual (J. Osborne, personal communication). Figure 1.1 shows some of the major manifestations of TSC.
1.3 G e n e t i c s o f TSC
In 1935, G unther and Penrose recognised that tuberous sclerosis was inherited in an autosomal dom inant manner. Now, 60-70% of cases are thought to be new m utations, i.e. sporadic, where parents of an affected case are found to be unaffected on close examination (Sampson et al., 1989, Osborne et al, 1991). Estimates of prevalence have varied, where the frequency of tuberous sclerosis is estim ated at > 1/10,000 live births but may be as high as 1 in 5800 (Osborne et al, 1991). The recurrence risk is at least 2% due to germline mosaicism (Yates et
al, 1997).
1.4 L i n k a g e s t u d i e s
m
k
âk
adenylate kinase gene on 9q34 (lodscore 3.85 at 0 = 0.0). Connor et ah, (1987)
reported an informative polym orphism in the ABL oncogene, located close to the ABO gene in 9q34 (lodscore of 4.16 at 0 = 0.0). However, several groups found recombination with the ABL or ABO gene (N orthrup et ah, 1987, Povey et ah, 1988., Kandt et ah, 1989). Other investigators continued to test polymorphic
sites in 9q34 and dem onstrated a definite linkage of a TSC gene to 9q34, yet recognised that there m ust be more than one locus (Sampson et ah, 1989, Janssen et ah, 1990; Haines et ah, 1991; N orthrup et ah, 1992). Linkage was reported w ith loci on H q23 (Smith et ah, 1990) and 12q (Fahsold et ah, 1991). Kandt et ah, (1992) searched for linkage in five large families and found a high lod score (9.50) w ith a m arker on 16pl3.3 in the Polycystic Kidney disease gene. Povey et ah, (1994a) confirmed this, by showing that half the families studied linked to a locus between ASS and D9S298 on chromosome 9 (designated TSCl) and the other half to a locus close to D16S291 on chromosome 16 (designated TSC2), w ith no evidence of a third locus. Therefore, this established a definite
locus heterogeneity for TSC w ith loci m apping to telomeric chromosomal bands 16pl3.3 and 9q34.
1.5 P o s i t i o n a l c l o n i n g o f t h e TSC g e n e s
1.5.1. Identification of TSC2
(16AC2.5) on chromosome 16 (summarised by Kwiatkowski et al,, 1993). Patients w ith chromosome 16 a thalassem ia/m ental retardation (ATR- 16) syndrom e and no signs of TSC were found to have term inal deletions in 16pl3.3. Therefore this further refined this candidate region of TSC2 to the proximal 300kb. In an attem pt to find large scale deletions, pulsed field gel electrophoresis (PFGE) was carried out. This revealed constitutional interstitial deletions in this region in 5 TSC patients. This finding w as further reinforced by fluorescent in situ hybridisation (FISH). A final 120kb region was cloned in cosmids and four genes were found to be disrupted by all five PFGE deletions. On closer inspection, several intragenic m utations were also isolated in this gene. Therefore, this was indeed the chromosome 16 TSC determ ining gene - TSC2 (The European chromosome 16 TS consortium 1993). The finding that TSC2 was w ithin the well studied candidate region for polycystic kidney
disease (PKDl); enabled this to be one of the fastest positional cloning endeavours to date.
1.5.2. Identification of TSCl
program GRAIL 2 to identify possible exons (Xu et ah, 2994). An exon by exon m utation screen was started in order to identify the causative gene. Here, flanking intronic prim ers were designed for each exon and the amplification products were examined by heteroduplex analysis. The 62nd exon to be screened in this m anner show ed shifts in 10 out of the 60 samples. Sequencing these shifts revealed 9 m utations (7 frameshifts, 1 nonsense, and 1 missense change) and 1 polymorphism . Each m utation found segregated w ith affected individuals of the respective families. Therefore, it w as inescapable that TSCl had been identified (van Slegtenhorst et ah, 2997), ten years after genetic linkage to chromosome 9 was confirmed (1987). This, in contrast to TSC2, w as possibly one of the longest collaborative positional cloning endeavours to date.
Figure 1.2, taken from the TSCl cloning paper (van Slegtenhorst et al., 2997), shows the TSC l region on chromosome 9. The ideogram (top) represents a norm al G -banded m etaphase chromosome 9, w ith the TSC l region located at 9q34. The male genetic m ap (next line) shows selected anchor polym orphic loci m apped to 9q34. The detailed physical m ap of the candidate region (next level) shows:
a) The positions of polymorphic m arkers and key recom bination events in affected members (filled arrows) and unaffected m em bers (open arrows) of families showing linkage of TSC to 9q34
CIO
G Rl
SGC- SHGC- 31362 30551
I I
GR2
A006V03
I
B l l
S149 S2127
TSC I 9b9b
CEL RALGDS
S2126
SI 830 SI 199 S1198
Wl-18415
XPMC2H 3f 6 f
WI-16717
I
m u L
g
ABO m ■■!■■■Surf cluster
(M) M
ABO
kB2 E g , DMGDH
■ ■■ m
DBH
( Ml
VAV2 2cM
GR3 GR4
A006
S164 S2135SI 793 S150DBH S122 SIO
S66
D9S10 m stSG I8E 2608 A
HUMORFX
M
A6 S114
9qter
lOOkb
10 12 14 16 18 20 21 22
9^11 / 13' 15 ' 17 / 19 / \ / 23
III
m il
I I
TSCJ
lOkb9cen
F ig u r e 1.2 shows the TSCl region on 9q34
c) Genes previously m apped to the TSC l candidate region (blue boxes)
d) Novel cDNAs isolated from the region (red boxes)
d) ESTs m apped to the region (green)
e) Additional putative genes predicted by GRAIL analysis of genomic sequence (light blue boxes).
The map, of the TSCl gene (bottom) shows the 23 exons of the gene.
1.6 C h a r a c t e r i s a t i o n o f t h e TSC g e n e s
1.6.1. TSC2
al, 1995; M aheshwar et al, 1996).
1.6.2. TSC l
The cDNA sequence was established by the following stages. Firstly, a 4.5kb cDNA clone was isolated from screening a foetal brain cDNA library, w ith a cosmid 115B2 which m aps near D9S1199. This 4.5kb insert was found to be w ithin the 3'UTR of TSCl, Sequence analysis of this insert m atched a 6.8kb EST (Genbank D87683) derived from a cDNA clone called K1AA0243. This clone had been completely sequenced as part of an attem pt to provide full length cDNAs (Nagase et al, 1996). Several groups w ithin the TSC l consortium then perform ed RT-PCR and 5' RACE to obtain the upstream sequence of TSCl. This resulted in 8600bp of sequence w ith an open reading frame of 3492bp. Upon cloning the TSC l gene, the cosmid sequences were generated by the W hitehead Sequencing Center. Comparison of the genomic sequence to the cDNA sequence revealed the exon-intron structure of the gene. The gene consists of 23 exons w ith 2 leader (non-coding) exons. There is a major 8.6kb transcript with evidence of alternative splicing in exon 2. The major transcript is widely expressed in m ost tissues, with high levels in skeletal muscle. There is a large 4.5kb 3'untranslated region (van Slegtenhorst et al, 1997).
Figure 1.3, taken from Young and Povey, (1998), shows the cDNA structures of TSC2 and T SC l, w ith exons as rectangles (selected exons have been numbered).
Krnrar^tiitim n
l a . 1 —
10 20 30
RapGAP homology (Maheshwar et al, 1997)
ufficient to rescue Eker phenotype (Jin e ta l, 1996)
3 Ï
possible transmembrane domain and possible leucine zipper
(European Chrom osom e 16 Tuberous Sclerosis Consortium, 1993)
minimal region for rabaptin binding (Xiao e ta l, 1997)
T SC l
■ Predicted coiled coil region and possible transmembrane domain (The TSC1 consortium, 1997)
500
— I—
1000 2000
I___
3000 4000
___ I_ — ,---. 5000 5500 / / 860C'
F ig u r e 1.3 show s the cD N A structures o f TSCl and TSC2 Scale (bp)
1,7
T h e p r o t e i n p r o d u c t s o f t h e TSC g e n e s1.7.1. T uberin - the TSC2 protein product
The TSC2 gene encodes a 1784 amino acid protein, designated tuberin, with a predicted molecular mass of 198kd (excluding the alternatively spliced exon 31). Four of the identified hydrophobic dom ains m ay represent membrane spanning regions. In addition, four potential glycosylation sites were observed dow nstream of the last putative transm em brane domain. There is evidence for a leucine zipper motif, suggesting possible protein-protein interactions (Figure 1.3).
A search for homologies at the protein level show ed that tuberin is homologous to GTPase activating protein (GAP) - raplG A P also know n as GAP3 (The European chromosome 16 TS consortium 1993), and m urine Spal (Maheshwar et al, 1996). R aplG A P down-regulates the activity of the ras-related proteins
ra p la and ra p lb (Rubinfeld et al, 1991). Originally, 58 amino acids near the C term inus of tuberin show ed homology to part of the catalytic N-terminal dom ain of raplG A P. M aheshwar et al, (1997) suggested this homology spreads over a larger region of tuberin, consisting of approxim ately 160 amino acids encoded betw een exons 34 and 38 of the gene. This G ap-related domain is highly conserved in mouse, rat and pufferfish (Olsson et al, 1996; Kobayashi et al, 1995; M aheshwar et al, 1996).
mitogenesis (Altschuler and Ribeiro Neto 1998) and neuronal differentiation (York et al 1998). Wienecke et ah, (1996) reported the co-localisation of tuberin with ra p l in the golgi apparatus. Recently, Nellist et ah, (1999) contradicted these findings where no association was found betw een tuberin and the golgi complex. Rab5 is involved in early endosom al transport (Gorvel et ah, 1991). Wienecke et ah, (1995) also reported that tuberin deficient rat embryo fibroblasts have increased endocytosis, confirming negative regulation of tuberin, acting as Rab5-GAP in endocytosis. Nellist et ah, (1999) also contradicted findings of Xio et ah, (1997) regarding an association betw een tuberin and rabaptin. Double
label immunofluorescence and coim m unoprecipitation studies w ith TSC2 and rabaptin cDNAs revealed that despite similar colocalisation of both proteins to the cytoplasm, there was no evidence for a direct association betw een the proteins by coimmunoprecipitation. The lack of association betw een tuberin and rabaptin was further confirmed by yeast two hybrid studies (details unpublished, Nellist et ah, 1999).
There is m ounting evidence for the role of tuberin in cell cycle control (Soucek et ah, 1997). This study showed that in the absence of tuberin, cells become
induced and pass through the G l / S transition of the cell cycle w ithout entering a quiescent state. In addition, they also dem onstrated that in the absence of TSC2, cyclin dependant kinases (CDKs) come into effect, prom oting the re-entry
resulted in unstable p27 and appeared resistant (unlike TSC2 positive cells) to cell cycle inhibition caused by high ectopic p27 activity. Both the above findings were explained by the mislocalisation of nucleoprotein p27 into the cytoplasm upon loss of TSC2. Therefore, this study suggests a role for p27 in the pathogenesis of TS and provides further insight into cell cycle regulation upon loss of TSC2.
1.7.2. H am artin - the TSCl protein product
The protein product of TSC l, hamartin, has a predicted length of 1164 amino acids w ith a calculated mass of 130kd. The protein is hydrophilic and has 1 potential transm em brane dom ain w ith a probable coiled-coil region near the c- term inal end (Figure 1.3). At the time the gene was cloned database searches revealed a possible homology of TSCl in yeast Schizosaccharomyces pombe (S. pombe) but no strong matches with vertebrate proteins (van Slegtenhorst et al.,
1.8 Ex p r e s s io n of th e TSC g e n e s
1.8.1. Expression of Tuberin
1.8.2. Expression of H am artin
1.9. D o Tu b e r in a n d h a m a r t in p a r t ic ip a t e in t h e s a m e
PATHWAY?
In 1998, van Slegtenhorst et al., show ed evidence for an interaction between tuberin and ham artin in three independent ways. Firstly, yeast two hybrid experiments revealed an interaction betw een the predicted coiled coil dom ain in ham artin and a putative coiled coil dom ain in tuberin. Secondly, co transfection of ham artin and tuberin in m am m alian cells show ed that both proteins co-localised in the cytoplasm. Thirdly, ham artin and tuberin were show n to coim m unoprecipitate in HeLa cells and in a hum an fibroblast cell line, confirming that the association detected by the tw o-hybrid assay also occurs in vivo in m am m alian cells. Plank et ah, (1998) confirmed this in both hum an and rat kidney derived cell lines. These results suggest that tuberin and ham artin m ust function in the same pathw ay in accordance w ith the clinical similarity betw een TSC l and TSC2 associated disease. However, Plank et ah, (1998) have show n that the stability of ham artin is not dependent on its interaction with tuberin. This was illustrated by detecting ham artin in the Eker rat tum our cell line ERC18M that lacks functional tuberin, i.e. a cell line that lacks approxim ately 30% of TSC2 including GAP domain. How ever, the stability of ham artin may be due to the retained part of TSC2 in this cell line containing the N term inal coiled coil dom ain know n to interact w ith ham artin.
(consistent with original studies by van Slegtenhorst et al., 1998) with possible additional components through a variety of biochemical approaches. Gel filtration studies indicated that this complex was > 450KD. Also ultracentrifugation profiles of cells expressing ham artin w ith and w ithout tuberin were show n to be different. This difference w as attributable to the oligomerisation of the coiled coil dom ain of ham artin in the absence of tuberin (i.e. self-aggregation of ham artin caused by intermolecular homomeric binding of the coiled coil dom ain in the absence of tuberin). Therefore tuberin was proposed to act as a chaperone for hamartin. Support for this idea was gained by findings that the "tuberin and ham artin" complex w as form ed very soon after protein synthesis of the two proteins (Nellist et al, 1999). Findings that the two proteins bind each other has explained that inactivation of either gene causes disruption of this complex (whos function rem ains unknow n) leading to the same disease.
1.10 A n im al m od els
1.10.1. Rat
10ql2 by linkage studies (Yeung et al., 1993 and Hino et al, 1993). W hen TSC2 was cloned in 1993, the connection was m ade that the Eker rat shared many phenotypic similiarities to w hat could be the rat hom ologue of hum an TSC2. This rTsc2 locus on chromosome 10ql2 was syntenic to hum an chromosome 16pl3.3 - locus of hum an TSC2. Kobayashi et al., (1995) reported four other tum ours in the Eker rat - pituitary, spleen, uterine and some extra renal tum ours. They had also identified a germline m utation (insertion of approxim ately 5 kilobases) in the rat homologue of TSC2. Further analysis by Xiao et al, (1995) showed the Eker RC m utation to be an inserted retrotransposon in intron 30 of the yTSC2 gene. Hence, this was a naturally
occurring animal model for TSC2 associated disease. A berrant TSC2 transcripts were identified in both the non tum our and tum our tissues of the Eker rat (Kobayashi et al., 1995; Yeung et al., 1994). Transcription of the m utant allele generates transcripts that lack the homologous R aplG A P dom ain of TSC2, resulting in a functionally null m utation. If a foetus carries both a germline and somatic hit on the rTSC2, it cannot survive (Hino et al, 1993). This homozygous lethality of the Eker rat was show n to be rescued by the introduction of a wild type rTsc2 gene, which suppressed the developm ent of renal tum ours (which is the m ost consistent of the phenotypes) (Kobayashi et al, 1997). Further m anifestations were reported by Yeung et al, (1997), w ho noticed subependym al and subcortical hamartomas.
tumorigenicity of Eker tum our lines in severe combined im m une deficiency (SCID) mice (Orimoto et al, 1996 and Jin et al, 1996). Jin et al, (1996) also show ed that overexpression of the wild type y T s c 2 reduced the grow th rate of
norm al R ati fibroblasts. In addition, this group show ed that constructs expressing only the-COOH terminal of rat tuberin including the GAP-related domain, displayed similar but less m arked properties. These studies confirmed the tum our suppressor functions of rTsc2.
Satake et al., (1999) have now cloned the rat hom ologue of TSC l, located on rat chromosome 3. A combination of RT-PCR analysis and library screens was undertaken to isolate cosmid and phage clones to generate the full length rTscl cDNA sequence. The exon -intron structure of rTscl is highly conserved to that of hum an TSCl. N orthern blot analysis revealed that the rTscl mRNA is approxim ately 8kb (similar to the hum an counterpart) and followed a similar expression pattern to the hum an TSCl mRNA. The rTscl protein (hamartin) is 86% identical to the hum an counterpart, where the predicted coiled coil region is well conserved betw een both species. In addition the 5' untranslated region of both species is 84.5% similar. Sequencing of the 3' untranslated region of rTscl is incomplete but the sequence generated so far indicates a large 3'
frequency of rTscl m utations than rTscl in chemically induced RCs (P < 0.05) (Satake et al, 1999).
1.10.2. Mice
Recently two groups independently described Tscl knockout mice using gene targetting approaches (Kobayashi et al, 1999, O nda et al, 1999). Both targetting events were novel and were predicted to produce a inactivating TSC2 allele. Tscl- / (null) mice die at embryonic stages (E 9.5-12.5) (Kobayashi et al, 1999, O nda et al, 1999). In comparison with Tsc2-/+ and Tscl'^/'^, these mice showed non closure of the neural tube in the head region (about 50% of mice) and anomalies of the m yocardium in the later stage of developm ent (E ll.5-12.5) (Kobayashi et al, 1999). Similar findings were observed w ith O nda et al, (1999) but the m ost striking observation and the prim ary cause of death in these mice was show n to be due to hepatic hypoplasia upon histologic analysis. This suggested a previously unsuspected role for tuberin in liver function (Onda et al, 1999).
T scl'/'^ mice develop a diverse set of neoplastic growths which consist of 100%
histologically renal carcinomas were found to resemble those observed in the Eker rat (Kobayashi et ah, 1999). The high % of hepatic hem angiom as seen in the mice was not seen in the Eker rat, where such lesions were sometimes seen in the spleen or uterus of the Eker rat. Conversely, pituitary adenom as and cerebral ham artom as often seen in the Eker rat were not observed in the mice.
At the molecular level, LOH was seen in 30% of tum ours and cysts from the Tsc2'/^ mice, indicating that inactivation of the second allele does occur (Onda
ei al, 1999).
Interestingly, the actin-binding protein gelsolin which is w idely expressed in m any different cell types including interstitial cells of the kidney, is overexpressed in renal cystadenomas and carcinomas. Therefore this provides a sensitive m arker for early detection of these lesions (Onda et al, 1999).
To analyse potential strain specific modifier alleles of the Tsc2-/+ phenotype, the Tsc2- allele was bred w ith outbred Black swiss mice (Onda et al, 1999). At the
1.10.3. Drosophila
Ito and Rubin, (1999) conducted a genetic screen to identify new lethal m utations that affect adult eye structure in drosphila. The screen generated a group of m utations that produce enlarged cells in hom ozygous m utant clones. The m ap location, phenotype and cytological location of these mutations all coincided w ith a previously described m utant called gigas. Therefore these m utations were considered alleles of gigas. Protein database searches with the gigas protein indicated that this was indeed the drosophila TSC2 homologue.
Sequence alignm ent show ed a high degree of conservation w ith hum an and m ouse TSC2 proteins. Gigas has 26% identity w ith the hum an TSC2 protein. How ever the highest level sequence homology (53%) was w ith the RAPIGAP domain.
The identification of the TSC2 homologue in drosophila prom pted the above group to identify the TSCl homologue. In doing so, they found by database searches a drosophila EST that m apped to GSE4-5 by in situ hybridisation to polytene chromosomes. The drosophila TSC l ORE is 22% homologous to the hum an TSC l protein w ith significant similarity to the N-term inal sequence of hum an TSC l. The coiled coil dom ain and transm em brane dom ains are both in conserved positions in both species supporting the identification of the gene as the drosophila homologue of TSCl.
1.11 D o THE TSC GENES FUNCTION AS TUMOUR SUPPRESSORS?
1.11.1. Knudson - two hit hypothesis
hit
r hit
Mutation Mutation
Normal somatic cell.
Single somatic cell of a sporadic case and all somatic cells of familial case.
Tumour
Founder cell of tumour
F i g u r e 1.4 explains Knudson's two hit hypothesis whereby a familial case
harbours a germline mutation (1st hit) and requires a somatic (2nd hit) in the
same cell to lead to uncontrollable growth and tumour formation where as a
sporadic case requires two independent hits in the same cell to reach this
state.
Cavenee et al, (1983) provided the first direct support for the Knudson two-hit hypothesis. Surgical tumour samples from retinoblastoma patients were analysed for a series of markers on chromosome 13. This experiment was repeated on blood samples from the same patients. In several cases, markers that were heterozygous on typings from blood were apparently homozygous in the tum our cells. Cavenee explained that this apparent "loss of heterozygosity" or LOH in the tumours was characteristic of the Knudson two-hit hypothesis, resulting from the loss of the normal copy of the tumour suppressor gene. By cytogenetic analysis, Cavenee et al, suggested a number of mechanisms for the loss of the normal copy. This included:
(i) The loss of a whole chromosome by mitotic non-disjunction.
(iii) Following (ii), segregation of both RBI-bearing chromosomes into one daughter cell,
(iv) Deletion of the wild type allele.
(v) Pathogenic point m utation of the w ild type allele.
Like the RBI gene, the TSC genes are dom inant at the inheritance level. However, at the cellular level, the gene can be regarded as recessive (in accordance w ith it being a tum our suppressor) requiring hits on both alleles. Here, the second hit (somatic hit) on the rem aining norm al allele m ust occur at a very high frequency so that anyone carrying the germline hit will not escape the disease.
Studies to dem onstrate LOH in the past have used enzymatic polymorphisms, cytogenetic abnormalities, restriction fragm ent length polymorphic (RFLP) m arkers and microsatellite m arkers (Haber and H arlow 1997). Currently, com parative genome hybridisation (CGH) may allow less laborious screening for large scale deletions (Kallioniemi et al., 1991). If the same principle were applied to DNA microarrays then small deletions could also be resolved (Pinkel et al., 1998). LOH studies using markers spaced across a region of the genome
have helped refine candidate locations for m any tum our suppressor genes, these include m ultiple endocrine neoplasia type 1 (MENl), breast cancer (BRCAl) and Wilms' tum our gene (WTl).
W hen some tum ours advance they undergo further genetic changes, so that several regions undergo LOH. This m ay be resolved by examining a large set of tum ours to separate out the spurious results. Another aspect that m ay prejudice results is contamination from stromal (non-tumour) tissue. Here, LOH may appear as a decreased relative intensity instead of complete loss of the band from one allele. Amplification from stromal tissue m ay also occur when m arkers are hom ozygously deleted in the tum our, leading to a misleading result (Strachan and Read 1999).
1.11.2. LOH studies in TSC
TSC genes in this complex process is undeterm ined.
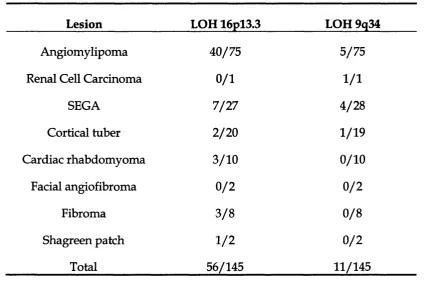
LOH has been observed in several TSC lesions including angiomylipomas, subendym al giant cell astrocytoma (SEGA), cortical tubers, renal cell carcinomas, cardiac rhabdom yom as and ungual fibromas (Sepp et al, 1996; Henske et al, 1996). In the study by Henske et al, (1996), LOH was found more frequently in kidney lesions - angiomylipomas (28/49) and cardiac rhabdom yom as (2/6) than cortical tubers (0/14) or SEC As (1/11). This may suggest a different m utation spectrum of second hits or an alternative m ode of tum ourogenesis in the central nervous system.
None of the patients in the study by Henske et al, (1996) w ere members of TSC pedigrees for which clear linkage to either loci had been dem onstrated. Here, they show ed that in a series of 53 AMLs, 57% show ed LOH at 16pl3.3 and 8% show ed LOH at 9q34. Therefore LOH was seen less frequently at TSCl com pared to TSC2 (P < 0.001). Smaller studies by other groups also found a lack of LOH (10%) w ith 9q34 associated ham artom as com pared to 16pl3.3 ham artom as (Sepp et al, 1996, Carbonara et al, 1996).
Table 1.1 shows the combined results of the LOH studies in different TSC
lesions by Sepp et a l, (1996), Carbonara et a l, (1996) and Henske et a l, (1996).
status. In Henske et al., (1996), 87 lesions were studied from 47 TSC patients
with unknown linkage status.
Lesion LOH 16pl3.3 LOH 9q34
Angiomylipoma 40/75 5/75
Renal Cell Carcinoma 0/1 1 /1
SEGA 7/27 4/28
Cortical tuber 2/20 1/19
Cardiac rhabdomyoma 3/10 0/10
Facial angiofibroma 0 /2 0 /2
Fibroma 3 /8 0 /8
Shagreen patch 1 /2 0 /2
Total 56/145 11/145
Table 1.2 below summaries the markers used in each study
Study Markers studied for LOH at both loci
Sepp et al, (1996) ASS, D9S64, D9S149, D9S122, D9S298, D9S114, D9S67 (TSCl) and D16S29, D16S665, KGS, EcoRV polymorphism in exon 40, D16S525, D16S309, D16S85, HBAPl {TSC2).
Carbonara et al, (1996) ASS, D9S125, D9S149, D9S150, D9S122, D9S66, D9S114, D9S67, D9S158 {TSCl)
and HBAPl, D16S525, D16S521, KG8, D16S291, D16S663, D16S283, D16S423, D16S407, D16S403, D16S401, D16S420, D16S296, D16S297, D16S299, D16S298, SPN, D16S409, D16S285 and D16S416 (TSC2).
The lack of LOH w ith TSC l associated ham artom as m ay be due to two possibilities. Firstly, the second (somatic) m utation in the T SC l gene could be a small deletion or point mutation, reflecting a different m ode of pathology betw een the two genes. Secondly, TSC2 associated disease m ay indeed be more prevalent in the general population than TSC l. In addition, the increased frequency of LOH with 16pl3.3 AMLs com pared to 9q34 AMLs m ay suggest that these ham artom as are more frequent in TSC2 related disease (Tuberous sclerosis complex, 1999).
LOH in tuberous sclerosis lesions has several implications. It suggests that m utations in TSC l and TSC2 genes result from a "loss of function". In addition it is plausible that the variability in severity in different patients could be related to the time and place of the second hits, rather than a genetic factor such as the exact nature of the germline m utation (Young and Povey 1998).
1.11.3. LOH in the TSC genes in sporadic tumours
It has been show n that TSC genes are involved in isolated sporadic tum ours that occur w ith no other signs of TSC. Henske et al, (1995), reported LOH in TSC2 from 3 out of 29 angiomylipomas tested from patients w ith no other signs
cancer. LOH has also been reported in TSC l and TSC2 associated regions in patients w ith lung adenocarcinomas especially w hen accompanied by m ultiple atypical adenom ous hyperplasia (AAH) (Suzuki et al., 1998), indicating that TSC l and TSC2 could also be implicated in these tum ours. In contrast. Wolf et
al, (1997), reported a lack of LOH in cortical tubers in 11 epileptic patients that
were histologically indistinguishable from tuberous sclerosis brain lesions. The absence of LOH in these lesions could be due to small somatic m utations in the TSC genes that were undetectable through LOH studies. These findings suggest that, despite the histopathological similarity of epilepsy associated lesions to cortical tubers, the former lesions are not related to TS. Interestingly, Henske et al, (1996), did show that LOH appear less frequently w ith brain lesions as opposed to kidney and heart lesions in TSC. Therefore, this m ay be further support for an alternative mechanism of pathogensis in brain associated lesions.
1.11.4. T uberin and H am artin expression in the TSC tum ours
Tuberin w as detected through im m unostaining in cortical tubers (Kerfoot et al, 1996), SEGAs (Mizuguchi et al, 1997; Henske et al, 1997) and angiomylipomas
1 .1 2 Mu t a t io n Sc a n n in g
1.12.1. W hat is m utation scanning?
For the purposes of this section, the term m utation can be defined as an alteration in the DNA sequence w ith a pathological consequence. The concept of m utation scanning can be divided into three m ain categories:
(i) To identify a gene causing disease.
(ii) To identify new m utations in a gene already know n to cause the disease.
(iii) To identify established m utations in a gene know n to cause the disease.
The first stage is usually to amplify either the genomic region i.e., the DNA, if the exon-intron boundaries are known; or the cDNA generated by RT-PCR from the mRNA of the patients. Then, using one or several m ethods described in Table 1.3, one could scan for mutations. Any variants detected are characterised by sequencing. Changes that result in a prem ature term ination codon (i.e. nonsense or frameshift m utations that are predicted to truncated the protein product), give conclusive evidence that the disease causing m utation has been identified. Missense m utations are less indicative, as these could possibly be rare non-pathogenic sequence variant present in the general population.
1.12.2. Why is it important to screen an identified gene?
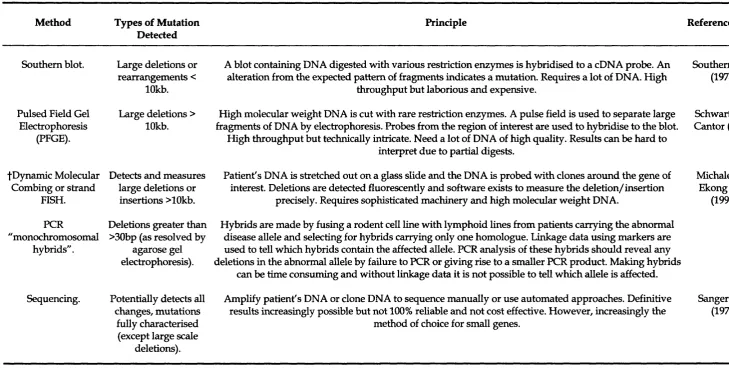
1.12.3. Current mutation scanning approaches
Table 1.3 sum m aries the current approaches used for m utation detection. In considering which approach to use, one m ust account for the sensitivity, expense, level of skill, time and extent of labour required for each method. Ultimately, an appropriate compromise between these factors m ust be reached. Diagnostic laboratories are still seeking a quick, cheap and reliable m ethod for routine use. Presently, no technique offers 100% sensitivity, therefore, it is custom ary to screen a gene for an unknow n m utation w ith m ore than one method.
The strategy used for m utation scanning will depend greatly on each individual circumstance. Some of the main considerations are outlined below:
(i) In screening a candidate gene for a disease, a large num ber of unrelated patients and controls m ust be tested (as m entioned previously).
(ii) An identified gene w ith different kinds of m utations m ay require a combination of approaches to pick u p large as well as small mutations. However, if the m utations are all similar e.g. small protein truncating changes, an approach such as the protein truncation test (PTT) may be the m ost suited.
(iv) The size of the gene, i.e. an expensive approach such as denaturing high performance liquid chrom atography (DHPLC) m ay not be cost effective in screening a small gene.