Comparative Analysis of PCA, DCT & DWT based Image
Fusion Techniques
B.Shoba Rani
Associate Professor Dept Of Ece Chaitanya Institute Of Technology &
Science
Abstract-
I
mage fusion is the process of combining relevant information from two or more images into a single image. The resulting image will be more informative than any of the input images. The object of image fusion is to retain the most desirable characteristics of each image. This paper discusses about the Formulation, Process Flow Diagrams and algorithms of PCA (principal Component Analysis), DCT (Discrete Cosine Transform) and DWT (Discrete Wavelet Transform) based image fusion techniques. The results are also furnished in picture and table format for comparative analysis of above techniques. This paper presents the three different image fusion techniques and there comparative analysis, as the conventional fusion techniques PCA and DCT has some drawbacks .The comparative study concludes that DWT is the best approach for image fusion. In this paper DWT based two algorithms are proposed, these are maximum pixel replacement and pixel averaging approach.Keywords-image fusion; principal component analysis; discrete cosine transform; discrete wavelet transform.
1. INTRODUCTION
Image fusion is a useful technique for merging single sensor and multi-sensor images to enhance the information. The objective of image fusion is to combine information from multiple images in order to
produce an image that deliver only the useful information. Any piece of information makes sense only when it is able to convey the content across. The c1arity of information is important. By the process of image fusion the good information from each of the given images is fused together to form a resultant image whose quality is superior to any of the input images This is achieved by applying a sequence of operations applied on the images that would make the good information in each of the image prominent. The fused image is constructed by combining magnified information from the input images
2. PRINCIPAL COMPONENT ANALYSIS It is a mathematical tool from applied linear algebra .It is a simple non-parametric method of extracting relevant information from confusing data sets. PCA is a useful statistical technique that has found application in fields such as face recognition and image compression, and is a common technique for finding patterns in data of high dimension.
The origins of PCA lie in multivariate data analysis, it has a wide range of other applications PCA has been called, ’one of the most important results from applied linear algebra and perhaps its most common use is as the first step in trying to analyses large data sets. In general terms, PCA uses a vector space transform to reduce the dimensionality of large data sets. Using mathematical projection, the original data set, which may have involved many variables, can often be interpreted in just a few variables (the principal components).
Formulation
Let us consider X be a d-dimensional random vector and assume it to have zero empirical mean. The orthonormal projection matrix V would be such that Y=VTX with the following constraints.
The covariance of Y, i.e., cov(Y) is a diagonal and inverse of V is equivalent to its transpose (V-1=VT). Using Matrix Algebra,
cov(Y) = E{YYT} (1)
cov(Y)= E{(XVT)(VTX)T} (2)
cov(Y)=E{(XVT)(VXT)} (3)
cov(Y)=VTconv(X)V (4)
Multiplying both sides of equation (4) by V, we get,
Vocv(Y)=VVT conv(X)V=conv(X)V (5)
Substituting equation (4) into the equation (5) gives, [ 1 V1,2 V2……….,dVd]
= [ conv(X)V1,Cov(X)V2,cov(X)Vd] (6)
This could be rewritten asb
PROCES FLOW DIAGRAM OF PCA
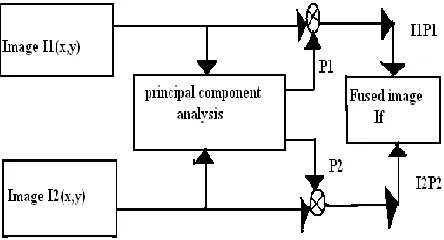
The process flow diagram of PCA algorithm is shown in below figure 1. The input images I1(x, y) and I2(x, y) are arranged in two column vectors and their empirical means are subtracted. The resulting vector has a dimension of n x 2, where n is length of the each image vector.
Compute the eigenvector and eigenvalues for this resulting vector are computed and the eigenvectors corresponding to the larger eigenvalue obtained.
Figure 1. Image Fusion Process using PCA
The normalized components PI and P2 are computed from the obtained eigenvector. The fused image is given by equation,
If(x,y)=P1I1(x,y)+P2I2(x,y) (8)
PCA ALGORITHM
Let the source images be arranged in two-column vectors. The steps followed to project this data into 2-D subspaces are: 1.From the input images matrices arrange the data into column vectors. The resulting matrix Z is of dimension 2xn. 2.Then Compute the empirical mean along each column. The empirical mean vector Me has a dimension of 1 x 2. 3. Subtracting the empirical mean vector Me from each column of the data matrix S. The resulting matrix X is of dimension 2 x n.
4.Find the covariance matrix C of X i.e. C=XXT mean of expectation = cov(X)
5. Compute the eigenvectors V and eigenvalue D of C and sort them by decreasing eigenvalue. Both V and D are of dimension 2 x 2.
6.Finally consider the first column of V which corresponds to larger eigenvalue to compute PI and P2 as,
P
1
v(1)
v
and P
2
v(2)
v
3. DISCRETE COSINE TRANSFORM
The digital images are displaying on a screen immediately after they are captured. There are two represent types for digital image that is spatial domain or frequency domain. Spatial domain image can be realizes through our human eyes, but frequency domain use to analysis of spatial domain A Discrete Cosine Transform (DCT) is an important transform in image processing. It is always used to express a sequence of finite data points in terms of a sum of cosine functions oscillating at different frequencies. Large DCT coefficients are concentrated in the low frequency region; hence, it is known to have excellent energy compactness properties. Discrete Cosine Transformation (DCT) are important to numerous applications in science, engineering and in images compress, like MPGE, JVT, etc
Formulation of DCT
Where Kl & K2 are discrete frequency variables.
Similarly, the 2D inverse discrete cosine transform is defined as
Where α(k1) & α(k2) are same as equation (11) & (12).
Process flow graph of DCT
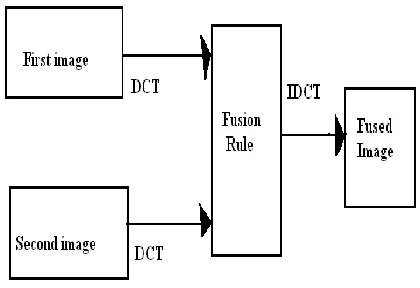
Figure 2.process flow graph of DCT
In DCT the Images to be fused are divided into non-overlapping blocks of size NxN as shown in above Fig-2.
For each block DCT coefficients are computed and fusion rules are applied to get fused DCT coefficients. Then apply the IDCT on the fused coefficients to produce the fused image/block.
The following only two fusion rule is used for image fusion process. They are the simple averaging method and by using equation method as in eq (15).
Let the X1 be the DCT coefficients of image block from image 1 and similarly let X2 be the DCT coefficients of image block from image 2. Assume the image block is of size N x N and X be the fused DCT coefficients. Here, all DCT coefficients from both image blocks are averaged to get fused DCT coefficients. It is very simple and basic image fusion technique in DCT domain
Where k1,k2 =0,1,2……,N-1
4. DISCRETE WAVELET TRANSFORM
HH1 have more detail
Information more than frequency domain LL1.
Figure 3.Frequency distribution of DWT
Process Flow Diagram of DWT
Wavelet transform is first performed on each source images to generate a fusion decision map based on a set of fusion rules. The fused wavelet coefficient map can be constructed from the wavelet coefficients of the source images according to the fusion decision map. Finally the fused image is obtained by performing the inverse wavelet transform
Figure 4.Processof image fusion using DWT
The fusion rules play a very important role during the fusion process.
1.Implement the DWT on both the input images to create lower decomposition wavelets. 2.By using different fusion rules fuse each decomposition levels.
3.Apply IDWT on fused decomposition levels, to reconstruct the original image that is fused image.
DWT Decomposition
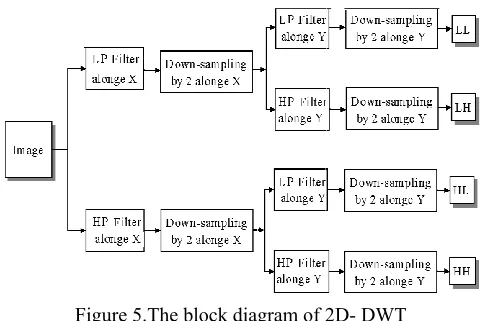
Figure 5.The block diagram of 2D- DWT
cascade of special low pass and high-pass filters and a sub-sampling operation. The outputs from 2D-DWT are four images having size equal to half the size of the original image. So from first input image we will get HHa, HLa, LHa, LLa images and from second input image we will get HHb, HLb, LHb, LLb images. LH means that low-pass filter is applied along x and followed by high pass filter along y. The LL image contains the approximation coefficients. LH image contains the horizontal detail coefficients. HL image contains the vertical detail coefficients, HH contains the diagonal detail coefficients. The wavelet transform can be performed for multiple levels. The next level of decomposition is performed using only the LL image. The result is four sub-images each of size equal to half the LL image size.
Algorithms
The algorithm of image fusion using DWT has following common steps applicable to proposed methods of fusion. a)Accept the two input images.
b)Resize both the images to 256 x 256. c)Convert to Gray scale image. d)Convert to double precision format.
e)Take Discrete Wavelet Transform of both the images.
f)Let for first image OUT bands be HHa, HLa, LHa, LLa and for second image be HHb, HLb, LHb, LLb.
4.3. 1. Image fusion using Maximum Pixel replacement
1) Take the pixel having the maximum value of the two bands i.e. HHa and HHb, and put in HHn. 2)Take the pixel having the maximum value of the two bands i.e. HLa and HLb, and put in HLn. 3)Take the pixel having the maximum value of the two bands i.e. LHa and LHb, and put in LHn. 4)Take the pixel having the maximum value of the two bands i.e. LLa and LLb, and put in LLn. 5)Thus we will get HHn,HLn,LHn and LLn as new coefficients.
6)Take Inverse Discrete Wavelet Transform. 7)Obtain the fused Image and Display.
4.3.2. Image Fusion using Pixels Averaging
8)Take the average of pixels of the two bands i.e. HHa and HHb, and put in HHn . 9)Take the average of pixels of the two bands i.e. HLa and HLb, and put in HLn. 10)Take the average of pixels of the two bands i.e. LHa and LHb, and put in LHn. 11)Take the average of pixels of the two bands i.e. LLa and LLb, and put in LLn. 12)Thus we will get HHn,HLn,LHn and LLn as new coefficients.
13)Take Inverse Discrete Wavelet Transform. 14)Obtain the fused Image and Display.
5. QUALITY MEASURES
Mean Square Error
Peak Signal to Noise Ratio
Average Difference
Normalized Cross Correlation
Maximum Difference
Normalized Absolute Error
6. RESULTS
Following images are results of fusion process with PCA, DCT & DWT fusion technique.
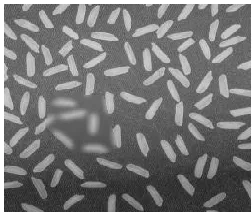
Figure (6a).First input image Figure (6b).Second input image Figure (6c).Fused image using PCA
Figure (6d).Fused image using Figure (6e).Fused image using DCT Figure (6f).Fused image using
Figure (6g).Fused image using pixel averaging
Following Table demonstrates the various quality measures for different image fusion techniques.
TABLE I
Fusion Techniques & Their Quality Measures
Fusion methods Quality Measurements Peak signal to noise ratio Mean square error Normalized absolute error Maximum difference Average difference Normalized cross correlation Structural content
PCA 35.8316 10.8669 0.0086 29 0.9573 0.9975 1.0043
DCT
Simple
Averaging 39.7047 4.4544 0.0038 27.5000 0.4212 0.9990 1.0016
By
equation(15) 14.2300 3.5355e+03 0.4999 102 55.6173 1.4980 0.4454
DWT Maximum pixel replacement
46.3594 1.5036 0.0021 21.4172 0.2329 1.0011 0.9977
Pixel averaging
41.6429 4.4544 0.0038 27.5000 0.4212 0.9990 1.0016
CONCLUSION
From the above output images and the values of quality measures presented in the table 1, it can be concluded that, PCA & DCT based image fusion technique can be used for applications which does not require high quality & precision. Whereas DWT based fusion techniques provide us good quality fused images than PCA & DCT based techniques.
REFERENCES
[1] V.P.S. Naidu and J.R. Raol, "Pixel-level Image Fusion using wavelets and Principal Component Analysis ," Defence Science Journal, VoI. 58, No. 3, May 2008, pp. 338-352 02008,DESIDOC.
[2] Nirosha Joshitha J, R. Medona Selin,"lmage Fusion using PCA in Multifeature Based Palmprint Recognition, "lnternational Journal of Soft Computing and Engineering (IJSCE) ISSN: 2231-2307, Volume-2, Issue-2, May 20 I 2.
[3] VPS Naidu,"Discrete Cosine Transform based Image Fusion techniques," Journal of
(January 2012) VoI. I, No. I, pp. 35-45.
[8] Ms. V.P.Sawant1 “Fusion Algorithm for Imagesbased on Discrete Multi wavelet Transform” IOSR Journal of VLSI and Signal Processing (IOSR-JVSP) Volume 2, Issue 3 (May. – Jun. 2013), PP 22-27 e-ISSN: 2319 – 4200, p-ISSN No. : 231– 4197 [9] Kanagaraj Kannan1, Subramonian Arumuga Perumal2, Kandasamy Arulmozhi3” Optimal Decomposition Level of Discrete, Stationary and Dual Tree Complex Wavelet Transform for Pixel based Fusion of Multi-focused Images” Serbian Journal of Electrical Engineering Vol. 7, No. 1, May 2010, 81-93 UDK: 004.932.4
[10] V. P. S. Naidu “Novel Image Fusion Techniques using DCT International Journal of Computer Science and BusinessInformatics ISSN: 1694-2108 | Vol. 5, No.1. SEPTEMBER 2013
AUTHOR DETAILS