MATUGA DIVISION, MATUGA SUB-COUNTY, KWALE
COUNTY, KENYA
SALIMU HAMADI MWATENGAR (B.ED)
C50/CE/24722/2011
THESIS SUBMITTED TO THE SCHOOL OF HUMANITIES AND
SOCIAL SCIENCES IN PARTIAL FULFILLMENT OF THE
REQUIREMENTS FOR THE AWARD OF MASTER OF ARTS
(POPULATION GEOGRAPHY) DEGREE OF KENYATTA
UNIVERSITY.
DECLARATION
I hereby declare that this thesis is my own work and that it has not previously been submitted for assessment to any other university for academic credit.
Signature……….. Date………
Salimu Hamadi Mwatengar - C50/CE/24722/2011 Department of Geography
SUPERVISORS
This thesis was submitted with our approval as university supervisors.
Signature……….. Date………
Dr. Francis O. Onsongo Department of Geography Kenyatta University
Signature……….. Date……… Dr. Philomena W. Muiruri
ACKNOWLEDGEMENT
I am grateful to the Almighty Allah for imparting wisdom, patience, hard work and determination in me throughout this course.
My gratitude goes to the Geography Department, Kenyatta University led by Prof. Leonard Kisovi for giving me a chance to undertake the course. I would like to express my sincere appreciation to my supervisors, Dr. Philomena Muiruri and Dr. Francis Onsongo for their excellent supervision, constructive comments and guidance all through the research. You made me a better human being.
I thank my beloved parents, the late Mr. Hamadi Mwatengar and Mrs. Dorothy Muia for all the support, guidance and inspiration. Thanks for always being there for me when I needed you most. Special thanks go to my sisters; Mwanarusi, Sakina and my brother Athmani for being my primary source of motivation. You always kept reminding me that you wanted to see me graduate.
TABLE OF CONTENTS
DECLARATION ... II DEDICATION ... III ACKNOWLEDGEMENT ... IV LIST OF TABLES ... VIII LIST OF FIGURES ... X ABBREVIATIONS AND ACRONMYS ... XI OPERATIONAL DEFINITIONS ... XII ABSTRACT ... XIV
CHAPTER ONE ... 1
INTRODUCTION ... 1
1.1 BACKGROUND OF THE STUDY ... 1
1.2 STATEMENT OF THE PROBLEM ... 4
1.3 OBJECTIVES OF THE STUDY ... 4
1.3.1 Specific objectives for the study: ... 4
1.4 RESEARCH QUESTIONS ... 5
1.5 JUSTIFICATION AND SIGNIFICANCE OF THE STUDY ... 5
1.6 SCOPE AND LIMITATIONS OF THE STUDY ... 6
CHAPTER TWO……… .. 7
LITERATURE REVIEW ... 7
2.1 INTRODUCTION ... 7
2.2 DETERMINANTS OF FERTILITY ... 7
2.2.1 Non-proximate determinants of fertility ... 8
2.2.2 Proximate determinants of fertility ... 15
2.3 THEORETICAL FRAMEWORK FOR THE STUDY ... 19
2.3.1 Index of Women sexuality ... 20
2.3.3 Index of Women sterility ... 21
2.3.4 Index of Contraceptive use ... 22
2.4 NON-PROXIMATE DETERMINANTS OF FERTILITY ... 23
2.5 CONCEPTUAL FRAMEWORK ... 26
2.6 GAPS IN LITERATURE REVIEW ... 28
2.7 SUMMARY ... 28
CHAPTER THREE ... 29
RESEARCH METHODOLOGY ... 29
3.1 INTRODUCTION ... 29
3.2 RESEARCH DESIGN ... 29
3.3 STUDY VARIABLES... 30
3.4 STUDY AREA ... 31
3.5 SAMPLING TECHNIQUES AND SAMPLE SIZE ... 34
3.6 SELECTION CRITERIA ... 36
3.7 DATA COLLECTION TOOLS ... 37
3.7.1 Questionnaire ... 38
3.7.2 Focus group discussion ... 38
3.7.3 Data collection ... 39
3.8 PILOT STUDY AND TESTING FOR VALIDITY AND RELIABILITY ... 39
3.9 DATA MANAGEMENT AND ANALYSIS ... 39
3.10 ETHICAL CONSIDERATION ... 40
CHAPTER FOUR ... 41
RESULTS AND DISCUSSION ON THE PROXIMATE AND NON- PROXIMATE DETERMINANTS OF FERTILITY ... 41
4.1 INTRODUCTION ... 41
4.2 DEMOGRAPHIC CHARACTERISTICS OF THE RESPONDENTS ... 41
4.3 APPLICATION OF THE PROXIMATE DETERMINANT MODEL ... 42
4.4 RELATIONSHIP BETWEEN PROXIMATE AND NON- PROXIMATE DETERMINANTS ... 50
4.4.2 Post –partum insusceptibility (PPI). ... 60
4.4.3 Women‟s Sexuality ... 67
4.4.4 Women‟s sterility ... 74
4.5 SUMMARY ... 77
CHAPTER FIVE ... 78
SUMMARY, CONCLUSIONS AND RECOMMENDATIONS ... 78
5.1 SUMMARY ... 78
5.2 CONCLUSION ... 78
5.2.1 Effects of the proximate determinants on fertility ... 78
5.2.2 Relationship between the proximate determinants and non-proximate determinants ... 78
5.3 RECOMMENDATIONS ... 81
5.4 AN AREA FOR FURTHER RESEARCH ... 81
REFERENCES ... 82
LIST OF TABLES
Table 3.1: Matuga division population by sex and administrative location 34 Table 3.2: Sample size per location and sub-location of Matuga division 37 Table 4.1: Demographic characteristics of the respondents in Matuga division 41
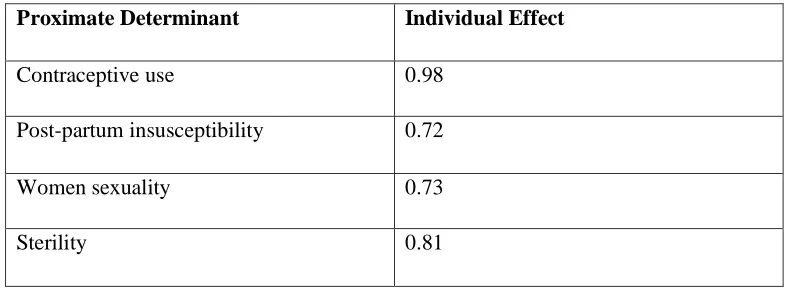
Table 4.2: Inhibiting effects of proximate determinants on fertility in Matuga division 46 Table 4.3: Time period since last intercourse among women in Matuga division 47
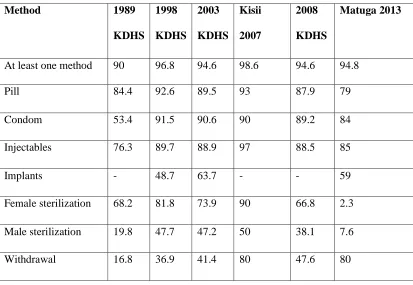
Table 4.4: Knowledge of contraceptive methods among women in Matuga division 51 Table 4.5: Contraceptive use by marital status among women in Matuga division 53
Table 4.6: Contraceptive use levels among women in Matuga division 54 Table 4.7: Contraceptive use by age groups among women in Matuga division 55 Table 4.8: Contraceptive use on the basis of education level among women in Matuga 57 Table 4.9: Contraceptive use as per the religion among women in Matuga division 58 Table 4.10: Religion and children ever born among women in Matuga division 60 Table 4.11: Comparison between breastfeeding and post-partum amenorrhea in
Matuga division 62 Table 4.12: Duration of amenorrhea among women in Matuga division 63
Table 4.13: Duration of breastfeeding among women in Matuga division 64 Table 4.14: Effects of employment on breastfeeding among women in Matuga
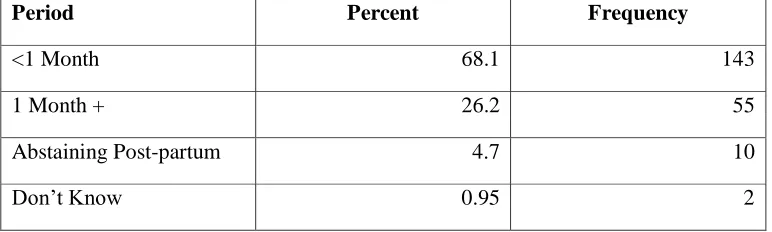
division 65 Table 4.15: Months of abstaining since last birth among women in Matuga division 66 Table 4.16: Duration of post-partum abstinence among women in Matuga division 67 Table 4.17: Age at first intercourse among women in Matuga division 67 Table 4.18: First intercourse at certain ages among women in Matuga division 68 Table 4.19: Age at first intercourse by education level completed among women in Matuga division 69 Table 4.20: Frequency of coitus and marital status among women in Matuga division 70 Table 4.21: Change in coital frequency after birth of children among women in
LIST OF FIGURES
ABBREVIATIONS AND ACRONMYS
AIDS: Acquired Immunodeficiency SyndromeASFR: Age Specific Fertility Rate CEB: Children Ever Born
DDP: District Development Plan DTT: Demographic Transition Theory Ci: Index of postpartum insusceptibility Cx: Index of women sexuality
Cp: Index of sterility
Cu: Index of contraceptive use FGD: Focus Group Discussion ROK: Republic of Kenya
HIV: Human Immunodeficiency Virus IMR: Infant Mortality rate
IUDs: Intra-Uterine Devices
KDHS: Kenya Demographic and Health Survey KNBS: Kenya National Bureau of Statistics LAM: Lactational Amenorrhea
PPA: Post-Partum Amenorrhea PPI: Post-Partum Insusceptibility SSA: Sub-Saharan Africa
OPERATIONAL DEFINITIONS
Age-specific fertility rate (ASFR): The number of births per 1000 women of a specific age (group).
Conception: An act of becoming pregnant
Contraceptives: Any measure used by a couple to avoid conception excluding voluntary abstinence.
Children ever born (CEB): Total number of children a woman has ever given birth to. Demographic factor: Age of the respondents was used as a demographic factor to bring forward an understanding of the ages of the respondents.
Fecundity: Physiological capacity to conceive.
Fertility: Manifestation of fecundity through giving birth.
High birth rate: When the number of births exceeds 5.0 births per woman Infecund: Lack of physiological capacity to give birth.
Non-proximate: These are determinants of fertility that do not directly influence the level of fertility such as education, area of residence, religion and so on.
Polygyny: A state of one man having more than one wife.
Postpartum amenorrhea: Refers to the time period when a woman is not able to become pregnant after giving birth
Proximate determinants: Factors which directly affect the fertility process such as contraceptive use, abortion, sterility, women sexuality and post-partum insusceptibility. Reproductive age: It refers to the period when a woman can give birth. It usually it ranges between 15 to 49 years of age.
Total fertility rate: Number of children a woman will have if she lives through all the reproductive ages and follows the age- specific fertility rates of a given time.
Primary sterility: Inability of a woman who is not using contraceptives to conceive at all.
Socioeconomic factors: Education and employment status formed the socioeconomic factors. The study analysed their impact on fertility behaviour of women in Matuga. Secondary sterility: Inability of woman who had previously conceived to conceive for the past five years despite being sexually active and not using any method of contraception.
ABSTRACT
CHAPTER ONE
INTRODUCTION
1.1 Background of the studyMost countries in the world underwent a marked fertility decline during the 20th century (United Nations, 2007). The world total fertility rate dropped from 4.95 between the years 1950-1955 and was expected to have dropped further by 2015
(United Nations, 2010). This aspect of fertility decline is a common phenomenon across cultures and religions. In the early half of the 20th century, many countries in the
developing world experienced declining fertility followed by 50 years of declining mortality (Coale, 1973). The average fertility in more developed countries declined from 2.8 to 1.6 births per woman between 1960s to 2.7 births per woman in 2000-05
(United Nations, 2010).This fertility decline has been linked to modernization and increased uptake of family planning methods. A positive progress or socio economic
determinants are also usually seen as the main drivers of the fertility decline.
Despite this decline in fertility rates, sub-Saharan Africa registered a total fertility rate of 4.95 births per woman in 2010. This is comparatively higher compared to other
developing regions. Fertility was high (more than 5.0 births per woman) in the 1950s in all countries of Sub-Saharan Africa In East Africa, for example, the birth rate is
recorded at 5.1 children per woman (UN, 2009). Makinwa (2001) groups African countries‟ fertility decline into three categories: category 1 comprises countries with a
decline (between 0.5 and 0.9 every ten years). This group includes: Benin, Mauritania, Senegal, Cameroon, Central African Republic, Malawi, Tanzania and Swaziland. Category 3 includes countries which have stabilized at the peak and have not started
declining (TFR is at 6.0 births per woman). Countries in this category are: Burkina Faso, Liberia, Mali, Togo, Burundi, Ethiopia, Madagascar, Mozambique and Uganda.
The decline has not been uniform as indicated by differentials in the fertility rates of different regions in sub-Saharan Africa.
Different theories have been proposed over time regarding the determinants attributed
to differential fertility. The socio-cultural theories for example have focused on attitudes and motivational factors at community level that explain reproductive behaviour
(Nanda, 2005). On the other hand, economic theories focus on the financial implication related to fertility.
At the national level, Kenya‟s total fertility rate (TFR) has declined from 7.8 births per
woman between 1969 and 1979 to 4.6 in 2009 (Kenya National Bureau of Statistics, 2010). This fertility decline nevertheless stalled in its transition in the 1990s. Bongaart
(2006) confirms that Kenya is one among seven countries where fertility had stalled in mid-transition in the 1990s. The stall in fertility was attributed to a change in
reproductive behaviour, socio-economic and institutional factors (Cetorelli and Leon, 2012). However it declined to fewer than 5.0 births per woman in the early or mid-1990s before coming to a standstill (KNBS, 2010).
woman, followed by Central region at 3.4 births per woman. On the other hand, Nyanza region registered at 5.4 births per woman, while Eastern region recorded 4.4 births per woman. Other statistics indicated that Western and Rift valley regions had each 4.7
births per woman; Coast region had a fertility rate of 4.8 births per woman; and North Eastern region which had the highest fertility rate registered at 5.9 births per woman.
These differentials are closely associated with disparities in educational levels and knowledge and the use of family planning methods (KNBS, 2010).
Normally, fertility is considered to be high if it is above 5.0 births per woman.
According to the District Development Plan (2008-2012), the fertility of Kwale County was registered at 6.0 births per woman. This made Kwale County‟s fertility rate one of
the highest in Kenya. Other counties that have recorded high fertility are found in Western, Nyanza, North-Eastern and other areas of the Coast region. These districts with higher fertility rates are mostly found in areas where levels of poverty, illiteracy
and dependency ratios are high.
This study examined the influence of socio-economic, socio-cultural, demographic and
proximate determinants to the high fertility in Matuga division. These determinants included: age of respondents, education levels, employment status, area of residence,
1.2 Statement of the problem
Matuga sub-county remains one of the areas experiencing high fertility rates in Kenya.
Among the divisions in this sub-county, Matuga division has experienced a rise in population from 72,377 in 1999 to 91,194 in 2009 (Republic of Kenya, 2010). This population projected to reach 108,841 in 2012 (Kwale District Development Plan,
2008-2012). The fertility rate of Kwale County was registered at 6.0 births per woman compared to 4.6 births per woman nationally (KNBS, 2010). The high fertility rates
have resulted into poor child and maternal health. Child schooling especially for the girls was greatly affected by high fertility rate. Other effects resulting from the high
fertility rate include slow economic growth and destruction of the natural environment.
There is inadequate information on the contributors to this high total fertility rate which is well documented on the socio economic and cultural, demographic and the proximate
determinants. The sub-county also experiences a dependency ratio of 76 people per 100 with 53% of its population living in absolute poverty (DDP, 2008-2012: 17). Despite
the implementation of the family planning strategies by the government and non- governmental organisation, the fertility rate has remained remarkably high hence the need to examine the factors responsible for the high fertility rate.
1.3 Objectives of the study
The general objective of the study was to analyse the determinants of fertility in Matuga Division in Matuga sub-county, Kwale County, Kenya.
1.3.1 Specific objectives for the study:
2. To determine the role of demographic factors influencing the fertility levels in Matuga Division, Matuga sub-county, Kenya.
3. To determine the role of socio-cultural factors influencing fertility in Matuga
Division, Matuga sub-county, Kenya.
4. To examine the role of the proximate determinants affecting fertility in Matuga
Division, Matuga sub-county, Kenya.
1.4 Research questions
The study analysed the causes of high fertility in Matuga division. Through the following research questions:
1. What is the relationship between the socioeconomic factors and fertility in Matuga Division, Matuga sub-county, Kenya?
2. How do demographic factors affect fertility in Matuga Division, Matuga
sub-county, Kenya?
3. What is the relationship between sociocultural factors and fertility of Matuga
Division, Matuga sub-county, Kenya?
4. How do the proximate determinants affect fertility in Matuga Division, Matuga sub-county, Kenya?
1.5 Justification and significance of the study
East Africa lags behind other regions in terms of economic development and fertility decline, and demographic transition. There are various explanations to outline why human fertility varies from one society to another and among different groups of
development notes that for Kenya to move to a middle income country, the fertility rate needed to be reduced from 4.6 births per woman in 2009 to 3.4 births per woman by 2020. It acknowledges that knowledge and information on issues related to fertility are
integral in regulating fertility. Therefore, conducting this study was well-justified to focus on the examination of these explanations as pertains to Matuga Division. This
study employed a different perspective that involved both qualitative and quantitative techniques. The study aimed at identifying the most important factors responsible for Matuga‟s high fertility rate. The findings of the study can help the government
formulate effective policies that would boost the on-going awareness on contraceptives use. Finally, it is anticipated that by making the findings available to the community, it
will hopefully enable couples have a rational approach to family planning.
1.6 Scope and limitations of the study
The study analysed both direct and indirect proximate determinants of fertility in Matuga division including: contraceptive use, women sexuality, post-partum
insusceptibility and women sterility as the direct determinants and religion, ideal number of children preferred, education level, employment status and age of the respondents as the indirect determinants. Two main limitations of the study included
illiteracy and presentation of incorrect information by the respondents due to this illiteracy. These limitations were overcome by using a research assistant well versed in
CHAPTER TWO
2
LITERATURE REVIEW
2.1 Introduction
This study uses various in depth analyses to examine the relationship between the proximate and non-proximate determinants of fertility. Several perspectives of fertility were examined to shed light on the role of demographic, socio-economic and cultural
factors in reproductive behaviour. Works of Davis and Blake (1956), Bongaarts (1978 and 1982) and Stover (1998) on determinants of fertility will also be discussed to
enhance the understanding of the proximate determinants of fertility. The study adopted the framework used by Stover (1998) to study the proximate determinants of fertility in
Matuga Division.
2.2 Determinants of fertility
Since ancient time‟s man has been concerned about issues relate to fertility. It is
however rather puzzling that no single theory has been developed which fully describes the concept of fertility. Some scholars overtime have equated the explanation of
determination of fertility to an evolving story consisting of different disciplinary orientations. Disciplines such as economics, history, anthropology, biology, psychology
and sociology have all contributed greatly to understanding determinants of human fertility. For the purpose of this study, the researcher discussed specific non proximate
2.2.1 Non-proximate determinants of fertility
2.2.1.1Socio-economic determinants of fertility
2.2.1.1.1Education levels
Education of all socio-economic factors influencing fertility has been used by many demographers due to its strong effects on fertility behavior. The length of education is normally associated with the onset of exposer to conception. Mason (2000) noted that
communities with women who had moderately higher education had higher decision making power and more freedom of movement thus tended to have low fertility , greater use of conception and less desire of many children. Jejeebhoy (1995) established that of the two genders, the effect of wife‟s education was statistically significant and
more powerful compared to the effects of the husband‟s education. On the other hand,
Bongaart (2003) while discussing the effects of educational differences in fertility transition showed that education levels in six countries from Africa, South America, and Asia had an impact on fertility, where more educated women generally had lower
fertility rates.
Fertility of women with no schooling is expected to remain above two births per woman
even as countries move from being underdeveloped to being developed. Empirical evidence from both developed and developing countries unambiguously show that
female education is associated with reduction of fertility. The relationship between women‟s education and fertility is negative. This hypothesis has been proved by both
economists and sociologists. The longer women stay in school, the longer they defer
Caldwell, 1980 as quoted by (Lloyd et al, 2000:483) hypothesized that fertility decline in developing countries would be achieved if mass school of children is done. Mekonnen (2010) noted that with an increase in education, contraceptives use and
knowledge increased thus negatively affecting fertility. While studying fertility in East Africa countries he found out that women‟s gross primary school enrollment variables
negatively correlated with the total fertility rate.The fertility rate of women in Kenya in 2010 who had secondary education and above was at 3.1 births per woman. On the other hand, the fertility of women who had not completed primary education was
registered at 6.7 births per woman (KNBS, 2010).
2.2.1.1.2Employment status
Occupational and environmental exposure in many countries affects fecundity. Tsegaye (2011) established that in Ethiopia, education level of women determine both actual and
desired number of children. Those women who had attained some level of education had less and desired a lesser number of children. He noted that when explanatory variables were controlled, women who were working in Ethiopia reduced their number
of births by 0.06 compared to the non-working women.
A study conducted in South Africa using the Kaplan Meier curve of time to pregnancy
(TTP) by employment established that women who were employed prior to pregnancy had a significantly longer time to pregnancy than those who were not. The study noted that TTP distribution of a community represents its degree of biological fertility (Bello
within a certain society (Beguy, 2009). The conflict between child bearing and work arises from the separation between home and work place, the nature of employment and social norms regarding the roles of both men and women. It is believed that there exists
in many societies an inverse relationship between employment and childbearing. When talking of employment, it refers to both formal and informal self-employment.
It is worth noting that some forms of work do not have an influence in fertility. Beguy (2009) while studying the effects of female employment and fertility in Segal noted that women occupied in agriculture and those working at home are to a large extent able to
combine working and playing their roles as mothers. It is paramount to note that not all the time does employment negatively affects fertility. Apriany (2009) while studying
the determinants of fertility in West Sumatra province established that empowered women including those employed did breastfeed for a short period compared to the unemployed women thus exposing them to pregnancies if all other factors are held
constant.
The relationship between women and employment and fertility varies from one
socio-economic and cultural context to another. While comparing the relationship between women employment and childbearing in three different countries in china, Shuzhuo et
al, 1997 established that in Jiang (a more developed county), a negative relationship was found. On the other hand a positive relationship was found in Luochuan (a less developed county) while no relationship was found in Xiaoyi (a medium developed
2.2.1.2 Sociocultural determinants of fertility
2.2.1.1.3Religion
Religion has overtime largely been seen as a barrier to fertility decline in many parts of the world. Mc Quillan (2004) put forward 3 predictions necessary for religion to
influence fertility. That religion affects fertility if: It can articulate norms relevant to fertility, it can communicate these values and promote compliance and if it is central to the social identity of its followers.
Matuga division is a predominantly Muslim population thus this study focused more on the role of Islam in fertility outcomes.
Morgan et al (2002) noted that Asian Muslims had pro-natalist attitudes than their Christian counterparts. Studies done in West Africa found that Muslims in areas where
they form majority of the population had lower fertility compared to areas where they were the majority religion on the other hand, Muslims in low income areas have higher fertility levels (Johnson-Hanks, 2006).
Agadjanian (2001) established that among the Christians in Mozambique, mission protestant and Catholics in urban areas were more likely to have used or had
conversation around modern family planning than their counterpart from more evangelical churches.
Yeatman & Trinitapoli (2008) while studying religious affiliation and fertility in rural
Malawi established that of all religions, Muslim comprised the minority user of modern family planning methods. Many studies have agreed to tell fact that intensive religious
A more natural explanation is that there is a positive relationship between religiosity and fertility, that the more religious parents are more likely to have more children.
Four principal hypotheses have been proposed in literature on religious studies
regarding fertility to explain these fertility differentials namely, (1) the particularized theology hypothesis, (2) the characteristic hypothesis, (3) the minority status
hypothesis, (4) the social interaction hypothesis (Mc Quillan, 2004). The particularized theology hypothesis sees fertility differentials as a result of specific doctrinal differences among religions for example, that religious groups whose values are against
contraception and abortion and favor large family sizes should have higher fertility. The characteristics hypothesis on the other hand stems from a point of view that fertility
differential among religious groups are caused by demographic and socioeconomic differentials with members of religious groups and not religious doctrines. Thirdly, the minority group‟s perspective argues that insecurity of minority group‟s status plays a
role in depressing fertility of minority religious groups below that of the majority.
The prerequisites for the normal status mechanism to operate includes: socio economic
mobility, lack of pro-natalist ideology and acculturation. The hypothesis adds race and ethnic groups on top of the differentials among religious groups .The socio interaction
2.2.1.1.4Ideal number of children
While acknowledging that biological factors such as: women sexuality, contraceptive
use, women sterility and post-partum insusceptibility directly affect fertility, cultural traits come in handy in determining human fertility levels. Socio cultural theories of fertility have focused on the attitudes and motivational factors at the community level in
explaining reproductive behaviour.
Many ethnic groups especially in sub Saharan Africa consider having many children for
several reason including: the desire to see children have their peers within the home stead, desire for certain combination of children and to enhance survival chances due to the high mortality rates (Faweett,1977). These values attributed to the number of
children one would wish to have varied from one society to another. Socio economic status at times plays an important role when couples wish to have a certain number of
children.
This phenomenon is clearly seen from Fawcett‟s theory of the value and cost of children. In this theory, Fawcett attaches certain values and cost that help couples
determine the ideal number of children they wish to have.
Caldwell‟s wealth flow theory also outlines the role played by health in determining the
number of children one could prefer having. The theory generally states that fertility decisions in all societies are economically rational response to a family‟s wealth flow
(Caldwell, 1976). Societies where wealth flows from the younger generation to the
as source of wealth. The children here provide wealth through dowry, they provides security in old age and social political well-being.
Freedman (1963) noted that cultural norm related to family size tend to be crucial
matters for families and societies where they belong. That cultural norm determines family sizes, marriages, timing of intercourse and even abortion (Freedman, 1963). He
argues that a couples reproductive decision are highly influenced by family size norms embedded in their society due to the rewards and penalties attached to the number of children they have.
A study done in Ethiopia among the Suri ethnic group noted that parents (both men and women) intended to have as many children as possible. In this community boys were
shepherds, providers of security and extra hands in mining gold and cattle raiding. Girls fetched up to 30 cattle and one AK-47 rifle as dowry to the parents thus a need to have many children. (Eyayoo and Zerihun, 2004)
2.2.1.3Demographic factor of fertility
2.2.1.1.5Age of the respondents
Age is an essential factor when studying the demography of a population. Ameyaw
(2012) noted that, the population structure of a population in terms of age is a basic consideration when studying a population. Studies conducted in many countries have shown that generally fertility, follow a normal age specific curve which depicts low
Blacker 1967 as quoted by Apriany (2009) identified 3 stages of child bearing in women. These included: sub fecundity, full fecundity and decline fecundity. The ability of women to conceive is lower in the first and third stages of reproduction. These two
stages are at the beginning of menarche and a period when a woman approaches menopause. Women are generally at the pick of their sexual activities in their twenties
if all other factors are held constant.
2.2.2 Proximate determinants of fertility
Henry (1953) developed a concept of natural fertility where he defined it as fertility that existed in the absence of deliberate control through abortion or contraceptive use. Reproductive in the natural set up is not dependent on the number of children a couple
have but on age at menarche, fecundability; time period for gestation, intra uterine mortality and post-partum amenorrhea. This concept of natural fertility has evolved
overtime.
Kingsly Davis and Judith Blake (1956) provided an enormous contribution with the development of the first analytical frame work on the proximate determinate of fertility.
De Bruijn (2006) noted that these determinants either affected the exposure to intercourse or the exposure to conception, gestation and successful parturition. Davis
and Blake (1956) identified a set of 11 intermediate variables that directly affected fertility from the three categories:
A. Factors affecting exposure to intercourse
2. Permanent celibacy: proportion of women never entering into sexual unions
3. Amount of reproductive periods spent after or between unions
I. When union are broken by divorce, separation or desertion
II. When unions are broken by the death of the husband.
4. Voluntary abstinence
5. Involuntary abstinence (from impotence, illness, temporary separation)
6. Coital frequency (excluding periods of abstinence)
B. Factors affecting exposure to conception
7. Fecundity or infecundity affected by involuntary causes
8. Use or non-use of contraceptives
9. Fecundity or infecundity, as affected by voluntary causes
C. Factors affecting gestation and successful parturition
10. Foetal mortality from involuntary causes
11. Foetal mortality from voluntary causes
Bongaarts (1978, 1982) refined the work of Davis and Blake and collapsed them into 7
direct (proximate) determinants, to understand variations in fertility. This resulted to a simple but powerful model for analyzing how fertility changes overtime or differs from
I. Proportion of married women among all women of reproductive age
II. Contraceptive use and effectiveness
III. Duration of postpartum infecundability (insusceptibility)
IV. Induced abortion
V. Fecundability (including frequency and timing of intercourse)
VI. Prevalence of permanent sterility
VII. Spontaneous intrauterine mortality
From the 7 proximate determinants, Bongaarts 1982 showed that 4 determinants were
most important in affecting fertility. These were: - proportion married, contraceptive use, abortion and post-partum infecundability. The model thus suggested that the total
fertility rate could be described as
TFR= C (m)*C (c)*C (a)*C (i)*TF
Where:-
C (m) - Index of proportion married
C (c) - Index of contraceptive
C (a) - Index of induced abortion
C (i) - Index of lactational infecundability
This model has been widely used in fertility studies all over the world. Stover (1998) noted that since the publication of Bongaarts first paper on the framework for analyzing fertility, more than 100 publications had appeared in different countries and regions
using it to understand fertility differentials. He noted that the frame work was integral in:
a) Decomposing the contribution of each of the determinants to the attainment of the total fertility rates.
b) Analyzing the changes in contribution of the proximate determinants to the
changes in TFR overtime
c) Comparing fertility differentials between countries and regions considering the
proximate determinants.
d) Estimation of total abortion rates
e) Projecting future levels of contraceptive use
Bongaarts proximate determinants model is theoretically strong. However there are several limitations that come into being following several hundreds of studies. Stover
(1998) made key changes to the model to overcome the challenges that arose with the earlier model as started by Bongaarts (1978).
sexually active. Similarly, some women may also be married but sexually in active.
2. He added the index of pathological sterility following evidence that data from
sub- Saharan Africa which showed that the index of pathological sterility was responsible for large differentials in fertility levels.
3. An overlap between contraceptive use and infecundability was taken into account.
4. An overlap between contraceptive use and post-partum amenorrhea is
adjusted.
This study employed Stover 1998 model to analyze the proximate and non-
proximate determinants of fertility in Matuga division as discussed next.
2.3 Theoretical framework for the study
This model has been widely used over time and is one of the most widely used tools in fertility analysis (Stover, 1998). Awes (2014) notes that this model of fertility analysis
has been used in hundreds of analysis thus influencing greatly the collection and reporting of data related to fertility all over the world. The model is used in demographic studies to identify and analyse the main factors behind fertility changes.
This model assumes that the natural reproductive capacity of women is nearly the same for all women, but their actual productivity is determined by four proximate determinants including: women‟s sexuality, contraceptive use, post-partum
model uses an index range of between 0-1 for the proximate determinants where the nearer a value is to 0 the higher the inhibiting effect the determinant has on the natural reproductive capacity and vice versa.
Muturi and Hinde (2001) while studying fertility trends during the years 1967-1999, in Tanzania, found out that three factors played a key role in inhibiting fertility. These
factors included contraceptive use, marital status, and post-partum insusceptubility.
2.3.1 Index of Women sexuality
This index commonly uses data of women aged between 15-49 years who are sexually active (they had sex in the last four weeks or pregnant or abstaining post-partum).The formula for women sexuality is:
= S
Where,
S = the proportion of women sexually active
2.3.2 Index of Post- partum insusceptibility
Post-partum insusceptibility as an index includes both the duration of post-partum abstinence and lactational amenorrhea. It attempts to show the effects extended periods
of post- partum insusceptibility on fertility. Without lactation, a typical average birth interval can be estimated to be 20 months, made up of 1.5 months of non - lactation infecundity, an average of 7.5 months waiting time to conception, 2 months added by
birth intervals without and with lactation is the one called the index of lactation
infecundability ( ).
The formula is as follows:
= 20/ (18.5+i)
Where,
i - Mean duration in months of post-partum insusceptibility
20 = the average birth interval in the absence of breast feeding and (18.5+i) is the average length of the interval when breastfeeding takes place.
2.3.3 Index of Women sterility
The third proximate determinant in Stover‟s model is women sterility. Onsongo (2012)
noted that female sterility refers to the measure of the fertility inability effect of infecundability of women. Data on women sterility is acquired through women reporting that they have been sexually active and have not been using any form of
contraceptive for the last five years but they have not managed to conceive. The index is attained through the use of the formula:
= 1-f
Where:
2.3.4 Index of Contraceptive use
The fourth proximate determinant is contraceptive use. This is used to measure the
depressing effect of contraceptive use on fertility .The contraceptive use is depicted by the formula
= 1-u*e
Where,
u - The proportion of sexually active fecund women aged 15-49 using contraceptives and who do not overlap with those experiencing amenorrhea
e - The average effectiveness of contraception.
Stover (1998) emphasized that reproductive age is between 15 to 49 years. This means
that there are 35 years of reproduction. Because infecundability is now put together with sterility, the new value of total fecundity is 21. This is achieved by:
TF = (35years×12months)/20months
Where
TF=Total fecundity
Note that, 20 Months is the average birth interval
TF= (35×12)/20
TF= 21
After acquiring the total fecundity, the total fertility rate can be calculated by
multiplying the figures of; the number of women who are sexually active ( ), the index
of post-partum infecundability ( ), the index of contraceptive use ( ), index of
sterility ( ) and the total fecundity (TF).
Overall Stover‟s model is as follows:
TFR = ( × × × × TF)
Uswatun, 2009 while studying the factors influencing fertility in East Nusa Tenggara province in Indonesia using this model found out that PPI had the most fertility reducing effect compared to other proximate determinants of fertility.
On the other hand, Getu and Worku (2009) used the model in Ethiopia and established the PPI also had the highest inhibiting effect on fertility. Ekisa and Hinde (2005) used
the model to establish that between 1989 and 1993, contraceptive use had the highest impact in regulating fertility in Kenya while Lubaale et al (2007) noted that indirect factors of fertility such as education, religion and employment status worked through
the direct determinants to affect fertility among women in the urban areas of Uganda.
2.4 Non-proximate determinants of fertility
Non- proximate determinants are factors that affect fertility through the proximate determinants. These factors are attributed to socio-economic and cultural factors within
a society. Lucas et al. (2003) stated that several indirect variables affect fertility through the proximate determinants. These factors include socio economic structures, socio
include attitudes related to family size structure and formation, environment, and knowledge of contraception and attitudes towards contraceptive use.
Education level is an important indirect variable when dealing with fertility. Empirical
evidence in the developed and developing countries unambiguously reveals that female education is associated with fertility decrease (Sackey, 2005). This indicates that the relationship between women schooling and fertility is negative. A woman‟s level of
education determines her fertility rate. More educated woman gets less number of children due to the length of time she spent in school. Lesser educated women, on the
other hand, are likely to register high fertility due high exposure to fertility. Askew et al (2009) noted that women in Kenya with secondary or higher education continued to
experience a decline in fertility.
Education level also affects breastfeeding period where higher education levels lowered breastfeeding period as noted by (Giashuddin and Kabir, 2003). The more educated
women spend a lot of time at their work places as compared to their homes. This reduces the amount of time a child is expected to breastfeed and therefore negatively
impacting the breastfeeding period.
The employment status of ever married women is an indirect determinant of fertility.
Housewives for instance tend to have higher fertility compared to women who are employed or self-employed. This is due to the fact that the latter have too many commitments at their work places. In the urban areas of East Africa, young women who
The study found out that in Lome women involved in employment delayed the time of giving birth.
Religion as a variable tries to give an answer to the following questions:
i. Are there any religious differences in fertility behaviour between people of different religions?
ii. Does the concept of religiousness affect fertility?
Heineck (2006) while studying the relationship between religion and fertility in Austria established that women who are “strong Catholic believers” had more children
compared to non-believers. Another study that confirms this impact of religion on fertility is that of Freijka and Westoff (2006). These researchers found out that in
Europe and USA, the more religious women had a higher fertility compared to the more liberal women. In the Kenyan context, Opiyo (2004:51-62) noted that Muslims in Coast province, had low fertility compared to Muslims in North Eastern province.
Studies have shown that married couples in the developed countries have fewer children compared to their counterparts in the developing countries. The reasons relating to this
phenomenon are related with socio-economic and cultural factors. Lucas et al. (2003:44-54) identified that the ideal number of children is an essential variable in
comparing societies with small and large family norms. He concluded that generally younger generation women prefer one or two children fewer compared to their older counter parts. Data from demographic health survey (DHS) shows that the mean desired
one-fourth of the couples agree on the ideal number of children. A greater proportion of husbands than wives consider more children to be ideal (Gebreselassie, 2008).
2.5 Conceptual framework
From the literature above, the conclusion is that the existing theories seem to be constructed to explain how the different variables influence reproductive behaviors. The
discussion has helped this researcher to develop a conceptual framework appropriate for analysing the determinants of high fertility in Matuga Division. The framework is a
modification of Stover‟s 1998 reformulation of Bongaart‟s model.
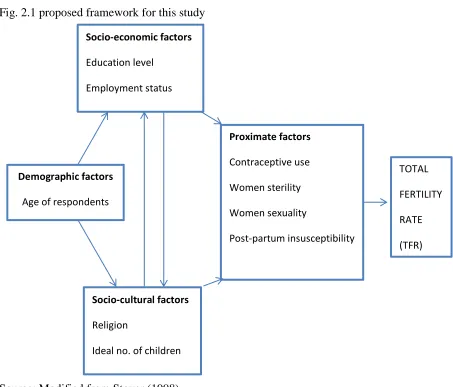
The framework illustrates how the indirect determinants including: socio-economic,
socio-cultural, and demographic factors may indirectly affect the fertility levels through the four proximate determinants of contraceptive use, women‟s sexuality, women sterility and post-partum insusceptbility. The socio-economic factors consist of
education levels and employment status while the socio-cultural factors consist of religion and ideal number of children. Age of respondents is the demographic factor
Fig. 2.1 proposed framework for this study
Source: Modified from Stover (1998)
Several factors influenced the researcher to choose these variables. The age of the
respondents is an important factor since the age at which one starts to engage in coitus may influence the number of children she is bound to have. The employment status indirectly determines their fertility rate where women who are employed tend to have
fewer children compared to their unemployed colleagues. Uswatum (2007:29) noted that the relationship between education and fertility is strong and consistent. More
educated women prefer to have fewer children so that they can focus on their careers as compared to the less or uneducated women.
Socio-economic factors
Education level Employment status
Demographic factors
Age of respondents
Socio-cultural factors
Religion
Ideal no. of children
TOTAL FERTILITY RATE (TFR) Proximate factors
Contraceptive use Women sterility Women sexuality
Pandey et. al (2012) while studying the socio-economic and cultural factors affecting fertility in Nainital district of rural India found out that majority of the large sized families came from the middle and low income earning communities. As a result of this
the study assumed that the variable ideal number of children may be having an impact on the fertility of the division. Religion was picked for this study since the population of
Matuga division is largely composed of Muslims leading to the assumption that it may be indirectly affecting the fertility of the area.
2.6 Gaps in literature review
From the literature review above, there is no study that has been done in Matuga
division on the determinants of fertility despite the fertility of this area being high. This study therefore helped to make clear the effects of the above mentioned determinants of fertility. It examines how the direct and indirect determinants interact to influence the
fertility levels in the division.
2.7 Summary
This chapter discussed the major approaches related to fertility, giving explanations to factors that lead to an individual deciding to have a certain number of children in a
union. It also gave a description of the various determinants of fertility, both the direct and indirect ones and showed how the indirect determinants of fertility act through the
CHAPTER THREE
3
RESEARCH METHODOLOGY
3.1 Introduction
This chapter gives an account of the research design used and the variables employed in the study. It establishes how the sample size of 214 was arrived at from a population of 17815 households. The study also outlines the methods of data collection used
including the use of questionnaires and key informant interview. In addition, it also shows how the research instruments were developed, how testing for validity and
reliability was done, and how analysis was done using SPSS (V.17).
3.2 Research design
This study used a descriptive survey method using both qualitative and quantitative techniques. This type of survey entails the collection of data by using a questionnaire to
know the opinions of a population based on the sample of the population (Creswell, 2009). It is a research technique in which responses are collected through a structured instrument from a sample of a population. The data collected is measured, analysed and
leads to generalised findings. Quantitative data for this study was collected using questionnaires, while qualitative data was collected using key informant interviews.
Probability sampling was used in this study. Primary data was collected using the questionnaires while secondary data to supplement the primary data was collected from the Demographic Health Survey reports (DHS) 1989, 1998, 2004, and 2010. District
Development Plan (DDP) 2008-2012 and the Internet were also used. The data collected was analysed using measures of central tendancy (mean and median) and
3.3 Study variables
These are the measurable characteristics that were used for the study. The dependent
variable for the study was the Total Fertility Rate (TFR). The independent variables included the following indirect determinants: age of the respondents; number of children they have; education level, employment status; religion and ideal number of
children. Direct determinants included the following: women‟s sexuality, contraceptives use, post-partum insusceptibility, and women sterility. It is worth noting that abortion is
one of the direct determinants of fertility. This variable was however not used in this study since it is difficult to get accurate information on it due to the cultural indecency
attached to the practice. Another reason is the fact that abortion is still illegal in Kenya.
The variables under study were defined as below:
A. Dependent variable
1. Total Fertility Rate (TFR): the total number of children a woman would have if she survives up to the end of her child bearing age (49years). The TFR for
Kwale County was 6.0 births per woman. B. Independent variables
Indirect determinants
1. Education level: the highest attained education level by a woman aged 15 – 49 years.
2. Employment status: whether the woman aged between 15 – 49 years is working or not.
3. Religion: the religious affiliation of the women aged 15 – 49 years.
5. Number of children: the number of children that a woman had by mid-year in the year of study.
Direct/proximate determinants
1. Post-partum insusceptibility: the combined effect of breastfeeding and post-partum sexual abstinence.
2. Contraceptive use: whether the woman aged 15 – 49 years uses any contraceptive method.
3. Women sexuality: women who have been sexually active in the last four weeks.
4. Women secondary sterility: this study used the term as the inability of woman who had previously conceived to conceive for the past five years despite being
sexually active and not using any method of contraception.
3.4 Study Area
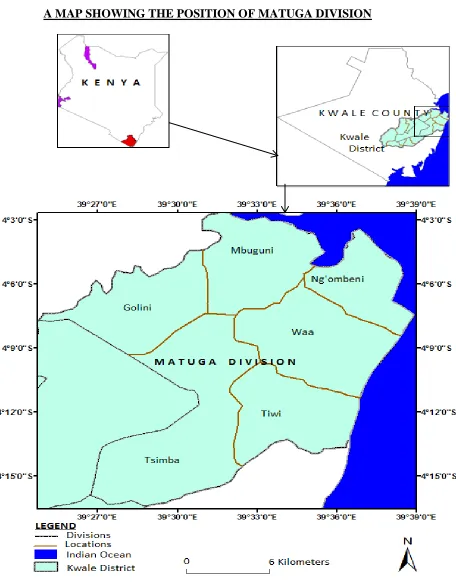
The study was conducted in Matuga Division of Kwale County. The division is located to the south of Mombasa with its headquarters at Kwale town, about 30km from
Mombasa Island. It borders Likoni sub-County to the North, the Indian Ocean to the East, Kubo division to the West, and Msambweni sub-county to the South.
The physical characteristics consist of a coastal plain with narrow belt that varies in
width from 3km to 20km. The coastal plain lies below 30m above sea level and extends 10kms inland. It experiences tropical climatic condition and a rainfall that ranges from
The socio economic characteristics of the division consist of 6 locations namely: Golini, Mbuguni, Ngombeni, Tsimba, Tiwi and Waa Locations. The inhabitants of the area include the Digo and Duruma who are the natives. Other communities living in the area
include the Kikuyu, Kamba and Somali among others. The most popular religion in the division is Islam followed by Christianity. A small group of people especially the
elderly practice African Traditional Religion.
Kwale town is the most populous region in the division. Livelihood activities in the division include: agriculture specifically mixed farming of crops such as maize, cashew
nuts, cassava and animals including: cows, goats, and sheep. Poultry farming is also practiced in the division. Small scale fishing using dhows is done in the areas bordering
the Indian Ocean. Matuga division is home to several tourist attraction sites such beach hotels namely Amani and Hill park hotels, Shimba Hills and Mwaluganje elephant sanctuary. The division had a population of 91,194 according to the 2009 census report
and a total of 17815 households (table 3.1).
The division had a population density of 108,841 and 299 persons per km2 respectively
(DDP, 08-12). The infant mortality rate stood at 92 deaths per 1000 while the child mortality rate was 149 per 1000. The crude death rate was at 14 deaths per year per
Fig 3.1: A map of Matuga Division.
A MAP SHOWING THE POSITION OF MATUGA DIVISION
Table 3.1: Matuga division population by sex and administrative locations
MATUGA DIVISION POPULATION BY SEX AND ADMINISTRATIVE LOCATIONS AREA MALE FEMALE TOTAL HOUSEHOLDS AREA IN
SQ.KM Golini location 6866 7208 14074 3054 51.9
Mbuguni location 2782 2968 5750 1006 56.8
Ngombeni location 9530 9189 18719 3548 49
Kiteje 1833 1706 3539 701 19.1
Ngombeni 5466 5331 10797 2032 23.6
Pungu 2231 2152 4383 815 6.3
Tsimba location 6805 7373 14178 2510 70.1
Kundutsi 3997 4375 8372 1511 38.6
Mazumalume 2808 2998 5806 999 31.5
Tiwi location 9607 9802 19064 3916 49.4
Mkoyo 4347 4426 8773 1822 17.2
Simkumbe 5260 5376 10636 2094 32.2
Waa location 9328 9736 19064 3781 65
Kitivo 2847 2950 5797 1242 15.7
Kombani 2219 2198 4417 892 14
Matuga 4262 4588 8850 1647 35.4
Matuga division 44918 44276 91194 17815 342.1
Source: KNBS (2010)
3.5 Sampling techniques and sample size
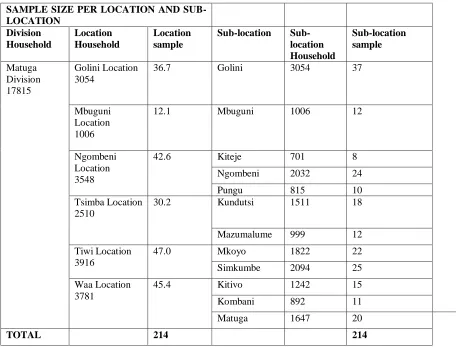
The study used a simple random sampling procedure. The unit of analysis is women aged between 15-49 years. All locations and sub-locations in the division were equitably and fairly represented based on the number of household in each location and
sub-location. The number of households per sub-location was computed with respect to the sample size of 214 as shown below;
Sample size =n/ {1 + (n ⁄ population)}
n=Z×Z {P (1-P) ⁄ ((D×D))} NB:
1. The expected frequency of the factor under study =10% 2. The worst acceptable frequency=14%
3. P = expected frequency value (10%)
4. D = (expected frequency-worst acceptable)
=14%-10%
=4%
5. Z =1.96 at 95% confidence level
6. Population of Matuga division is 17815
Thus:
n=1.96×1.96{0.10(1-0.10)/ (0.04×0.04)}
n=216.09
Hence:
Sample size=n ⁄ {1+ (n/population)}
S=216.09/ {1+ (216.09/17815)
In each household, one woman in her reproductive age was picked for the study. In cases where there were more than one woman in a household, the researcher devised a lottery with „yes‟ and „no‟ options to pick the respondents.
The sample size per location was attained by cross multiplying the total sample size with the number of household per location over the total number of households in the
division.
For example:
Sample size per location = (total sample size × number of households per sub-location)/
(total household in the division)
Golini Sub-location= (214×3054)/17815
= 37
3.6 Selection criteria
The participants for the study involved women in their reproductive ages (15-49 years) regardless of their marital status, tribe and religion. Consent was first asked before the
Table 3.2: Sample size per location and sub-location of Matuga division SAMPLE SIZE PER LOCATION AND SUB-LOCATION
SAMPLE SIZE PER LOCATION AND SUB-LOCATION Division Household Location Household Location sample
Sub-location Sub-location Household Sub-location sample Matuga Division 17815 Golini Location 3054
36.7 Golini 3054 37
Mbuguni Location 1006
12.1 Mbuguni 1006 12
Ngombeni Location 3548
42.6 Kiteje 701 8
Ngombeni 2032 24
Pungu 815 10
Tsimba Location 2510
30.2 Kundutsi 1511 18
Mazumalume 999 12
Tiwi Location 3916
47.0 Mkoyo 1822 22
Simkumbe 2094 25
Waa Location 3781
45.4 Kitivo 1242 15
Kombani 892 11
Matuga 1647 20
TOTAL 214 214
Source: Adopted and modified from KNBS 2010
3.7 Data collection tools
The research instruments used in the study included: a structured questionnaire and an
3.7.1 Questionnaire
The questionnaire had both closed and open ended questions. Closed ended questions
were accompanied by a list of suitable answers. These types of questions were used because they were easily quantifiable, easier to administer, and time bound while open ended questions did not have answers instead they allowed the respondents give more
information related to the question. The questionnaires were administered to women aged between 15 and 49 years in their respective households. They were administered in
English (and where necessary) translated to Kiswahili for illiterate respondents to ensure accuracy of responses.
The questionnaire was divided into several sections, section 1 had questions related to
demographic, socio economic, socio cultural and environmental factors influencing fertility. Section 2 entailed questions on the proximate determinants of fertility
including; women sexuality, women sterility, post-partum insusceptibility and contraceptive use.
3.7.2 Focus group discussion
This was a set of guiding questions prepared to cover topic such as: education,
employment, ideal number of children, religion, contraceptive use, women sexuality and post-partum insusceptibility. The aim of the focus group discussions (FDG) was to supplement the quantitative data. Two focus group discussions were done, each
3.7.3 Data collection
Data collection was done in October 2013, where out of 216 questionnaires, 210 were
returned properly filled. The research assistants were picked with the help of the district statistics officer from enumerators who conducted the census survey in 2009. The assistants were trained in one day and daily meetings were conducted to ensure smooth
running of the data collection process. Chiefs and village elders were informed prior to the visits for logistical preparations. Each morning the enumerators assembled at the
middle of the village guided by a village elder. A pen was tossed and the households in the direction pointed by the nib were sampled until the required number of house hold was attained.
3.8 Pilot study and testing for validity and reliability
Before the actual data collection was done a pilot study was conducted to test for
validity (the extent to which a tool measures what it was supposed to measure) and reliability (the degree to which a tool consistently measures whatever it measures) of
the tools to be used in collecting data. 20 questionnaires were administered in the different sub locations and necessary changes were made on the tools to ensure the data
collected was accurate.
3.9 Data management and analysis
Data collected by questionnaires was coded, spot checked for error, and entered into an SPSS (V.17) data base where calculation of measures of central tendency (mean and median) and percentages was done. Qualitative data from the key informant interview
several areas such as to draw a comparison between post-partum amenorrhea and breast feeding, it was also used to establish the duration of post-partum abstinence among women in the division. Percentages were used to show the age distribution of secondary
sterile women, to show the percentages of contraceptive use by age groups among other areas. The proximate determinant model as modified by Stover (1998) was further used
in the analysis to measure the depressing effect of the proximate determinants. The revised model included women‟s sexuality, it uses data on the proportion of women
15-49 years who are sexually active in the last 30 days. It intended to show the reduction in
fertility effect caused by the fact that women are not sexually active throughout the entire period of reproduction. The other proximate determinants that were analysed
using the model included: women sterility, post-partum insusceptibility and contraceptive use. The analysed data was then presented in tables and a discussion followed in chapter four.
3.10 Ethical consideration
Authorisation to carry out the study research was acquired from the Kenyatta University and the National Council for Science and Technology. Community entry for the data collection was done through the County Director of Education, District Commissioner,
District Officers, area Chiefs, Sub Chiefs and village chairmen. Participation in the study was on voluntary basis and anonymity was assured; consent was asked before the
CHAPTER FOUR
4
RESULTS AND DISCUSSION ON THE PROXIMATE AND
NON- PROXIMATE DETERMINANTS OF FERTILITY
4.1 IntroductionThis chapter presents the findings and carries out a discussion based on them. To start with, the demographic characteristics of the respondents are explained. This is followed by an analysis on the inhibiting effects of the proximate determinants of fertility after
which the computation of the total fertility rate of the division was done. A result based discussion on the relationship between the proximate and non-proximate determinants
of fertility was then carried out.
4.2 Demographic characteristics of the respondents
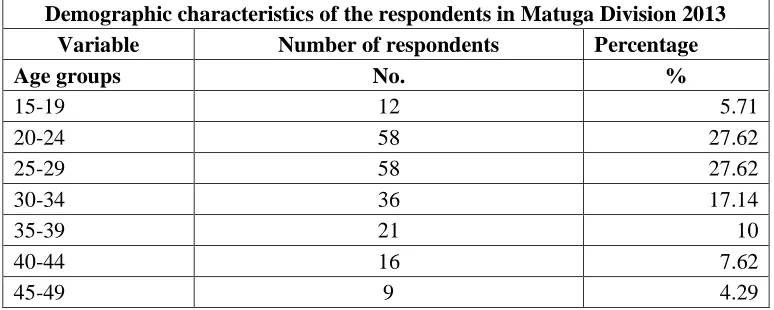
Table 4.1: Demographic characteristics of the respondents in Matuga Division
Demographic characteristics of the respondents in Matuga Division 2013 Variable Number of respondents Percentage
Age groups No. %
15-19 12 5.71
20-24 58 27.62
25-29 58 27.62
30-34 36 17.14
35-39 21 10
40-44 16 7.62
45-49 9 4.29
From the table above, more than half of the respondents making up 116 of the 210 women interviewed were of the aged between 20-29 years. The age cohorts 20-24 and
4.3 Application of the proximate determinant model
This section shows the application and findings of Stover‟s proximate determinants
model as it was used in this study. The model‟s main objective was to establish the reducing effect of the four proximate determinants consisting of women‟s sexuality,
contraceptive use, post-partum insusceptibility and sterility on the fertility rate. It
helped bring out the proximate determinants with the highest and lowest inhibiting effect on fertility. The model also enabled the researcher calculate the total fertility rate
of the area under study. The application of the model was as shown below where the inhibiting effects of contraceptive use, women sexuality, women sterility and
post-partum insusceptibility were calculated as shown next.
The index of women‟s sexuality ( ) was measured to determine the inhibiting effect of
women‟s sexuality on fertility. A woman was considered sexually active if she had had
sex in the last four week preceding the survey, women who were pregnant or abstaining post-partum were also considered to be sexually active. .
= S
Where:
S= the proportion of women aged 15-49 years old sexually active where sexually active means they had sex in the last four weeks or pregnant or abstaining post-partum.
that a total of 72.8% of 210 women interviewed were sexually active. This gives the index of women sexuality as approximately 0.73.
Thus: = 0.73.
The second proximate determinant of fertility used in the study was post-partum insusceptibility. Its inhibiting effect on fertility was computed as follows:
= 20/ (18.5+i)
Where:
i - is the average duration of post-partum amenorrhea and post –partum abstinence
= 20/ (18.5 + i)
= 20/ (18.5+ (2.59+6.9)
= 20/ (18.5+9.49)
= 20/27.99
= 0.72
This means that post-partum insusceptibility has a depressing effect of 0.72 on the fertility of Matuga division.
The index of women‟s sterility as a proximate determinant of fertility used in this study
was calculated as follows: