O R I G I N A L R E S E A R C H
A new predictor is comparable to the updated
nomogram in predicting the intermediate- and
high-risk prostate cancer but outperforms
nomogram in reducing the overtreatment for the
low-risk Pca
This article was published in the following Dove Press journal: Cancer Management and Research
Hui Wang1–3 Sheng Tai1,2 Li Zhang1,3 Jun Zhou1–3 Chaozhao Liang1–3
1Department of Urology, The First
Affiliated Hospital of Anhui Medical University, Hefei, People’s Republic of China;2Anhui Province Key Laboratory
of Genitourinary Diseases, Anhui Medical University, Hefei, People’s Republic of China;3The Institute of Urology, Anhui
Medical University, Hefei, People’s Republic of China
Purposes: To develop a new predictor and update nomogram based on prostate imaging
reporting and data system version 2 (PI-RADS V2) in predicting intermediate- and high-risk prostate cancer (IH-Pca) and reducing the overtreatment for low-risk Pca (L-Pca).
Methods: All men that underwent trans-rectal ultrasound-guided 12+X-core prostate biopsy
between January 2015 and June 2018 were collected and analyzed. The significant risks (SRs) of Pca were selected by univariate and multivariate analysis. All SRs were divided into four groups (0 to 3 points) based on the probability of PI-RADS. Each patient can obtain a total score (TS). The updated nomogram was established by R package version 3.0. The area under the curve (AUC), net reclassification index (NRI), calibration curves and decision curves were used to evaluate the diagnostic performance.
Results: There were 1,078 patients, including 640 (59%) men with normal or L-Pca (N-LPca)
and 438 (41%) men with IH-Pca. The scores of TS for IH-Pca and N-LPca were 16.13±3.11 and 10.52±3.32, respectively (P<0.01). The discriminative power of TS and nomogram was compar-able in predicting IH-Pca (AUCs: 0.88 vs 0.87,P=0.89), and both were greater than PSA and PI-RADS (AUCs: 0.76 vs 0.80). For NRI, NRITS vs nomogramwas 1.31% (P=0.55), NRITS vs PSAwas
24.13% (P<0.001) and NRITS vs PI-RADSwas 13.19% (P<0.001). Compared with PSA, PI-RADS
and nomogram, TS can reduce the number of unnecessary biopsies, up to 71%, 60% and 38%, respectively.
Conclusion: The new predictor is comparable to the updated nomogram in predicting IH-Pca,
and both are better than PSA and PI-RADS. In addition, the new predictor slightly outperforms nomogram in reducing the unnecessary biopsies for L-Pca and being convenient to use.
Keywords:age, PSA, PSA density, prostate cancer detection, PI-RADS, nomogram
Introduction
Many types of research suggested that men with clinically significant prostate cancer (CS-Pca) (Gleason score 3+4 or higher) need to be treated immediately, while those men with low-risk prostate cancer (L-Pca) can be selected to receive active surveillance (AS).1–4At present, Pca diagnosis relies mainly on traditional detection measures, such as prostate-specific antigen (PSA), digital rectal examination (DRE) and magnetic resonance imaging (MRI). For men at risk of Pca, a systematic trans-rectal ultrasound
Correspondence: Chaozhao Liang Department of Urology, The First Affiliated Hospital of Anhui Medical University, No. 218 Jixi Road, Hefei 230022, Anhui, People’s Republic of China Tel +86 551 6292 3440 Fax +86 551 6363 3742
Email [email protected]
Cancer Management and Research
Dove
press
open access to scientific and medical research
Open Access Full Text Article
Cancer Management and Research downloaded from https://www.dovepress.com/ by 118.70.13.36 on 20-Aug-2020
(TRUS)-guided biopsy is a most common way to obtain the pathology for a definite diagnosis. Unfortunately, these tradi-tional tests performed imperfectly in the diagnosis of Pca, especially in that of intermediate- and high-risk prostate cancer (IH-Pca), which resulted in a considerable number of unnecessary biopsies and overtreatment for men with normal or L-Pca (N-LPca).5
With the widespread use of traditional tests, we have noted that more and more men are undergoing unnecessary biopsies, and lots of men with L-Pca are founded.6,7 It is well known that L-Pca does not usually become a clinically relevant event in short periods of time when left untreated. Therefore, the diagnosis and subsequent treatment of L-Pca can also be called overdiagnosis and overtreatment.5In brief, men with L-Pca do not need to be discovered in time, while those with IH-Pca, in contrary, should be taken seriously.
Previous studies have found that prostate imaging reporting and data system version 2 (PI-RADS v2) is an excellent measure to predict the probability of Pca and has better performance in identifying patients with CS-Pca.8In addition, nomogram described in 1908 is an another way to predict the probability of Pca, with better performance than PSA and MRI in detecting indolent Pca and L-Pca.9,10Nomogram is constituted by three parts, includ-ing the points of each risk, total points and risk probability. However, it is inconvenient to adopt nomogram in out-patient, and you might need to use a calculator or compu-ter program to obtain the probability of risks. In view of this, our research is attempting to develop a new PI-RADS -based approach featuring higher predictive capability and more convenient use.
Methods
Patients
Patients with abnormal findings on PSA, DRE or MRI were definitely diagnosed by TRUS-guided 12+X-core prostate biopsy in our institute between January 2015 and June 2018 (n=1,235). We collected the clinical data and retrospectively analyzed the relationship between the risks and IH-Pca. Previous studies reported by Presti were referred to for the steps and locations of biopsy.11 Pathological results were obtained by TRUS-guided biopsy, and part of the results was corrected by the pathol-ogy of radical prostatectomy (RP) for men undergoing RP at our center. In addition, we also collected the data from our database for men who underwent RP between
July 2018 and December 2018 to validate our new pre-dictor (n=96). The eighth edition of the TNM staging classification for prostate cancer was used to assign the clinical stage based on the multiparametric magnetic reso-nance imaging (MP-MRI), DRE and pathology. People with insufficient data were eventually excluded as follows (n=157): MRI (n=91), free-PSA (n=42), and the vague pathology (n=24). A total of 1,078 evaluable patients were involved in establishing the new predictor and 96 patients were used to validate the performance of a new predictor.
This study was approved by Ethics Committees Regarding Human Research of the First Affiliated Hospital of Anhui Medical University (Approved ID: PJ-20170906). All experiments were in compliance with relevant guidelines and the Declaration of Helsinki. The data involved in this research was retrospectively collected from hospital electro-nic system and did not include the use of tissue samples and other samples, and the study did not include any personal information or privacy. For these reasons, it was not applic-able to the informed consent of study participators, which was also exempted by the Ethics Committee.
Risks collection and exclusion
Pca risks were recommended by the Guidance on Diagnosis and Treatment of Urology of Chinese, including age, PSA, PSA density (PSAD), fPSA, %fPSA, prostate volume (PV), DRE and MP-MRI. In addition, the valuable indicators that were previously reported by others were also collected, such as neutrophil, platelets, neutrophil to lymphocyte ratio (NLR) and body mass index (BMI).12,13 Univariate analysis wasfirst used tofiltrate indicators in order to obtain the independent risk factors of Pca. Next, multivariate stepwise regression analysis was employed to determine which factors are the independent risk factors for Pca in the model-building set. Finally, the satisfactory indicators were used to develop the models.
Development of nomogram and new
predictor
R package version 3.0 (https://www.r-project.org) was adopted to build the nomogram relying on the satisfactory indicators. Then, total points and corresponding risk probabil-ity of Pca were calculated and utilized to predict the IH-Pca.
For new predictor, the values of all indicators were standardized by logarithmic transformation. Then, logistic regression was used to calculate the equation coefficients
Cancer Management and Research downloaded from https://www.dovepress.com/ by 118.70.13.36 on 20-Aug-2020
and OR, which were regarded as the weight coefficient of each indicator in the model. We used logistic regression to convert all indicators into the probability of predicting Pca. All indicators were divided into four groups: 1) unlikely to have Pca RADS 1 and 2 points); 2) equivocally (PI-RADS 3 points); 3) likely (PI-(PI-RADS 4 points) and 4) highly likely (PI-RADS 5 points). The four groups scored differ-ently depending on the possibility of Pca (0 to 3, unlikely to highly likely). We calculated the probability of PI-RADS in the above four groups, and 95% CI of mean for other indicators that have the same probability interval with PI-RADS was calculated and the upper bound of 95% CI was regarded as the boundary among groups.
The threshold of 0-score group is the normal value of each indicator. In addition, for the age grouping, the nor-mal group was aged 50 or below, which was recommended by Chinese Urological Guidelines. PSA grouping not only relied on the mean and 95% CI but also referenced the D’Amico risk group classification: low risk (<10 ng/mL), moderate risk (10-20 ng/mL) and high risk (>20 ng/mL),14 and we appropriately regulated the threshold of high risk to 26 ng/mL based on our data. Finally, according to the weight coefficient, the total score (TS) of new predictor for each patient is the sum of the product of each indicator’s score with the weight coefficient, and TS was performed to predict the Pca or IH-Pca.
Category and thresholds
According to the D’Amico risk classification, the criteria of L-Pca are as follows: 1) PSA <10 ng/mL; 2) Gleason score <7 and 3) clinical stage < T2b. Men with Pca who do not simultaneously meet the above conditions are regarded as having IH-PCa. The criteria of Prostate Cancer Research International Active Surveillance (PRIAS) are as follows: 1) PSA ≤10 ng/mL; 2) Gleason score <7; 3) clinical stage≤T2c; 4) 1 or 2 cores with Pca and 5) PSAD
≤0.2 ng/mL2. The criteria of significant prostate cancer are as follows: 1) tumor volume >0.5 mL; 2) extracapsular extension (ECE); 3) seminal vesicle invasions (SVI) and 4) Gleason score ≥7.
All people were divided into two groups based on the pathology of biopsy and RP: IH-Pca and non-IH-Pca (nor-mal or L-Pca). Besides, the cohort was also divided into the other two groups depending on the thresholds for predicting IH-Pca: negative test group and positive test group. The thresholds of a positive test are as follows: PSA>10 ng/mL, PI-RADS >2 points, PSAD>0. 15 ng/ mLl2, nomogram risk >0.40 and TS>13.
Statistical analysis
Univariate analysis and multivariate stepwise regression ana-lysis were used to filter indicators. To compare the perfor-mance of detecting Pca, we calculated the Youden’s index, positive predictive value (PPV) and overall accuracy relying on the thresholds. PSA, PI-RADS, nomogram and TS as diagnostic methods were assessed in terms of the ability of predicting Pca and IH-Pca before biopsy by ROC curves and decision curve analysis (DCA) generated by Vickers.15The area under the curve (AUC) was calculated and compared by Z test. The maximal point of the sum of sensitivity and
speci-ficity determined the optimal threshold. The net reclassification index (NRI) was calculated and tested by Z-test, which could reveal the performance in correctly reclassifying the patients. Calibration curves were utilized to show the extent of over- or underestimation of the predictive methods. Besides, we used the calibration with 1,000 bootstrap samples to decrease the overfit bias. Statistical significance was considered atP<0. 05. The statistical analysis was performed with SPSS version 23.0 and package R version 3.0. (https://www.r-project.org).
Results
Patient demographics
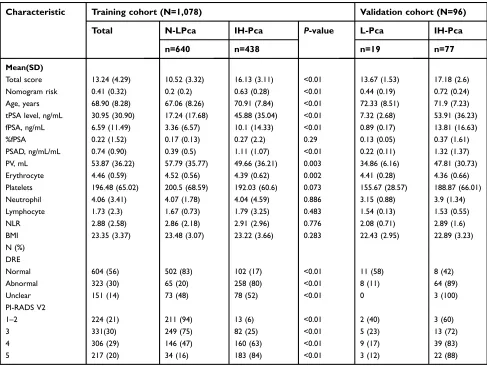
In general, this study involved 1,078 patients, including 544 men with Pca (51%), 534 men without Pca (49%), 438 men with IH-Pca (41%) and 640 men with N-LPca (59%). The incidence of Pca and IH-Pca was rising with the age, PSA, PI-RADS, nomogram and TS increasing, which were detailed in Table 1. Besides, we collected the data from our database for men that underwent RP to validate the new predictor and nomogram in predicting IH-Pca (n=96), including 19 patients with L-Pca and 77 patients with IH-Pca. The distribution of demographics and biopsy cores in different Gleason score, clinical stage and D’Amico risk is shown in Table 2. Men with IH-Pca can be definitely diagnosed with fewer biopsy cores and more positive cores. The biopsy cores for mean in all patients, normal patients and patients with Pca were 12.15, 12.38 and 11.92, respectively, Table 2.
Data collection and analysis
The risks of Pca were collected, including age, PSA, PSAD, PV, fPSA, f/tPSA, DRE, PI-RADS, erythrocyte, neutrophil, NLR, lymphocyte, platelets and BMI. Then, f/t PSA (P=0.29), neutrophil (P=0.89), lymphocyte (P=0.48), NLR (P=0.78) and BMI (P=0.28) were excluded in univariate analysis, and fPSA (P=0.09), DRE (P=0.15), erythrocyte (P=0.23) and platelets (P=0.32) were excluded from the models in multivariate
Cancer Management and Research downloaded from https://www.dovepress.com/ by 118.70.13.36 on 20-Aug-2020
analysis. Finally, age, tPSA, PSAD, PV and PI-RADS (P<0.05) were entered into the models by univariate analysis and further multivariate analysis.
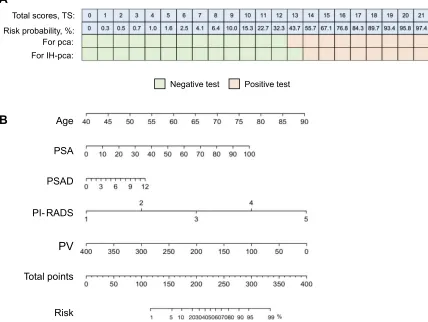
Nomogram and a new predictor (TS)
Nomogram that consisted of age, tPSA, PSAD, PV and PI-RADS was built, and the risk probabilities were calculated by R package, Figure 1B. The grouping and thresholds of a new predictor are shown in Table 3 and Figure 1A. Based on the equation coefficient and OR (Exp (B)), the ratio of the weight coefficient of age, PSA, PSAD, PVand PI-RADS was 1: 1: 1: 1: 3, respectively. So, PI-RADS scored 3 times as many as other risks. The probability of PI-RADS including PI-RADS 1 and 2 points (normal), 3 points (equivocally), 4 points (likely) and 5 points (highly likely), respectively, was ≤15%,15–40%, 40–65% and >65%, and the mean and the 95% CI in the above four probability intervals were calculated (Table 3).
Each patient can get a TS ranging from 0 to 21 points. For IH-Pca, the screening threshold of TS was 14 points or higher (Figure 1A) and the threshold of nomogram was 0.40 or higher (Figure 1B).
Comparison between TS and nomogram
TS achieved the AUC of 0.88, which was comparable to nomogram (AUC: 0.87),P=0.55, and both of them were higher than the PSA and PI-RADS (AUCs: 0.79 and 0.80, respec-tively), P<0.01 (Tables 4 and 5, Figure 2A). There was no difference between TS and nomogram on the DCA, Figure 2C. In addition, we also calculated the NRI, OR, PPV and overall accuracy to compare the performance of prediction between TS and nomogram, and the above results all suggested that the ability of TS in distinguishing the IH-Pca was similar to that of nomogram but outperformed the PSA and PI-RADS, Tables 4 and 5.
Table 1The clinical characteristics, demographics and pathologicalfindings of all men
Characteristic Training cohort (N=1,078) Validation cohort (N=96)
Total N-LPca IH-Pca P-value L-Pca IH-Pca
n=640 n=438 n=19 n=77
Mean(SD)
Total score 13.24 (4.29) 10.52 (3.32) 16.13 (3.11) <0.01 13.67 (1.53) 17.18 (2.6) Nomogram risk 0.41 (0.32) 0.2 (0.2) 0.63 (0.28) <0.01 0.44 (0.19) 0.72 (0.24) Age, years 68.90 (8.28) 67.06 (8.26) 70.91 (7.84) <0.01 72.33 (8.51) 71.9 (7.23) tPSA level, ng/mL 30.95 (30.90) 17.24 (17.68) 45.88 (35.04) <0.01 7.32 (2.68) 53.91 (36.23) fPSA, ng/mL 6.59 (11.49) 3.36 (6.57) 10.1 (14.33) <0.01 0.89 (0.17) 13.81 (16.63) %fPSA 0.22 (1.52) 0.17 (0.13) 0.27 (2.2) 0.29 0.13 (0.05) 0.37 (1.61) PSAD, ng/mL/mL 0.74 (0.90) 0.39 (0.5) 1.11 (1.07) <0.01 0.22 (0.11) 1.32 (1.37) PV, mL 53.87 (36.22) 57.79 (35.77) 49.66 (36.21) 0.003 34.86 (6.16) 47.81 (30.73) Erythrocyte 4.46 (0.59) 4.52 (0.56) 4.39 (0.62) 0.002 4.41 (0.28) 4.36 (0.66) Platelets 196.48 (65.02) 200.5 (68.59) 192.03 (60.6) 0.073 155.67 (28.57) 188.87 (66.01) Neutrophil 4.06 (3.41) 4.07 (1.78) 4.04 (4.59) 0.886 3.15 (0.88) 3.9 (1.34) Lymphocyte 1.73 (2.3) 1.67 (0.73) 1.79 (3.25) 0.483 1.54 (0.13) 1.53 (0.55) NLR 2.88 (2.58) 2.86 (2.18) 2.91 (2.96) 0.776 2.08 (0.71) 2.89 (1.6) BMI 23.35 (3.37) 23.48 (3.07) 23.22 (3.66) 0.283 22.43 (2.95) 22.89 (3.23) N (%)
DRE
Normal 604 (56) 502 (83) 102 (17) <0.01 11 (58) 8 (42)
Abnormal 323 (30) 65 (20) 258 (80) <0.01 8 (11) 64 (89)
Unclear 151 (14) 73 (48) 78 (52) <0.01 0 3 (100)
PI-RADS V2
1–2 224 (21) 211 (94) 13 (6) <0.01 2 (40) 3 (60)
3 331(30) 249 (75) 82 (25) <0.01 5 (23) 13 (72)
4 306 (29) 146 (47) 160 (63) <0.01 9 (17) 39 (83)
5 217 (20) 34 (16) 183 (84) <0.01 3 (12) 22 (88)
Abbreviations:N-Pca (Pca), non-Pca (prostate cancer); N-LPca, normal men and low-risk Pca; IH-Pca, intermediate- and high-risk Pca; t(f)PSA, total (free) prostate-specific
antigen; %fPSA, the ratio between tPSA and fPSA; PSAD, PSA density; PV, prostate volume; NLR, neutrophil to lymphocyte ratio; BMI, body mass index; DRE, digital rectal examination; PI-RADS V2, prostate imaging reporting and data system version 2.
Cancer Management and Research downloaded from https://www.dovepress.com/ by 118.70.13.36 on 20-Aug-2020
In terms of reducing unnecessary biopsies and over-treatment for L-Pca, TS was better than nomogram, let alone for PSA and PI-RADS. For N-LPca men with nega-tive test on TS, their posinega-tive tests on nomogram, PSA and PI-RADS accounted for 38%, 71% and 60%, respectively (Figure 3A), which suggested that TS can prevent these men from biopsy. Besides, the distribution of men with N-LPca under the different screening methods was revealed by scatter diagram (Figure 3B) and the distribu-tion of TS and nomogram risk in the different groups of D’Amico risks was shown by box plot (Figure 4A and B).
Validation in cohort with RP
In order to reduce the bias caused by biopsy pathology, we validated the performance of TS and nomogram in predicting Pca and significant Pca for people who underwent RP in our center between January 2015 and June 2018 (n=332), includ-ing 221 men (66%) with significant Pca and 111 men (34%) with insignificant Pca. We found that TS was slightly better than nomogram in predicting the significant Pca (AUCs: 0.73 vs 0.70) and in predicting IH-Pca (AUCs: 0.88 vs 0.87), Figure 2B and D, and the overall accuracy of TS and nomogram were 85.1% and 83.8%, respectively. Besides, we used a validation cohort (n=96) to show the performance of a new predictor and nomogram in predicting IH-Pca. We also obtained excellent results, with AUC of 0.86 and 0.85, respectively, and with an overall accuracy of 82.1% and 82.3% respectively.
In addition, we also evaluated the ability of TS and nomogram in selecting eligible men for AS by another criterion of PRIAS. Men who were normal or met the criteria of PRIAS were regarded eligible for AS. The results indicated that TS was comparable to nomogram with AUC of 0.88 and 0.87, respectively (Figure 2E), and the overall accuracy of TS and nomogram was 78.9% and 78.4%, respectively. Both were better than PSA (59%) and PI-RADS (67%).
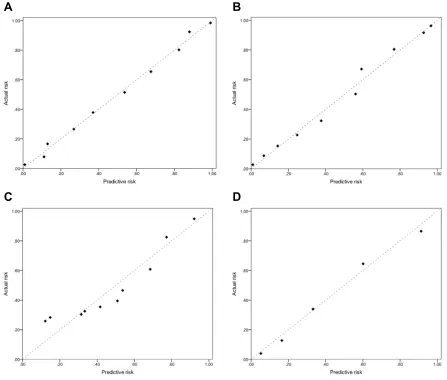
Calibration
Calibration curves were used to illustrate the predicted consistency between actual risks and predictive risks, Figure 5A–D. From each calibration plot, we can know that TS and nomogram had the advantage of high good-ness of fit. In other words, predictive risks of TS and nomogram were closely linked to the actual risks.
Discussion
At present, the consensus on Pca was early detection and treatment,6which contributed to the more favorable prog-nosis. Therefore, widespread PSA screening was utilized to detect Pca in order to find Pca in time. Consequently, more and more men were undergoing unnecessary biopsies.5 Many studies have shown that L-Pca would not influence the lifetime and could be followed by AS rather than be treated immediately.3,4 If there is a predictive method that can identify L-Pca before biopsy, these men with L-Pca can avoid biopsy, and thus be relieved from the burden of economy and psy-chology. For men with IH-Pca, they should be diagnosed and treated as early as possible. Therefore, it is time to
find out a way to identify L-Pca and IH-Pca. The new predictor has pretty decent ability in identifying IH-Pca and reducing overdiagnosis for normal and L-Pca men as well.
Nomogram was first described in 1908, and there were lots of studies about the performance of nomogram in predicting Pca.9,10,15–19 All these research had a common conclusion that nomogram outperforms any single predictor in forecasting Pca, such as PSA, PSAD, PI-RADS and so on. Besides, using nomogram to pre-dict indolent Pca and CS-Pca was previously reported.10,15 From these research, we believe that nomogram has a bright prospect in the diagnosis and making treatment decision for Pca. However, there was no nomogram constituted by age, PSA, PSAD, PV and
Table 2 Distribution of demographics and biopsy cores in
dif-ferent Gleason score, clinical stage and D’Amico risk
Characteristic Number of
patients (%)
Mean (SD)
Biopsy cores
Positive cores
Total 1078 12.15 (1.31) 3.39 (4.25) N-Pca 534 (49) 12.38 (0.87) -Pca 544 (51) 11.92 (1.60) 6.59 (3.75) Gleason score
≤6 107 (20) 12.40 (0.66) 3.2 (2.46) 7 160 (29) 12.01 (1.57) 5.91 (3.47)
≥8 277 (51) 11.69 (1.82) 8.26 (3.30) Clinical stage
≤T2a 146 (27) 12.25 (1.25) 2.18 (1.57) T2b 155 (29) 11.43 (2.22) 5.41 (1.65)
≥T2c 243 (44) 12.03 (1.21) 9.98 (2.05) D’Amico risk
Low 28 (5) 12.25 (0.75) 2.36 (1.93) Intermediate 113 (21) 12.50 (0.94) 4.10 (2.81) High 403 (74) 11.73 (1.75) 7.58 (3.55)
Abbreviation:N-Pca (Pca), non-Pca (prostate cancer).
Cancer Management and Research downloaded from https://www.dovepress.com/ by 118.70.13.36 on 20-Aug-2020
PI-RADS in predicting IH-Pca for Chinese. Therefore, we used the above risks to establish a new nomogram, which demonstrated satisfying performance.
Apart from nomogram, there were other predicting tools for Pca detection, such as the European Randomized Study for Screening of Prostate Cancer Risk
Total scores, TS:
Risk probability, %: For pca: For IH-pca:
Negative test Positive test
PI- RADS PSAD PSA Age
PV
Total points
Risk
A
B
Figure 1The thresholds for predicting Pca and IH-Pca and the updated nomogram. (A) The new predictor and screening thresholds. (B) The updated nomogram.
Abbreviations: Pca, prostate cancer; IH-Pca, intermediate- and high-risk Pca; PSA, prostate-specific antigen; PSAD, PSA density; PV, prostate volume; PI-RADS, prostate
imaging reporting and data system.
Table 3The regression probability of PI-RADS in predicting Pca and the upper bound of 95% CI for mean under the regression
probability of PI-RADS
Indicators 0 point 1 point 2 points 3 points
Unlikely (normal) Equivocally Likely Highly likely
PI-RADS v2 1–2 3 4 5
Regression probability ≤0.15 0.15–0.40 0.40–0.65 >0.65
Grouping boundary Main indicators
PSA (ng/mL) 0–4 4–10 10–26 >26
PSAD (ng/mL2) ≤0.15 0.16–0.20 0.20–0.60 >0.60
PI-RADS* 1–2 3 4 5
Auxiliary indicators
Age (years) <50 50–58 59–70 >70
PV (mL) >454 232–454 42–232 <42
Note: *This variable has 3 times the point of the other variables.
AbbreviationsPSA, prostate-specific antigen; PSAD, PSA density; PV, prostate volume; PI-RADS v2, prostate imaging reporting and data system version.
Cancer Management and Research downloaded from https://www.dovepress.com/ by 118.70.13.36 on 20-Aug-2020
Calculator, Korean Prostate Cancer Risk Calculator, Indonesian Prostate Cancer Risk Calculator and Prostate Cancer Prevention Trial Risk Calculator. These tools mainly consisted of age, PSA level, PV, family history, DRE and previous biopsies.20 Chinese Prostate Cancer Consortium Risk Calculator may be more suitable for Chinese,21which includes risks of age, PSA, %fPSA, PV and DRE. However, none of the above calculators used the latest PI-RADS studies to replace DRE, and the risk of PV was estimated by DRE based. Currently, MRI, in China, has been mainly used for identifying men with abnormal
findings on DRE or elevated value of PSA, which is mainly related to its time and economic costs. PI-RADS v2 is based on the probability to predict Pca, includingfive stages (1 to 5 points). Many studies had suggested that PI-RADS v2 has excellent ability in predicting Pca.22,23 So our research included PI-RADS in the updated nomogram
and the new predictor, which highlighted the superiority of PI-RADS v2 in IH-Pca prediction and obtained decent values of AUC in forecasting IH-Pca (0.87 and 0.88).
Whether L-Pca men should be treated or not is con-troversial. As relevant researches go, the opinion that men with L-Pca should be followed by AS instead of being initially treated was accepted by more experts.3,4 Hayes carried out a comprehensive analysis of AS and initial treatment for L-Pca.4 The results suggested that AS was associated with the greatest quality-adjusted life expectancy (QALE), but individual preferences for receiving AS or treatment were highly related to QALE gains. Therefore, one of the aims of our research is to approximately assess whether suspected Pca men are with L-Pca. If so, we can consult with patients about their preference: undergoing a prostate biopsy to be definitely diagnosed or receiving AS at regular intervals.
Table 4Performance of PSA, PI-RADS, nomogram and TS in predicting the IH-Pca
Evaluation indexes PSA PI-RADS Nomogram TS
Youden’s index 0.32 0.45 0.56 0.57
Likelihood ratio 170.97 285.36 388.13 398.75
PPV, % 59 64 70 71
OR (95%CI) 7.82 (5.50–11.12) 14.42
(9.89–21.02)
16.19 (11.76–22.30)
20.11 (14.03–28.82)
Overall accuracy,% 66 72 77 78
AUC (95%CI) for all cancer 0.75 (0.72–0.78)
0.80 (0.78–0.83)
0.87 (0.85–0.89)
0.87 (0.85–0.89) AUC (95%CI) for GS >6 0.77
(0.74–0.80)
0.81 (0.79–0.84)
0.87 (0.85–0.89)
0.88 (0.85–0.89) AUC (95%CI) for Cs≥T2b 0.79
(0.76–0.82)
0.80 (0.77–0.83)
0.87 (0.84–0.89)
0.87 (0.85–0.89)
Abbreviations:IH-Pca, intermediate- and high-risk Pca; PSA, prostate-specific antigen; PSAD, PSA density; PI-RADS, prostate imaging reporting and data system; TS, total
scores; PPV, positive predictive value; AUC, area under the curve; GS, Gleason score; CS, clinical stage.
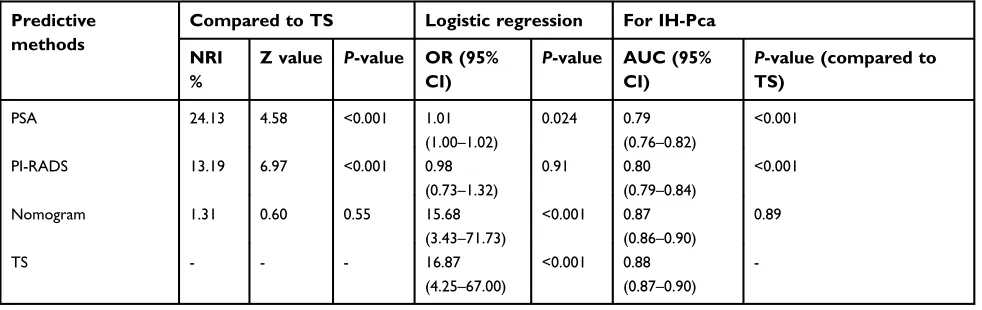
Table 5The value of NRI, OR and AUC of predictive methods in predicting the IH-Pca
Predictive methods
Compared to TS Logistic regression For IH-Pca
NRI %
Z value P-value OR (95%
CI)
P-value AUC (95%
CI)
P-value (compared to
TS)
PSA 24.13 4.58 <0.001 1.01
(1.00–1.02)
0.024 0.79 (0.76–0.82)
<0.001
PI-RADS 13.19 6.97 <0.001 0.98 (0.73–1.32)
0.91 0.80 (0.79–0.84)
<0.001
Nomogram 1.31 0.60 0.55 15.68
(3.43–71.73)
<0.001 0.87 (0.86–0.90)
0.89
TS - - - 16.87
(4.25–67.00)
<0.001 0.88 (0.87–0.90)
-Abbreviations:NRI, net reclassification index; TS, total score; IH-Pca, intermediate- and high-risk Pca; PSA, prostate-specific antigen; PSAD, PSA density; PI-RADS,
prostate imaging reporting and data system; AUC, area under the curve.
Cancer Management and Research downloaded from https://www.dovepress.com/ by 118.70.13.36 on 20-Aug-2020
If we can do that, not only the unnecessary biopsies will be greatly reduced but also patients’ decision on treat-ment plan will be completely respected. In our research, both the new predictor and the updated nomogram have better ability to identify IH-Pca than PSA or PI-RADS alone.
Comparable to the updated nomogram in identifying IH-Pca, the new predictor has several advantages over the updated nomogram. First, the new predictor can reduce unnecessary biopsies for N-LPca men whose test of nomogram is positive, up to 38%. Second, when using the nomogram to assess the probability of IH-Pca, we need to calculate a score for each indicator and add these score to get a TS.Based on the total scores, we obtain the probability of IH-Pca from the nomogram scale. The steps described above have to resort to computer program or scale-plate to calculate, because different values of indicators in the nomogram are corresponding to different scores. On the contrary, the new predictor is used according to the reference range to evaluate the probability of IH-Pca. Users only
need to remember the value of boundary. In this sense, it is more convenient to use in the outpatient department.
Finally, our study also has several limitations. First, the study was a retrospective single-center study. Second, some people with PSA located on the gray area (PSA from 4 to 10ng/mL) refused to take further medical plan and preferred to choose follow-up observation, which made the number of these people decrease in the study. Third, although part of the pathological results was obtained from RP, most men with Pca were pathologically identified by TRUS biopsy, which may lead to a decrease in the number of IH-Pca so that the predictive accuracy of models would be underestimated.24,25
Conclusion
The new predictor is comparable to the updated nomo-gram in predicting the IH-Pca, and both are better than PSA and PI-RADS. In addition, the new predictor slightly outperforms nomogram in terms of reducing
E
D
C
B
A
0.0 0.2 0.4 0.6 0.8 1.0 0.0 0.2 0.4 Sensitivity Sensitivity Sensitivity Sensitivity Net benefit 0.6 0.8 1.0 Screening methods Screening methods TS Nomogram PSA PI-RADS Screening methods1 - specificity 1 - specificity
1 - specificity 1 - specificity
Thershold probability, Pt
TS Nomogram Screening methods TS Nomogram TS Nomogram PSA PI-RADS Screening methods TS Nomogram PSA PI-RADS 0.0 0.2 0.4 0.6 0.8 1.0 0.0
0.0 0.2 0.4 0.6 0.8 1.0 .00 .00 .10 .20 .30 .40 .50
.20 .40 .60 .80 1.00 0.0 0.2 0.4 0.6 0.8 1.0
0.0 0.2 0.4 0.6 0.8 1.0 0.0 0.2 0.4 0.6 0.8 1.0 0.2
0.4 0.6 0.8 1.0
Figure 2The predictive performance of different methods. (A) The area under the curve (AUC) is used to compare the predictive power in predicting IH-Pca. (B) The
AUC is performed to show the predictive power in predicting IH-Pca in population with radical prostatectomy. (C) The decision curve analysis is showing the predictive power in predicting IH-Pca. (D) The AUC is utilized to illustrate the performance of predicting significant Pca in cohort with radical prostatectomy. (E) Using AUC is to show the ability in forecasting the men following the criteria of PRIAS.
Abbreviations:Pca, prostate cancer; IH-Pca, intermediate- and high-risk Pca; PRIAS, Prostate Cancer Research International Active Surveillance.
Cancer Management and Research downloaded from https://www.dovepress.com/ by 118.70.13.36 on 20-Aug-2020
unnecessary biopsies and being convenient to use. Therefore, this predictor is a promising approach to assisting doctors or patients in making a decision: receiving AS or having a biopsy immediately for men at risk of Pca.
Acknowledgments
This study was funded by the National Natural Science Foundation of China (No. 81630019, 81870519), Scientific Research Foundation of the Institute for Translational Medicine of Anhui Province (2017ZHYX02).
72
% 28%
38%
62%
59% 41%
71%
29%
64 %
36 %
60%
40%
Nomogram (+) PSA (+) PI-RADS (+)
IH-Pca N-LPca TS test (-) TS test (+)
T
otal scores,
TS
Positive
Negative
Negative Positive Negative Positive Negative Positive
Nomogram test PSA test PI-RADS test
A
B
Figure 3The distribution of men with N-LPca and with IH-Pca in the different screening methods. (A) The distribution of TS for men with N-LPca or with IH-Pca in
positive tests of nomogram, PSA and PI-RADS. (B) The distribution of TS groups in different screening methods for men with N-LPca.
Abbreviations:N-LPca, normal men or low-risk prostate cancer; IH-Pca, intermediate- and high-risk Pca;TS, total score; PSA, prostate-specific antigen; PI-RADS, prostate
imaging reporting and data system.
A
25 1.00
.80
.60
.40
.20
.00
Normal Low Intermediate High Normal Low Intermediate High
D’Amico risk D’Amico risk
20
15
Total scores, TS 10 Nomogram risk
5
0
B
Figure 4The value and mean of total scores and nomogram. (A) The value and mean of total scores in D’Amico risks. (B) The value and mean of nomogram in D’Amico risks.
Cancer Management and Research downloaded from https://www.dovepress.com/ by 118.70.13.36 on 20-Aug-2020
Disclosure
The authors report no conflicts of interest in this work.
References
1. Huynh MA, Chen MH, Wu J, Braccioforte MH, Moran BJ, D’Amico AV. Gleason score 3+5 or 5+3 versus 4+4 prostate cancer: the risk of death.
Eur Urol. 2016;69(6):976–979. doi:10.1016/j.eururo.2015.08.054 2. Hamdy FC, Donovan JL, Lane JA, et al. 10-year outcomes after
monitoring, surgery, or radiotherapy for localized prostate cancer.
N Engl J Med. 2016;375(15):1415. doi:10.1056/NEJMoa1606220 3. Dall MA, Bangma C, Carroll PR, et al. Active surveillance for prostate
cancer: a systematic review of the literature. Eur Urol. 2012;62 (6):976–983. doi:10.1016/j.eururo.2012.05.072
4. Hayes JH, Ollendorf DA, Pearson SD, et al. Active surveillance compared with initial treatment for men with low-risk prostate cancer: a decision analysis.Eur Urol. 2011;59(5):882–883. doi:10.1016/j.eururo.2011.02.015 5. Schra FH, Hugosson J, Roobol MJ, et al. Screening and prostate cancer mortality: results of the European Randomised Study of Screening for Prostate Cancer (ERSPC) at 13 years of follow-up.Lancet. 2014;384 (9959):2027–2035. doi:10.1016/S0140-6736(14)60525-0
6. Chen W, Zheng R, Zeng H, Zhang S, He J. Annual report on status of cancer in China, 2011. Chin J Cancer Res. 2015;27(1):2–12. doi:10.3978/j.issn.1000-9604.2015.01.06
7. Nam RK, Saskin R, Lee Y, et al. Increasing hospital admission rates for urological complications after transrectal ultrasound guided prostate biopsy.J Urol. 2013;189(1):S12–S8. doi:10.1016/j.juro.2012.11.015 8. Park SY, Jung DC, Taik YT, et al. Prostate cancer: PI-RADS version
2 helps preoperatively predict clinically significant cancers.
Radiology. 2016;280(1):106–116. doi:10.1148/radiol.16151133 9. Karakiewicz PI, Benayoun S, Kattan MW, et al. Development and
validation of a nomogram predicting the outcome of prostate biopsy based on patient age, digital rectal examination and serum prostate specific antigen. J Urol. 2005;173(6):1930–1934. doi:10.1097/01. ju.0000158039.94467.5d
10. Roobol MJ, Kattan MW. Prediction of indolent prostate cancer: validation and updating of a prognostic nomogram. J Urol. 2007;177(1):107–112. doi:10.1016/j.juro.2006.08.068
11. Presti JCP, Chang JJ, Bhargava V, et al. The optimal systematic prostate biopsy scheme should include 8 rather than 6 biopsies: results of a prospective clinical trial.J Urol. 2000;163(1):163–167. 12. Ferro M, Musi G, Serino A, et al. Neutrophil, platelets, and eosinophil to
lymphocyte ratios predict gleason score upgrading in low-risk prostate cancer patients.Urol Int. 2019;102(1):43–50. doi:10.1159/000494259
A
C
B
D
Figure 5Calibration curves for the prediction models. (A) Total scores. (B) Nomogram. (C) PSA and (D) PI-RADS.
Abbreviations: PSA, prostate-specific antigen; PI-RADS, prostate imaging reporting and data system.
Cancer Management and Research downloaded from https://www.dovepress.com/ by 118.70.13.36 on 20-Aug-2020
13. Cobelli O, Terracciano D, Tagliabue E, et al. Body mass index was associated with upstaging and upgrading in patients with low-risk pros-tate cancer who met the inclusion criteria for active surveillance.Urol Oncol. 2015;33(5):201.e1–201.e8. doi:10.1016/j.urolonc.2015.02.004 14. Boorjian SA, Karnes RJ, Rangel LJ, Bergstralh EJ, Blute ML. Mayo
Clinic validation of the D‘amico risk group classification for predict-ing survival following radical prostatectomy. J Urol. 2008;179:1354–1361. doi:10.1016/j.juro.2007.11.061
15. Vickers AJ, Cronin AM, Elkin EB, Gonen M. Extensions to decision curve analysis, a novel method for evaluating diagnostic tests, pre-diction models and molecular markers.BMC Med Inform Decis Mak. 2008;8(1):53. doi:10.1186/1472-6947-8-53
16. Grivas N, Wit E, Tillier C, et al. Validation and head-to-head com-parison of three nomograms predicting probability of lymph node invasion of prostate cancer in patients undergoing extended and/or sentinel lymph node dissection. Eur J Nucl Med Mol Imaging. 2017;44(13):2213–2226. doi:10.1007/s00259-017-3788-z
17. Niu XK, He WF, Zhang Y, et al. Developing a new PI-RADS v2-based nomogram for forecasting high-grade prostate cancer.Clin Radiol. 2017;72(6):S0009926016305086. doi:10.1016/j.crad.2016.12.005 18. Greene DJ, Elshafei A, Nyame YA, et al. External validation of
a PCA-3-based nomogram for predicting prostate cancer and high-grade cancer on initial prostate biopsy. Prostate. 2016;76 (11):1019–1023. doi:10.1002/pros.23197
19. Iremashvili V, Soloway MS, Pelaez L, Rosenberg DL, Manoharan M. Comparative validation of nomograms predicting clinically insignif-icant prostate cancer.Urology. 2013;81(6):1202–1208. doi:10.1016/j. urology.2013.01.062
20. Foley RW, Maweni RM, Gorman L, et al. The ERSPC risk calcula-tors significantly outperform the PCPT 2.0 in the prediction of prostate cancer: a multi-institutional study. BJU Int. 2016;15 (3):706–713. doi:10.1111/bju.13437
21. Rui C, Xie L, Wei X, et al. Development and external multicenter validation of Chinese Prostate Cancer Consortium prostate cancer risk calculator for initial prostate biopsy. Urol Oncol. 2016;34 (9):416.e1-.e7. doi:10.1016/j.urolonc.2016.04.004
22. Seo JW, Shin SJ, Taik Y, et al. PI-RADS Version 2: detection of clinically significant cancer in patients with biopsy gleason score 6 prostate cancer. AJR Am J Roentgenol. 2017;209(1):W1–W9. doi:10.2214/AJR.16.16981
23. Washino S, Okochi T, Saito K, et al. Combination of prostate imaging reporting and data system (PI-RADS) score and prostate-specific antigen (PSA) density predicts biopsy outcome in prostate biopsy naive patients.BJU Int. 2016;119(2):225–233. doi:10.1111/ bju.13465
24. Helfand BT, Loeb S, Kan D, Catalona WJ. Number of prostate cancer risk alleles may identify possibly ‘insignificant’ disease.
BJU Int. 2010;106(11):1602–1606. doi:10.1111/j.1464-410X.2010.0 9440.x
25. Miyake H, Sakai I, Harada KI, Hara I, Eto H. Prediction of potentially insignificant prostate cancer in men undergoing radi-cal prostatectomy for clinically organ-confined disease.
Int J Urol. 2005;12(3):270–274. doi:10.1111/j.1442-2042.2005.0 1041.x
Cancer Management and Research
Dove
press
Publish your work in this journal
Cancer Management and Research is an international, peer-reviewed open access journal focusing on cancer research and the optimal use of preventative and integrated treatment interventions to achieve improved outcomes, enhanced survival and quality of life for the cancer patient.
The manuscript management system is completely online and includes a very quick and fair peer-review system, which is all easy to use. Visit http://www.dovepress.com/testimonials.php to read real quotes from published authors.
Submit your manuscript here:https://www.dovepress.com/cancer-management-and-research-journal
Cancer Management and Research downloaded from https://www.dovepress.com/ by 118.70.13.36 on 20-Aug-2020