Article
Evaluating the global state of ecosystems and natural
resources: within and beyond the SDGs
Christopher Dickens1*; Matthew McCartney 1; David Tickner 2; Ian J. Harrison; Pablo Pacheco 4; Brown Ndhlovu1
1International Water Management Institute (IWMI), 127, Sunil Mawatha, Battaramulla, Colombo, Sri Lanka 2World Wildlife Fund (WWF), Living Planet Centre, Woking, UK
3Conservation International, USA
4World Wildlife Fund (WWF), Washington D.C., USA *Correspondence: [email protected] Tel.: +94 76 997 8752
Abstract: The Sustainable Development Goals (SDGs) purport to report holistically on progress towards sustainability and do so using more than 231 discrete indicators with a primary objective to achieve a balance between the environment, social and economic aspects of development. The research question underpinning the analyses presented in this paper is: are the indicators in the SDGs sufficient and fit-for-purpose to assess the trajectory of natural resources towards sustainability? We extracted the SDG indicators that monitor the state of natural resources, or alternately support policy or governance for their protection, and determined if these are adequate to provide the essential data on natural resources to achieve the aims of the SDGs. The indicators are clustered into four natural resource categories; land, water (both marine and freshwater), air and biodiversity. Indicators for monitoring land resources show that the most comprehensive land resource indicator, for degraded land, is not fully implemented and that missing from land monitoring is an evaluation of vegetation health outside of forests and mountains, the condition of soils, and most importantly the overall health of terrestrial ecosystems. Indicators for monitoring water resources have substantial gaps, unable to properly monitor water quality, water stress, many aspects of marine resources and most significantly, the health of fresh and salt water ecosystems. Indicators for monitoring of air have recently become more comprehensive, but linkage to IPCC results would benefit both programmes. Monitoring of biodiversity is perhaps the greatest weakness of the SDG Agenda, having no comprehensive assessment even though narrow aspects are monitored. Again, deliberate linkages to other global biodiversity programmes (e.g. CBD and the Post 2020 Biodiversity Framework; IPBES; Living Planet, etc.) are recommended on condition that data can be defined at a country level. While the SDG list of indicators in support of natural resource is moderately comprehensive, it lacks holistic monitoring in relation to evaluation of ecosystems and biodiversity to the extent that these missing but vital measures of sustainability threaten the entire SDG Agenda. In addition, an emerging issue is that even where there are appropriate indicators, the amount of country-level data remains inadequate to fully evaluate sustainability. This signals the delicate balance between the extent and complexity of the SDG Agenda and uptake at a country level.
Keywords: Sustainability; Sustainable Development Goals; SDG; Resource security; Land; Water; Air; Biodiversity
1. Introduction
There is a tension between the availability of natural resources and conventional pathways to socio-economic development. In order to develop, society needs to exploit natural resources (land,
water, air, biodiversity etc.) and may do so in ways that are entirely sustainable, i.e. where the resource is fully replenished usually by natural processes, or may do so where sustainability is compromised by short-term exploitation [1,2]. The current trends in population growth, changing lifestyles, consumption patterns (including overconsumption with diets relying on a narrow range of crops and livestock), advancing development, and economic activities are ramping up pressures on natural resources which are showing signs of stress, increasing the risk of collapse of natural ecosystems and associated loss of essential services [3,4,5]. Climate change adds further to this stress, with expanding developments using fossil fuels leading to greater carbon emissions, which in turn are altering weather and rainfall patterns and further exacerbating stress on natural resources.
Historically there have been unique cases where natural resources were excessively depleted resulting in the almost complete collapse of society, for example Easter Island [6] and the Mayan civilization [7]. More recent history is showing that we as a society are using resources well beyond the capacity of the globe to provide. Thus the Global Footprint Network [8] calculates that we currently use 1.7 planets to support humanity's demand on Earth's ecosystems, suggesting that society is using up its reserves and likely to be compromising its future. The Planetary Boundary concept [9] estimates that four out of the nine natural resource thresholds, that should not be crossed, have already been transgressed [10] while other assessments suggest that this is an underestimate as water resources should also be recorded as transgressing, as already 80% of the world’s population live in areas where there are high levels of threat to water security [11] and water crises are now ranked as third in the top 10 global risks to the world economy[12]. At a planetary level the WWF’s Living Planet Report demonstrates major declines across many indicators that represent natural resources [13], while a recent paper by Albert et al [14] documents the crisis in detail. That the evidence is becoming plain even at a global level, is illustrated by the scourge of climate change [15], degraded lands [13], degraded water [16] and collapsing biodiversity [17], all of which are associated with degradation of natural resources.
Sustainable development is reliant on the provisions of nature to meet social and economic developmental needs [5,18,19]. The final output of the Rio+20 Conference called for “protecting and managing the natural resource base for economic and social development” [20]. This relationship was well described in the concepts of ecosystem services by the MEA [21] and is now taken further by the IPBES [17] and the Convention on Biological Diversity draft Post-2020 Framework [22] with the concept of “Nature’s contributions to people”, which directly establishes the context of the relationship between natural resources and sustainable development. Monitoring and management of what remains of natural resources has thus become vital for ensuring a sustainable future.
Agenda 2030 on the Sustainable Development Goals [23] has become a prominent global response to the pressing issue of declining sustainability. The 17 goals, 169 targets and now >240 indicators are designed to indicate the progress of the world towards sustainability, and deliberately cover the three pillars of sustainability i.e. environment, social and economic [24] that were promoted during the Rio Summit (Agenda 21 Chapter 8.4). The overriding concept is that sustainability can only be attained by balancing these three dimensions in an integrated and holistic way [25]. This balance introduces the idea that, where synergistic outcomes for people and nature are not available, trade-offs need be made between the three in order to reach a sustainable balance. There is increasingly a rejection of the concept of a dichotomy of environment vs development, moving instead to perspectives such as ecosystem based engineering and green infrastructure, which bring ecosystems into development options as part of the solution, emphasizing that there should be no opposition [26].
“sustainable resource management” is imperative for human well-being and for sustained economic development. UNEP [3] went on to say that “natural resources management…. is a prerequisite to achieving sustainability, otherwise the SDGs will not fulfil their fundamental purpose of ending extreme poverty by 2030 and addressing all aspects of sustainable development. The UN Agenda 2030 on the SDGs [23] states “We recognize that social and economic development depends on the sustainable management of our planet’s natural resources”. It thus recognizes the interrelationships between human well-being, nature and economic growth, however Hutton et al. [28] believe that the SDGs are excessively loose in their formulation and are vague in how the ideals they represent should be realized and translated into pathways for development. This includes the quantification of the indicators, as the SDG targets and indicators are deliberately non-prescriptive about their achievement.
Although UNEP [3] praised the SDG Agenda [23] for its acknowledgement of the links between environment, social and economic issues and the need for a balance between all three to achieve sustainability, there are indications that all is not well in this regard and that SDG progress reports are dominated by social and economic development issues with little attention given to protection of natural resources [18, 29].
Reporting on progress, UN-DESA [30] noted that while all of the five SDG 15 (land) indicators of society’s response show positive trends, the indicators that show the state of life on land both indicate declines. They question why the overall state of nature, and by implication, natural resources, is declining despite increasing efforts towards conservation and sustainable development, which should be an urgent priority if SDG 15 is to be met. The UN Environment Assembly [31] made a submission to the High Level Political Forum of the UN (HLPF) noting that most of the indicators for which good progress is being made relate to policy, improved reporting or increased funding efforts as opposed to a positive change in the state of the environment itself. They note increases in terrestrial, mountain and marine protected areas; efforts to combat invasive species; use of renewable energy; sustainability reporting and mainstreaming in policy; and development assistance for climate change and the environment, but then they note that there is too little data to assess the bulk of the environmental indicators including ocean acidification (targets 14.1 and 14.3); water quality (target 6.3), water stress (target 6.4) and mountains (target 15.4). It could be envisaged that improvements in the state of the environment and natural resources will lag enhanced efforts and changes in policy, with the latter being a pre-requisite for the former. Nevertheless, lack of progress to date is a concern, as is the question of whether or not sufficient information is being obtained. UNEP [32] suggest that the SDG indicators will not provide all the information needed to understand the heath of the planet. Another report by UN Environment to the HLPF in 2020 shows that only 20% of countries reported biodiversity as a priority in their voluntary national reviews, again suggesting a dearth of information or lack of interest [33].
This paper addresses whether there are adequate goals, targets and indicators to provide the evidence needed for protection and management of natural resources. The authors have used the definition of natural resources as “raw materials occurring in nature that can be used for economic production or consumption: they are subdivided into four categories: mineral and energy resources, soil resources, water resources and biological resources.”[34]. The SDG Agenda Item 33 names natural resources as “oceans and seas, freshwater resources, as well as forests, mountains and drylands and to protect biodiversity, ecosystems and wildlife”[23]. Of note is that neither of the above two definitions list air as a natural resource, a serious omission given the advent of climate change. Four categories of natural resources have thus been considered here; land, water, air and biodiversity.
2. Materials and Methods
adopted by the General Assembly (A/RES/71/313) with a summary list (E/CN.3/2020/2) published in March 2020. The key source of data was the metadata publication of the UN Statistical Commission [35] that is continuously updated as indicators are developed. Data were gathered by seeking out those indicators that provide a quantifiable measure of some aspect of the natural resources. Each indicator and its contribution towards monitoring natural resources was evaluated and ranked where; [1] the indicator directly and quantifiably (in km2 or Mm3.annum-1, mg.l-1 etc.) monitors a
natural resource; [2] the indicator measures the conditions for natural resources protection (e.g. natural resource protection policy); and [3] the indicator does not include either of the above and thus is purely social, economic or development oriented.
3. Results
Figure 1 shows that 7.8% of the 231 unique indicators monitor natural resources directly (see Table 1), 8.2% monitor conditions for natural resource protection but do not directly quantify them (see Table 2), while 84.0% of indicators measure socio-economic development and governance. This does not however, mean that natural resources are not adequately covered.
This section may be divided by subheadings. It should provide a concise and precise description of the experimental results, their interpretation as well as the experimental conclusions that can be drawn.
3.2. Figure 1: SDGs indicators’ monitoring of natural resources against monitoring of social and economic development
Table 1 SDG indicators that directly measure a natural resource, and likely gaps in natural resource monitoring. This list based on the Global indicator framework adopted by the General Assembly (A/RES/71/313) E/CN.3/2020/2 published in March 2020. Numbers in parentheses indicate the Tier level as published by the IAEG in 2020 [36]
Indicators
(Tier)
Natural resources directly
monitored/measured
SDG gaps in data and
information
2.4.1
(ll)
Sustainable
agriculture
Eleven sub-indicators but only soil health
is a direct measure of a natural resource
Water resources for agriculture
11.3.1
(ll)
Land
consumption
rate
Areal extent of newly developed urban
land (indicating loss of land)
Consumption of non-urban land
15.1.1
(l)
Forest area Forest as a percentage of total land area Forest condition (deforestation
and forest restoration) by type
of forest
15.3.1
(l)
Degraded land Land cover, net primary production of
vegetation and carbon stock
Stages of land
degradation/erosion
Soil condition, nutrients and
fertility
Salinization and desertification
15.4.2
(l)
Vegetation
cover of
mountains
Green (chlorophyll) land cover at altitude
classified as mountains
Vegetation cover of flat-lands
and wetlands
Other land resource gaps Other natural ecosystems
condition (e.g. grasslands,
savannah, wetlands)
Ecosystem health of land
Water (freshwater and marine)
6.3.2
(ll)
Ambient water
quality
Limited water quality parameters
expanding with progressive monitoring
Multiple water quality
parameters depending on
progressive monitoring
Biomonitoring data
6.4.2
(l)
Water stress Total fresh water quantities (withdrawn,
renewable surface and groundwater
resources and environmental requirements
or e-flows)
Does not illustrate change over
seasons 6.6.1 (l) Spatial extent, quantity and quality
Spatial extent (lakes, rivers, estuaries,
artificial water bodies, vegetated
wetlands), water quality (chlorophyll &
total suspended solids) and volume of
water discharge in rivers and estuaries and
a measure of groundwater depth
Quantities of ice/snow, soil
water, water in vegetated
wetlands
Aquatic ecosystem types
Natural vs. artificial wetlands
Natural vs. artificial water
bodies
Groundwater volumes
14.1.1
(ll)
Coastal
eutrophication
and plastic
Eutrophication (chemical; algae and
biodiversity but presently only chlorophyll
as proxy) and plastic debris although only
beach litter presently
Other nutrient pollutants
Turbidity
Marine ecosystem health
14.3.1
(ll)
Marine acidity
(pH)
pH, DIC (dissolved inorganic carbon),
pCO2 (carbon dioxide partial pressure), and
TA (total alkalinity).
Other water resource gaps River connectivity
Ocean water quality
Aggregate extraction
Linkage between SDG6, 14 & 15
Air
11.6.2
(l)
Particulate
matter
Fine suspended particles in the air (in
urban areas)
Nitrogen dioxide, sulphur
dioxide, other pollutants
13.2.2
(-)
Greenhouse
gas
Total greenhouse gasses emitted per year (Method under development)
Other air resource gaps Air temperature
Climate change over time
Biodiversity
2.5.1
(l)
Genetic
resources
Plant and animal genetic resources of
potential or actual value for agriculture
Plant and animal genetic
material of non-agricultural
species
14.4.1
(l)
Fish stocks Fish catch, yield and production of
commercial species, abundance compared
to sustainable yield
Freshwater fisheries
By-catch
Marine and freshwater
biodiversity
15.1.2
(l)
Measure of
protected areas
Terrestrial and freshwater protected areas
that are protecting a limited number of
important species dominated by birds, plus
endangered species
State/health of these protected
areas
Limited inclusion of freshwater
biodiversity
Environmental flows carried
from 6.4.2 15.2.1 (l) Sustainable forest management
Forest area and biomass with aspects of
biodiversity Sustainable non-forest management Forest biodiversity 15.4.1 (l) Mountain biodiversity
Key biodiversity mountainous areas (no
species data), dominated by birds, plus
endangered species
State/health of mountains
Flatland, floodplain, wetland
and delta biodiversity
The SDG indicator methods are in a continual state of development, categorised by the IAEG into Tier lll (under development), Tier ll (ready but not operational) and Tier l (fully operational in many countries). The Tier status of each at the time of writing in 2020 is indicated in Tables 1&2. Their status as Tier ll or lll will be hindering reporting on sustainable development.
The information in Table 1 reflects only those indicators that directly and deliberately set out to quantify some aspect of the natural resource, generally an aspect that may be affected by development. In some indicators this may be included in an index where the natural resource measure may be obscured (e.g. 15.4.2 – the Mountain Green Cover Index), the indicator thus requiring disaggregation.
The indicators presented in table 2 do not themselves contain any quantification of natural resources and thus are not able to reflect their actual status. However, these indicators may provide a basis for protection of natural resources by providing enabling conditions, for example indicators 14.6.1 does not monitor any fish species but rather country implementation of the Code of Conduct for Responsible Fisheries and related instruments (CCRF) which encourages the conservation and protection of fish stocks through combating illegal fishing and over exploitation. In the same manner indicator 6.5.1 does not monitor any water quality or quantity parameters but by monitoring country commitments to implementation of policies, laws, institutional arrangements, budgeting and financing and strategies for water resources development, protection of water quality may be achieved.
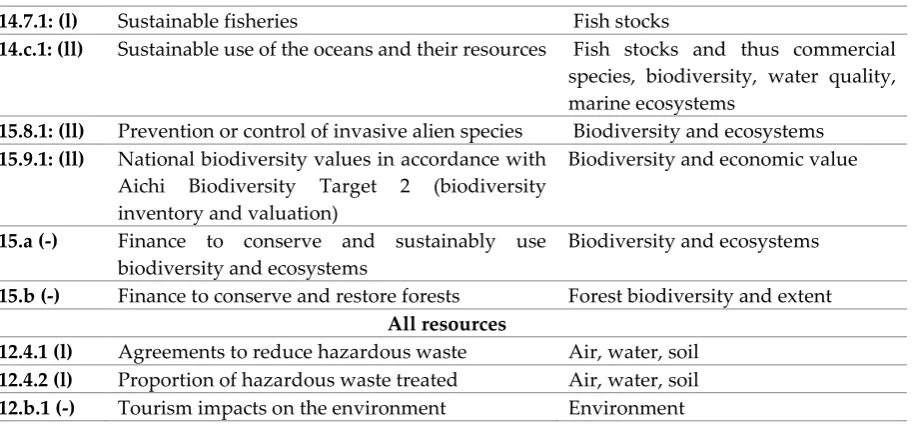
Table 2 SDGs Indicators that monitor conditions for natural resources protection but do not directly quantify them. Numbers in parentheses represent Tier level published by the IAEG in 2020 [36]
Indicators that support natural resource protection Natural resource that may be supported
Land
15.2.1: (l) Progress towards sustainable forest management Forest and land area Water freshwater and marine
6.3.1: (ll) Proportion of wastewater safely treated Water quality
6.5.1: (l) IWRM implementation Water quantity, quality, ecosystems 6.5.2: (l) Transboundary basin area with arrangement for
water cooperation
Water quantity, quality, ecosystems
14.2.1: (ll) Countries manage marine and coastal areas using ecosystem-based approaches
Water quality, biodiversity, marine ecosystems
Air
7.b.1: (-) Investments in energy efficiency Air quality, natural resources 13.2.1 (-) Climate change policy to adapt and lower
greenhouse gas emissions
Air quality and climate change
Biodiversity
11.4.1 (ll) Expenditure on natural heritage Biodiversity, ecosystems, features 14.5.1: (l) Coverage of marine protected areas including
key biodiversity areas
Marine ecosystems, biodiversity
14.6.1: (l) Instruments that combat illegal fishing Fish stocks and thus commercial species
15.5.1
(l)
Red List Index Limited number of species in each Red List
Category
State of the majority of global
species not listed (millions)
Other biodiversity gaps Biodiversity data across all
ecosystems
14.7.1: (l) Sustainable fisheries Fish stocks
14.c.1: (ll) Sustainable use of the oceans and their resources Fish stocks and thus commercial species, biodiversity, water quality, marine ecosystems
15.8.1: (ll) Prevention or control of invasive alien species Biodiversity and ecosystems 15.9.1: (ll) National biodiversity values in accordance with
Aichi Biodiversity Target 2 (biodiversity inventory and valuation)
Biodiversity and economic value
15.a (-) Finance to conserve and sustainably use biodiversity and ecosystems
Biodiversity and ecosystems
15.b (-) Finance to conserve and restore forests Forest biodiversity and extent All resources
12.4.1 (l) Agreements to reduce hazardous waste Air, water, soil 12.4.2 (l) Proportion of hazardous waste treated Air, water, soil 12.b.1 (-) Tourism impacts on the environment Environment
4. Discussion
According to UN Environment, 86 out of the 169 SDG targets directly or indirectly seek to reduce environmental damage or emphasize the critical role of natural resources and ecosystem services in ensuring human well-being and prosperity, [37]. However these cover a wider scope than just natural resources. According to UNEP the Stockholm Resilience Centre categorised the SDGs into those that support the biosphere (6,13,14,15), society (1,2,3,4,5,7,11,16) and economy (8,9,10,12), [38]. This paper goes beyond goals and targets to the indictor methods themselves, from which it is possible to record a total of 30 targets and 37 indicators (Tables 1&2), comprising methods directly quantifying natural resources (18 indicators, 7.8% of total – Figure 1) or providing supporting conditions for natural resource protection (19 indicators, 8,2% of total). These constitute a small percentage compared to the balance of the indicators that are focused on socio-economic and governance issues (84% of total – Figure 1). These results are similar to those produced by Wackernagel et al [19], who relied on a draft list of indicators and argued that they were dominated by indicators related to social development, while those related to resource security receive substantially less attention. This does not mean however, that these are not up to the task as, in theory, a few comprehensive natural resource indicators could provide sufficient information for management to ensure sustainability. By contrast, the Convention on Biological Diversity (CBD 2020)[39] has drafted a list of some 161 indicators for monitoring of biodiversity issues alone, which themselves have been challenged as inadequate, suggesting that the SDG attempts to be brief may be limiting.
social, economic and environment indicators, together with a regular update to establish trends. Key also is their almost universal uptake, high level publicity and support.
A further detail in the Tables 1&2 is the Tier level of the different indicators. This shows that all of the indicators are in either Tier 1 or 2 and are thus effective and are either being implemented or ready for implementation. This means that the tier preparedness cannot be an explanation for the lack of data going forward, although acknowledging that the most recent global reports took some time in preparation. The summary of the natural resources monitored by relevant SDG indicators (Table 1&2) show varied levels of support for monitoring of natural resources; a summary and analysis is provided below. Note that all references to SDG indicator methods can be made to UNSTATS [35] unless otherwise stated.
Land resources
Tables 1&2 show the extent to which land resources are monitored within the SDGs. This includes the health of agricultural soil (as part of sustainable agriculture, indicator 2.4.1), urban land conversion (11.3.1), forest area (15.1.1), greening of mountains (15.4.2), and the area of degraded land (15.3.1). Regulation of hazardous waste (12.4), and management of tourism would benefit land resources (12.b.1). Gaps in the monitoring would include the consumption of rural land (11.3.1) the health or state of forests (15.1.1), vegetation cover of flat-lands and wetlands (15.4.2) as well as many nuances about degraded land including the stages of land degradation, soil condition, nutrients and fertility, salinization and desertification (15.3.1). A major gap in all monitoring here is a measure of ecosystem health of landscapes.
Some of the indicators that are included for land are affected by the lack of precision of concepts associated with them (e.g. forest, degradation, productivity) which adds uncertainty to the outputs. Most of the indicators are multidimensional which results in complex indices that may contain, embedded within them, quantifiable measures of land resources (e.g. land degradation, forest condition). The SDGs rely on already agreed conceptual frameworks to measure some of these indicators when they are available, thus for example while there is no agreed framework for forest condition, there is one to measure land degradation neutrality (LDN) [40] that forms part of 15.3.1.
Indicator 15.2.1 [35] centers on implementation of sustainable management, to halt deforestation, restore degraded forests and substantially increase afforestation and reforestation. While there are agreed definitions of sustainable management, deforestation and afforestation/reforestation, restoration is a more elusive concept since there are many different practices leading to forest restoration (e.g. passive natural restoration, active restoration, tree plantations), which may also overlap with afforestation and reforestation depending on where forest restoration takes place, and the time frames considered[41]. Forest degradation is more difficult to measure since results from changes within forests that negatively affect the structure or function of the stand or site over many decades, can thereby lower the capacity to supply products and/or ecosystem services [42]. There are different types of forest degradation including, among others, the ecological quality and integrity of forests [43].
bodies and human development, and is used as a proxy to reflect the capacity to deliver land based ecosystem services, and thus suggest land in good condition. The Good Practice Guidance for Indicator 15.3.1, [44] states that the component sub-indicators are “necessary but not sufficient”, acknowledging that they do not cover all possible perturbations. The indicator method [33] documents 19 different forms of land degradation that could be but are not all included in monitoring. They acknowledge that not all available indicators could be included in the index as this would become too complex (including landscape modification; soil erosion and compaction; salinization; acidification; fertility; contamination; soil extraction; aridification; vegetation cover; vegetation community functioning; biomass; biodiversity; seedbank; weeds; invasive species; habitat; hydrological modifications; groundwater).
Gaps in some of the other indicators are also apparent, thus for indicator 15.1.1, the forest area index, the index itself recognizes that it is “a rough proxy for the extent to which the forests in a country are being conserved or restored, but it is only partly a measure for the extent to which they are sustainably managed”. With regards to target 15.2 there is a lack of indicators linked to forest degradation and forest condition, as well as others able to capture forest cover change dynamics (e.g. fragmentation, afforestation, reforestation and restoration). SDG 15.4.2 on the green cover of mountains states that there is a “direct correlation between the green coverage of mountain areas and their state of health, and as a consequence their capacity of fulfilling their ecosystem roles”. This statement should not go unchallenged in that that some healthy natural areas do not have green cover (e.g. deserts, very high mountain ranges). An important omission from all of the indicators on the land resource, and despite the best intentions of 15.3.1, is that there is no general measure of ecosystem condition.
Water resources
Table 1 shows that water quality is covered to a limited extent (6.3.2 and 6.6.1); water quantity, including inventories of renewable resources and environmental flows (6.4.2) are supported by the direct measure of water volumes and discharge (6.6.1). The latter indicator also documents the change in spatial extent of water bodies and wetlands, and in its latter phases monitors groundwater as well. Freshwater resources also appear in 15.1.2 that sets out to monitor the proportion of important ecosystems, including freshwater, that are protected, but this indicator does not measure the water resource directly. Coastal and marine water resources include indicators of eutrophication, plastic pollution (14.1.1) and acidification (14.3.1).
Possible gaps in water quality monitoring (6.3.2) are the wider range of water quality variables that are possible but not specified; the water stress (6.4.2) indicator does not focus on the times of year when stress is important, as the annual average water stress is not often relevant to stakeholders; there is undocumented water quantity in snow and ice, soil water and in vegetated wetlands (6.6.1). The health of freshwater ecosystems is not monitored, a major omission, while for marine ecosystems this is done only by proxy. An important component of river ecosystems that is missing is the connectivity of rivers, especially when disrupted by dam placement (6.6.1). This could now be addressed by applying the newly developed river connectivity index (Grill et al 2019). In coastal and marine systems the SDGs take a light touch giving emphasis to nutrients and eutrophication, but providing little detail of ecosystem state (14.1.1.).
There are a number of other indicators, which if implemented could contribute to protection of water resources (Table 2). Increased treatment of wastewater would protect water quality (6.3.1); IWRM implementation and transboundary governance of water resources should, if properly implemented with sustainable goals in mind, protect many aspects of the resource (6.5); application of ecosystem-based approaches to management of marine and coastal areas should protect all aspects of the resource (14.2.1); reduction in hazardous waste would also protect water resources (12.4).
The short list is also designed to be manageable with only basic field equipment making this globally more appropriate [47]. This list does however divert substantially from other recommendations for general water quality monitoring which are much more extensive such as Bartram et al. [48], CCME [49], Standard Methods [50], UNICEF [51], USDA [52], (ISO) [53], WHO [54] and the GEMStat programme [55], with the SDG indicators avoiding the associated complexity. A similar challenge was faced by the World Water Quality Assessment [56] which is also not comprehensive in its inclusion of variables. There are attendant risks in not monitoring comprehensively, for example emerging pollutants of water have been identified as one of the greatest threats to biodiversity [57]. Countries implementing SDG 6.3.2 do have the facility to extend the monitoring to locally relevant variables, but the challenge for the UN will be how to deal with dissimilar data sets emerging from each country which will challenge global reporting. 6.6.1 also contributes to water quality by adding earth observation data on chlorophyll and suspended solids or turbidity of lakes, however this is confined to large ecosystems and artificial reservoirs so does not provide a comprehensive picture of the state of aquatic ecosystems.
Indicator 6.4.2, the “water stress indicator”, has been previously described [58] and provides measurements of what water remains in the environment for use, and includes consideration of environmental flows i.e. the quantity and timing of flows required to protect ecosystems so that they can continue to provide benefits to society. The environmental flow data is however hidden within the index and needs to be disaggregated if the data are to be available as a descriptor of river ecosystem health. Ideally these data should be directly linked to 6.6.1 on water-related ecosystems where they can usefully be used to report on the condition of aquatic resources. Environmental flows can also usefully be used as an indicator for aquatic protected areas for 15.1.2. Reported as an annual figure the 6.4.2 indicator also does not show the variation in water stress as affected by seasonal changes, which would be of greatest interest at a local level, especially in river basins where there is substantial natural variability in hydrology and/or pronounced seasonal variability in water use. Indeed it has been shown that some 4 billion people live under conditions of water stress for at least one month of the year [59].
In terms of spatial extent of water bodies, the 6.6.1 indicator method is globally comprehensive as it is based on earth observation methods which are developing in tandem with the implementation of this method [60]. Separation of artificial (e.g. dam reservoirs) from natural open water bodies is intended in the method but must be carried out otherwise estimations of extent are meaningless. Inclusion of small wetland ecosystems remains a challenge if they are less than a quarter hectare in extent, which in some ecosystems is the predominant size e.g. on steep mountainsides. Inclusion of temporary systems that do not demonstrate either open water or dramatic vegetation changes is also a challenge. Assessment of vegetated wetlands however remains at the edge of capability of the developing methods so these data remain elusive and there is also little information on the spatial extent of ecosystem types, which may obscure changes in spatial extent that happen from one type to another with a subsequent loss of biodiversity or ecosystem services [61]. Separation of natural from artificial wetlands (e.g. rice paddies) is also vital for proper understanding. Water quantity changes are well covered in terms of open water (discharge and spatial extent) and to a lesser extent groundwater, but there is concern for the poor state of global data as hydrometric networks are in decline [26]. New earth observation methods could however, soon take over hydrological monitoring [62]. There is also little information on the temporal (seasonal and inter-annual) fluctuations of flow which are so important for sustainability of aquatic ecosystems [63].
(ICZM) protocols” as proxy indicator for ecosystem-based management in coastal zones (14.2.1). These proxy indicators are in line with the Regional Seas Conventions and Action Plans agreed at their 18th Global Meeting in 2016 [38].
The intention is that SDG 14 indicators (and proposed proxies) measure the state and quality of the impacted ecosystems, rather than the drivers and pressures underlying these drivers. What will be delivered in future will include, for 14.1.1 nitrogen and phosphorous concentrations, as well as silica as this would allow interpretation of harmful algae growth, chlorophyll, biomass and turbidity. Dissolved oxygen is also to be used as an indicator. The Regional Seas Programmes that dominate developments in this line have three categories of eutrophication indicators, nutrients, direct effects such as phytoplankton, and indirect effects such as oxygen, organic carbon, zooplankton and fish. However the 14.1.1 index will only be fully developed by 2021.
The SDG and proxy indicators only capture part of the associated SDG targets. In the long-term, these limitations will have to be addressed to ensure that SDG 14 is fully met [38]. Deliberate linkages between fresh and marine SDGs would also provide greater understanding as these ecosystems are closely entwined, with rivers being a major source of pollutant and sediment input to the sea and many species (especially fish species) migrating between the two systems.
A major limitation of the freshwater reporting is the lack of any comprehensive measure of ecosystem health, while the marine indicators presently rely on chlorophyll and biomass but do not show more detail. Closely related to this, is the lack of information on the extent of different ecosystem types or habitats in both freshwater and marine areas; information which could be used as a foundation of the biodiversity evaluation to come. In marine areas this would include monitoring of individual marine and coastal habitats, such as coral reefs, seagrass, saltmarsh and mangroves (although the extent of these is captured in 6.6.1). Closely related to ecosystem health is the implementation of environmental flows, which while forming part of the 6.4.2 indicator [64], there is no goal or objective for their implementation as a measure of progress towards ecosystem health. Also, the lack of information on the discontinuity of ecosystems [65] that have been divided by developments e.g. by construction of dams. This discontinuity can provide a break in the entire functioning of river ecosystems, by disruption of sediment transfer, by changing water quality, by obstructing movement of fauna in both directions, by altering flooding regimes and subsequent scouring of substrates and the riparian zone etc.
Air resources
Initial monitoring by the SDGs was limited to particulate matter PM2.5 (11.6.2 - level of fine particulate matter in the air of cities), but in 2020 indicator 13.3.2 was introduced to monitor total greenhouse gas emissions (Table 1) thus making a link to climate change although the method is not yet available [35]. PM2.5 is a key global pollutant that results from fires and engine emissions and is a key health issue. A global study of 652 cities on the impacts of PM2.5 and PM10 provided evidence of a positive association between short-term exposure to PM10 and PM2.5 and daily all-cause, cardiovascular, and respiratory mortality [66]. A more comprehensive monitoring programme, the WHO air quality monitoring guidelines [67], recommended monitoring of particulate matter (PM), ozone (O3), nitrogen dioxide (NO2) and sulphur dioxide (SO2). The
combined 11.6.2 and 13.2.2 will cover much of this recommendation.
UN Environment with UN-HABITAT and IQAir in 2020 created a new database on air quality concentrating on PM2.5, the Urban Air Action Platform, [68] which will provide valuable support to the SDGs especially for countries lacking infrastructure. This has as its support the Global Environment Monitoring System for Air (GEMS Air) which is the UN Environment mechanism on air quality monitoring which promotes monitoring of particulate matter of various sizes but also NO, NO2 and SO2.
Air quality is at the centre of the biggest environmental changes facing society due to climate change where air pollutants and temperatures are increasing year by year [15]. Air pollution is a publically visible degradation of a natural resource with multiple examples that have made global headlines e.g. the Australian bush fires of 2019-2020 [69] where fires and plumes of smoke coated the continent; air pollution in 2019 Delhi India was reported as a “Climate Emergency” [70]; the noticeably reduced air pollution in cities during the Covid-19 crisis where in China concentrations of PM2.5, NO2 and SO2 decreased by 33.2%, 27.2% and 7.6% respectively compared with 2019 because
of the slow-down in industry [71]. The WHO noted that policies to reduce air pollution offer a “win-win” strategy for both climate and health, lowering the burden of disease attributable to air pollution, as well as contributing to mitigation of climate change [72].
Biodiversity resources
Table 1 shows a number of largely non-specific biodiversity indicators where minimal measures of biodiversity are contained within indicators with a wider objective. Thus there is a measure of genetic resources for agriculture (2.5.1); marine fish stocks but without a measure of marine and freshwater biodiversity (14.4.1); the indicator of marine eutrophication has a requirement for evaluation of marine biodiversity but no detail or method direction is yet available (14.1.1); limited biodiversity in terrestrial protected areas (15.1.2); and limited biodiversity for forest and mountain area (15.2.1 and 15.4.1). The only dedicated biodiversity indicator is 15.5.1 but is limited in scope. In all of land, freshwater and marine environments, a full measure of biodiversity is missing.
There are a number of indicators which if implemented would provide protection to biodiversity resources but do not directly measure biodiversity (Table 2). These include indicators of policy and financial support for protection of marine and land resources (14.4.1; 15a; 15b), marine protected areas (14.5.1), sustainable use of marine resources (14.6.1; 14.7.1; 14.c.1), trading of biodiversity (15.7.1) and limiting of alien species (15.8.1). Perhaps the most noteworthy is 15.9.1 that seeks to align the SDGs with AICHI target 2 (now addressed principally by Post-2020 draft target 13), which provides inventories and associated values of biodiversity but the impact of the AICHI targets on the SDGs is not evident and was not mentioned in the UN SDG report of 2019 [73].
Biodiversity can be reported in a number of complementary approaches, using measures of biodiversity or of ecosystems with their component biodiversity, the spatial extent of important ecosystems or biodiversity areas, and the policies and management activities designed to give them protection. The SDGs make use mostly of the latter two approaches.
Goal 6 documents the extent of water-related ecosystems, but there is no measure of overall ecosystem condition or associated biodiversity. While the intention of the 6.6.1 target is to protect and restore water-related ecosystems, including mountains, forests, wetlands, rivers, aquifers and lakes, suggesting that some measure of biodiversity would be necessary, this has not been included in the final indicator. Early developments of the indicator included a measure of aquatic ecosystem health [74] but these were removed for the second round of data collection as it was concluded that most countries were not in a position to provide useful data. The option however remains recorded in the 6.6.1 method for future inclusion, with the ideal being a global dataset on aquatic ecosystem health that would include biodiversity. Freshwater fisheries are globally important and under threat [75] [76], yet are a notable omission from the SDGs.
SDG 15 is established for protection, sustainable use and restoration of terrestrial ecosystems, and also to prevent biodiversity loss. SDG 15.1 is dominated by terrestrial ecosystems (especially forests and protected areas) but does include water ecosystems in its targets, including somewhat hidden in 15.1.2 the freshwater Key Biodiversity Areas [77, 78], which are also found in 14.5.1 for marine ecosystems [79].
commitment to biodiversity conservation and does not report on the effectiveness of biodiversity conservation [80], a perspective that has been recommended for resolution in the CBD Post-2020 evaluation. Also, as a tool to protect freshwater ecosystems, protected areas can only make a limited contribution because by nature most river ecosystems are mobile and cannot be contained within the boundaries of a protected area [81].
SDG 15.2.1 (sustainable forest management) considers the extent to which forests are incorporated into protected areas, and this includes forest management plans that in turn consider biodiversity aspects. Biodiversity data on forests however is not directly reported in the SDGs. Similarly 15.4.1 considers protected areas and mountains, the aim being to protect a fairly short list of important species. Species data are not directly obtainable from SDG reports.
SDG 15.5.1 is perhaps the most focused biodiversity indicator, using the IUCN Red List of Threatened Species that accounts for the risk to some 120,372 species [82] but does not document the status of the bulk of species (widely quoted as 8.7 million [83]), nor their interactions or changes in community structure etc. It was noted in IPBES [17] that indices such as the IUCN Red List categories are relatively coarse and may miss gradual declines of abundant, widespread species, which indicators based on species’ abundances could capture [84]. Thus, while Goal 15 even includes in its title to “halt biodiversity loss”, it provides only a limited direct measure of biodiversity [35].
The most widely quoted snap-shot evaluation of the state of the world’s biodiversity is possibly the WWF/ZSL Living Planet Index (2018) that considers 16,704 populations with 4,005 species and shows changes in the average populations of species. This same report and also Mace et al [85 ] also promotes having more than one biodiversity indicator, and they present an additional three including the IUCN Red List Index, together with the Species Habitat Index and the Biodiversity Intactness Index, but in their present form there is little coverage of freshwater and marine biodiversity.
A major global effort to document and thus to protect biodiversity was the Global Assessment Report on Biodiversity and Ecosystem Services issued by IPBES [17]. The IPBES approach moves beyond analysis of species presence and absence, and instead takes a whole ecosystem approach to monitoring biodiversity using what are termed Essential Biodiversity Variables (EBVs). These are measured to indicate both the rate of change as well as the deviation from natural. These include aspects such as ecosystem structure, function, community composition, species populations, species traits and genetic composition. Examples given in IPBES [17] illustrate that a great deal of information on most of the above is already available and could be used for contribution to the SDGs. The report documents species and ecosystem declines since the early Anthropocene, ramping up into the present era. While the details cannot be represented here, what is relevant is the extent, volume and diversity of the data and information that is available and has been used by the IPBES, although disaggregation of the data to national level would be a challenge. This highlights the rather scant approach adopted by the SDGs.
on the basis of current trajectories [22]. During 2020 the CBD Post-2020 process is geared to make deliberate linkages to the SDG indicators, but uptake of this by the IAEG will be necessary to succeed.
Butchart et al [86] provide a number of reasons why the Aichi targets have not performed well on the global stage, suggesting four key issues: ambiguity (e.g. use of the word “sustainability” without any attendant value or description to describe a target), quantifiability (most indicators lacked quantifiable elements), complexity, and redundancy as being at the centre of the inability to gain a clear perspective on the status of biodiversity. They recommended for the future a smaller number of more focused headline targets that are specific, quantified, simple, succinct, and unambiguous. During development of the Post-2020 programme the CBD circulated documents detailing the linkages between the SDGs and the CBD [87]. The stated objective of these documents were to strengthen these linkages “by ensuring coherence with the 2030 Agenda, the Global Biodiversity Framework can strengthen and advance the implementation and achievement of the SDGs. Additionally, the Sustainable Development Goals and their targets and associated indicators can serve as a reference to formulate global commitments in the Global Biodiversity Framework and its monitoring framework”. What was omitted in this alignment were the actual methods and data, which if aligned, would ensure commonality of data and at the same time substantially reduce country monitoring effort. The two programs have substantial contributions to make towards biodiversity protection, however by each maintaining its independent structure, there is a potential to overburden countries to the detriment of both programs and ultimately of sustainability. Nevertheless, by documenting how the CBD indicators could contribute to the SDG targets, this adds valuable input and demonstrates how programs from outside the SDG Agenda could usefully be incorporated in a formal way thus easing reporting requirements and streamlining data collection. Considerable guidance has been forthcoming, with for example Tickner et al [75] providing an Emergency Recovery Plan for freshwater ecosystems and biodiversity including indicators that could support the SDGs and the CBS monitoring.
Beyond the SDGs for natural resources
The uptake of the SDG Agenda by most countries of the world is unprecedented [23] and should become its defining attribute, provided that the data that are produced are meaningful. The diversity of the SDGs, with data that covers the whole globe, enables trajectories of social, economic and environmental indicators to be interlinked, potentially providing a synthesized picture to society that is more likely to be understood and thus to engender a response. It is also a strength of the SDGs that they are not overwhelmed by complexity even though there are >240 indicators, but these are distributed widely across the field of sustainability so need not create confusion. However the deficiencies of the SDG Agenda are beginning to show, with a key issue being the lack of interdependency between natural resource including biodiversity, ecosystem services and sustainable development [88].
which is ecosystem condition. They measure the area of ecosystems by type and the biophysical characteristics that help understand the condition of the ecosystems, and follow that with a number of economic evaluations of ecosystem services. They document for example that for SDG 6.6.1 on water related ecosystems, there are conceptually equivalent indicators in the SEEA (Ecosystem Extent/Land Cover Account & SEEA Water Account), Aichi (AT 5.5.3 & AT 5.5.1), Ramsar (R 8.6), BIP (BIP B.1) and IPBES (IPBES H.10) where data could be shared between these initiatives. An important limitation of the SEEA approach however is that it is through a lens of economics, not necessarily what is needed for documentation of natural resources.
It is proposed here that these multiple programmes that provide both indicators and some level of monitoring and reporting, provide an invaluable resource that is measuring sustainability through a particular lens and that this information and data should not go wasted in development of a global perspective of sustainability, acknowledging that it may not contribute to country reporting. By integrating elements of this data directly into the SDGs this could facilitate a more holistic evaluation of sustainability, overcoming many of the weakness with regard to natural resources shown here.
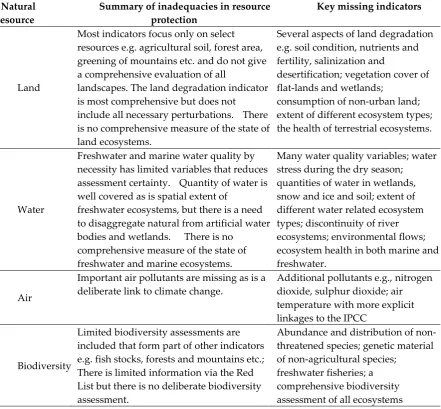
Table 3 provides just an overview of the detailed assessment of some deficiencies in the natural resource related SDG indicators provided above, identifying the key missing indicators that should either be developed for inclusion in the SDGs, or deliberate efforts made to incorporate data from other global programmes as discussed above.
Table 3 Summary of inadequacies of SDG indicators that support quantification and protection of natural resources and proposals for what is missing. Detail of these is available in Tables 1 & 2.
Natural resource
Summary of inadequacies in resource protection
Key missing indicators
Land
Most indicators focus only on select resources e.g. agricultural soil, forest area, greening of mountains etc. and do not give a comprehensive evaluation of all
landscapes. The land degradation indicator is most comprehensive but does not include all necessary perturbations. There is no comprehensive measure of the state of land ecosystems.
Several aspects of land degradation e.g. soil condition, nutrients and fertility, salinization and
desertification; vegetation cover of flat-lands and wetlands;
consumption of non-urban land; extent of different ecosystem types; the health of terrestrial ecosystems.
Water
Freshwater and marine water quality by necessity has limited variables that reduces assessment certainty. Quantity of water is well covered as is spatial extent of
freshwater ecosystems, but there is a need to disaggregate natural from artificial water bodies and wetlands. There is no
comprehensive measure of the state of freshwater and marine ecosystems.
Many water quality variables; water stress during the dry season; quantities of water in wetlands, snow and ice and soil; extent of different water related ecosystem types; discontinuity of river ecosystems; environmental flows; ecosystem health in both marine and freshwater.
Air
Important air pollutants are missing as is a deliberate link to climate change.
Additional pollutants e.g., nitrogen dioxide, sulphur dioxide; air temperature with more explicit linkages to the IPCC
Biodiversity
Limited biodiversity assessments are included that form part of other indicators e.g. fish stocks, forests and mountains etc.; There is limited information via the Red List but there is no deliberate biodiversity assessment.
Abundance and distribution of non-threatened species; genetic material of non-agricultural species;
5. Conclusions
Assessment of sustainability is the core of the SDGs, and this paper has addressed just the natural resource component of sustainability. The central tenet of the analyses conducted for this paper is the research question: are the indicators in the SDGs sufficient and fit-for-purpose to assess the trajectory of natural resources towards sustainability? We extracted all of the SDG indicators that quantify the state of natural resources in some way, and also those indicators that, if successfully implemented, would contribute to the protection of natural resources even though they do not quantify them. We chose to classify natural resources into four main groups, land, water, air and biodiversity.
All four natural resources are covered by SDG indicators even if sometimes concealed within complex indices. Two major weaknesses exist and these are that, 1) the health or state of land, water and air ecosystems is not included other than in a few partial cases, and 2) biodiversity is not included in any comprehensive form and the indicators provided will not be able to provide a comprehensive evaluation. These two weaknesses represent a challenge for the assessment of sustainability as a whole, and reveal that the SDGs have not fully embraced the value of ecosystems and biodiversity in the evaluation of sustainability. Ecosystems are now well accepted to be at the core of the interaction between humanity and the environment (MEA, TEEB, IPBES), and biodiversity is at the core of the functioning of ecosystems (IPBES). Thus the weakness of these two could be of crucial significance for the SDG Agenda. While the IAEG have shown little appetite to expand the indicators beyond just a few additions, the Convention on Biological Diversity (CBD) has proactively taken steps to identify the linkages between the very detailed CBD indicators and the SDGs, in anticipation that adoption at some level by the SDGs would strengthen this assessment. In the absence of uptake by the SDGs, this would turn the focus back towards the CBD to more successfully report on the sustainability of biodiversity, to the detriment of Agenda 2030.
Besides the definitions of the SDG indicators, their implementation is necessary at a global and country level before they can become effective. Two issues emerge here, 1) countries and also global reports tend to prioritize social and development indicators and give less attention to resource indicators [18, 19, 90] and the environment as a whole [91], and 2) countries are not willing and/or able to collect the data on natural resources necessary to make a country or global assessment of sustainability a possibility. For example, the global SDG 6 report on water concluded that the world was “not on track” to meet the SDG targets, and this was all the more concerning as, for many of the water resource indicators, no report was possible due to a lack of data [92]. Similarly, progress was reviewed by UN Environment where it was reported that 68% of the environmentally orientated indicators did not have enough data to be reported on [93]. This signals the delicate balance between the complexity of the SDG Agenda and the appetite or willingness of countries to embrace the SDGs. Dickens et al [94] outlined how countries should be setting deliberate targets to direct monitoring programmes at a country level, following the requirement of Agenda 2030 to do so.
This paper identifies many weaknesses in the monitoring of natural resources particularly in relation to the health of ecosystems and also biodiversity, while acknowledging that much of these data exist in parallel monitoring programmes that operate at a global level. These global programmes however may also not be implementable at a country level which is a necessary condition of the SDGs. Overt linkages between the SDGs and these other programmes could be the most pragmatic way of ensuring that the evaluation of sustainability is more holistic, but in order to ensure that the data is included in SDG reporting, it is proposed that data from these programmes is directly incorporated into SDG evaluations of sustainability.
6.
Funding: This research was funded by the Water, Land and Ecosystems (WLE) program that forms part of the CGIAR (see acknowledgements), as part of the VCR Flagship Project (VCR - Managing resource variability, risks and competing uses for increased resilience)
Acknowledgments: The International Water Management Institute (IWMI) and the CGIAR Research Program on Water, Land and Ecosystems (WLE). The CGIAR Research Program on Water, Land and Ecosystems (WLE) combines the resources of 11 CGIAR centers, the Food and Agriculture Organization of the United Nations (FAO), the RUAF Foundation, and numerous national, regional and international partners to provide an integrated approach to natural resource management research. WLE promotes a new approach to sustainable intensification in which a healthy functioning ecosystem is seen as a prerequisite to agricultural development, resilience of food systems and human well-being. This program is led by the International Water Management Institute (IWMI) and is supported by CGIAR, a global research partnership for a food-secure future).
References
1-World Economic Forum. Natural Riches? Perspectives on Responsible Natural Resource
Management in Conflict-affected Countries. World Economic Forum: Geneva,
Switzerland, 2013;
2-Mensah, A.; Castro, L.C. Sustainable Resource Use & Sustainable Development: A Contradiction?!;
Zentrum fur Entwicklungsfourschung(ZEF), Centre for Develoment Research,
University of Bonn: Bonn, Germany, 2004.
3- UNEP. Policy Coherence of the Sustainable Development Goals, a natural resource perspective.
International resource panel Report. United nations Environmental program (UNEP):
Nairobi, Kenya, 2015.
4- Patnaik, R. Impact of Industrialization on Environment and Sustainable Solutions- Reflections from
a South Indian Region. IOP Conference Series: Earth and Environmental Science, 2018;
doi :10.1088/1755-1315/120/1/012016
5- Lim, M. M. L.; Jørgensen, S.; Wyborn, C. A. Reframing the sustainable development goals to
achieve sustainable development in the Anthropocene—a system approach. Ecology and
Society, 2018, 23(3):22. Available online: https://doi.org/10.5751/ES-10182-230322
6- Diamond, J. Collapse, how societies choose to fail or succeed. Viking Press, 2005; ISBN
0-14-303655-6
7- Turner, B.L.; Sabloff, J.A. Classic Period Collapse of the Central Maya Lowlands: Insights about
Human Environment Relationships for Sustainability. Proceedings of the National
Academy of Sciences of the USA, 2012, 109 (35) 13908-13914;
https://doi.org/10.1073/pnas.1210106109
8-Lin, D.; Hanscom, L.; Murthy, A.; Galli, A.; Evans, M.; Neill, E.; Mancini, M.S.; Martindill, J.;
Medouar, F.-Z.; Huang, S.; Wackernagel, M. Ecological Footprint Accounting for
Countries: Updates and Results of the National Footprint Accounts, 2012–2018.
Resources 2018, 7, 58. https://doi.org/10.3390/resources7030058
9- Rockström, J.; Steffen, W.; Noone, K.; Persson, A.; Chapin, F.S,III.; Lambin, E.; Lenton, T.M.;
Scheffer, M.; Folke, C.; Schellnhuber, H.; Nykvist, B.; De Wit, C.A.; Hughes, T.; van der
Leeuw, S.; Rodhe, H.; Sörlin, S.; Snyder, P.K.; Costanza, R.; Svedin, U.; Falkenmark, M.;
Karlberg, L.; Corell, R.W.; Fabry, V.J.; Hansen, J.; Walker, B.; Liverman, D.;
Richardson, K.; Crutzen, P.; Foley, J. Planetary boundaries: exploring the safe operating
space for humanity. Ecology and Society, 2009, 14(2): 32. Available online:
http://www.ecologyandsociety.org/vol14/iss2/art32/
10- Steffen, W.; Richardson, K.; Rockström, J.; Cornell, S.; Fetzer, I.; Bennett, E.; Biggs, R.; Carpenter,
S.; Vries, W.; de Wit, C.; Folke, Ca.; Gerten, D.; Heinke, J.; Persson, L.; Ramanathan, V.;
Reyers, B.; Sörlin, S. Planetary Boundaries: Guiding Human Development on a
Changing Planet. Science, 2015;. 347 no. 6223 DOI: 10.1126/science.1259855
11- Vörösmarty, C.J.; McIntyre, P.B.; Gessner, M.O.; Dudgeon, D.; Prusevich, A.; Green, P.; Glidden,
S.; Bunn, S.E.; Sullivan, C.A.; Reidy Liermann, C.; Davies P.M. Erratum: Global
threats to human water security and river biodiversity. Nature, 2010; 468, 334
12- WEF. Water is a growing source of global conflict. Here’s what we need to do. World Economic
Forum, 2019; Accessed July 2020.
https://www.weforum.org/agenda/2019/03/water-is-a-growing-source-of-global-conflict-heres-what-we-need-to-do/
13- WWF. Living Planet Report - 2018: Aiming Higher. Grooten, M. and Almond, R.E.A. (Eds). WWF,
Gland, Switzerland, 2018; ISBN 978-2-940529-90-2
14- Albert, J.S.; Destouni, G.; Duke-Sylvester, S.M.; Magurran, A.E.; Oberdorff, T.; Reis, R.E.;
Winemiller, K.O.; Ripple, W.J. Scientists’ warning to humanity on the freshwater
biodiversity Crisis. Royal Swedish Academy of Sciences, 2020,
https://doi.org/10.1007/s13280-020-01318-8
15- IPCC. Summary for Policymakers. In: Global warming of 1.5°C. An IPCC Special Report on the
impacts of global warming of 1.5°C above pre-industrial levels and related global
greenhouse gas emission pathways, in the context of strengthening the global response
to the threat of climate change, sustainable development, and efforts to eradicate
poverty. World Meteorological Organization: Geneva, Switzerland, 2018.
16- WWAP (United Nations World Water Assessment Programme). The United Nations World
Water Development Report 2015: Water for a Sustainable World. Paris, UNESCO 15.
17-IPBES. Global Assessment on Biodiversity and Ecosystem Services Draft, 2019.
https://www.ipbes.net/system/tdf/ipbes_global_assessment_chapter_2_2_nature_unedi
ted_31may.pdf?file=1&type=node&id=35276
18- Griggs, D.; Smith, M.S.; Gaffney, O.; Rockström, J.; Öhman, C.M.; Shyamsundar, P.; Steffen, W.;
Glaser, G.; Kanie, N.; Noble, I. Sustainable development goals for people and planet.
Nature, 2013, 495 305–307; Available online: http://dx.doi.org/10.1038/495305a
19- Wackernagel, M.; Hanscom, L.; Lin, D. Making the Sustainable Development Goals Consistent
with Sustainability. Front. Energy Res. 2017. doi:10.3389/fenrg.2017.00018
20- UN, The Future we Want. Outcome document of the United Nations Conference on Sustainable
Development. Rio de Janeiro, 2012.
21- Millennium Ecosystem Assessment (Program). Ecosystems and human well-being. Washington,
D.C: Island Press, 2005.
22- CBD (2020). Zero Draft of the Post-2020 Global Biodiversity Framework. Convention on
Biological Diversity, 2020; CBD/WG2020/2/3, 6th January 2020, China.
23- UN. Transforming Our World: The 2030 Agenda for Sustainable Development. 2015,
A/RES/70/1. Available online:
https://sustainabledevelopment.un.org/content/documents/21252030%20Agenda%20fo
r%20Sustainable%20Development%20web.pdf
24- United Nations Conference on Sustainable Development, Agenda 21, Rio de Janeiro, 1992
25- Purvis, B.; Mao, Y.; Robinson, D. Three pillars of sustainability: in search of conceptual origins.
Sustainability Science, 2018, ISSN 1862-4065
26- Vörösmarty, Charles J. et al. “Ecosystem-based water security and the Sustainable Development
Goals (SDGs).” Ecohydrology and Hydrobiology, 2018, 18, 317-333.
27- UNEP. Managing and Conserving the Natural Resource Base for Sustained Economic and Social
Development. International Resource Panel Secretariat, Division of Technology,