Article
Modification Tests to Optimize the Compaction
Quality Control in Core Slate Random Embankments
for Highways
Evelio Teijón-López-Zuazo 1,*, Ángel Vega-Zamanillo 2, Miguel Ángel Calzada-Pérez 2 , Agostinho A. Benta and Ángel Robles-Miguel 1
1 Construction and Agronomy Department, Zamora Polytechnical School, Viriato Campus, University of
Salamanca, 49022 Zamora, Spain; [email protected] (E.T.-L.-Z.); [email protected] (A.R.-M.)
2 Department of Transportation and Projects and Processes Technology, Civil Engineering Technical School
of Santander, University of Cantabria, Los Castros Avenue, 39005 Santander, Spain; [email protected] (A.V.-Z.); [email protected] (M.A.C.-P)
3 Civil Engineering Department and RISCO – Risks and Sustainability in Construction. University of Aveiro,
Portugal; [email protected] (A.B.) * Correspondence: [email protected]
Abstract: Particle size can pose a challenge to random embankment compaction control methods, where practical techniques have hardly been developed and procedural control is used instead. In order to develop new quality control procedures for slate random fill, the necessary fieldwork and laboratory tests were carried out. This involved the revision of certain methods such as the wheel-tracking or topographic settlement tests. More than four thousand five hundred in-situ density and moisture content measurements were carried out for this research. In addition, more than five hundred and eighty topographic settlements and nine hundred and sixty wheel-tracking carriage tests were performed. The quality control processes were completed with more than one hundred and thirty plate bearing tests. Possible evidence of statistical correlations between compaction control tests were identified. An analysis of variance (ANOVA) was performed. When testing proved relationships between them, the replacement of one of them by the other was assessed by deduction. Finally, the study suggests new procedures for compaction quality control of random slate fill used in core area.
Keywords: slate; random fill; compaction quality control; wheel-tracking test; topographic settlement.
1. Introduction
In linear infrastructures, quality control of random embankments is carried out using tests that cannot effectively evaluate the compaction process. Sopeña [1] indicates that topographic settlements have no reference values. Zhong et al. [2] have developed a practical method for field engineers to conduct precise automatic online complete process monitoring of compaction parameters, which could address the disadvantages caused by the strong influence of human behavior or by the shortcomings of conventional methods. The system was successfully applied to the Nuozhadu dam and can thus be effectively applied to other civil works.
For Teijón et al. [3], pit gradings achieved through the weighing of different fractions of heavy rocks are not very practical. Wheel-track testing usually works for normal compaction conditions, whereas successful plate bearing tests require the diameter of the element to be five times the maximum size of the aggregate. Likewise, nuclear density gauging is limited by reason of particle dimensions and layer thicknesses above 30 cm. While the modified Proctor test is the reference value for the degree of compaction, its main disadvantage is the replacement of fines when using a 20mm sieve. In random fillings, less than 30% passing through a 20mm sieve means that there is a minimum
of 70% substitution material, which may lead to the conclusion that the test is not well represented. Substitution procedures such as in-situ determination of soil density using the sand method are not representative either, since such test is performed on soils whose maximum size is below 50 mm.
Mazari and Nazarian [4] have proved that the association of quality (defined as achieving adequate layer modulus) with the achievement of density is weak. Density and moisture measurements can be regarded as process control items, with modulus-based measurements being used for quality acceptance. The influence depth of the LWD is affected by base thickness and the functional parameters of the device itself, such as loading plate diameter. Thus, design moduli can be estimated based either on empirical relations, or using a catalog established for common local geomaterials.
For Fernández et al. [5], this lack of progress in the area of compaction control justifies control procedures focused on test sections.
Although there is a broad variety of rocks, this study is exclusively focused on the slate family. The results obtained were, assessed for possible correlations between the in-situ dry density test, wheel-tracking test, topographic settlement and plate bearing test. The statistical processing of the results yielded dependence relations. The application of only representative tests avoids unnecessary interruptions and the need for high-cost equipment. Instructions were also reformulated with the purpose of defining efficient thresholds.
1.1. Metamorphic rock (slate)
Fernández et al. [5] consider that it is possible to use rocks with low resistances (below 25 MPa) to obtain random fill. Such rocks are usually obtained from the demolition of structural and pavement concrete. Although the quality of slates and shales is lower than that of other materials such as grauwackes, because their strong anisotropic behavior associated with stratification and granulometric degradation after compaction is difficult to predict, they can be considered stable rocks and suitable for usage as random fill. This can encourage high percentages of slab forms. Several experiments on test sections of stony materials have been conducted. Since the mechanical strength of grauwacke (a detrital rock formed from the consolidation of disintegrated granite minerals) is lower than that of granite, it usually ends up forming random fill.
The laboratory and field compaction data reported by Horpibulsuk et al. [6] show that the relationship between relative density and number of roller passes is represented by the logarithm function in laterite soils. Likewise, Oteo [7] associates the requirements of materials to be used in fills not only with the concept of plasticity, but also with granulometry and variation of maximum dry density.
Onana et al. [8] study the geological, geotechnical and mechanical characterization of charnockite-derived laterite gravels from Southern Cameroon. The geotechnical and mechanical tests conducted for such materials yielded the following data: fine particles (16.22-44.10%), plasticity index (26-55%), California bearing ratio (31-68%), compressive strength (0.88-1.20MPa), indirect tensile strength (0.07-0.15 MPa). According to the Casagrande plasticity chart, the tested laterite gravels are clayey and highly plastic, which is due to their high kaolinite content. Southern Cameroon laterite materials are very low compressibility clayey gravel (GC) or silty gravel (GM) and can be used as sub-base layers for any volume of traffic.
Regarding embankment seats, Sagaseta [9] indicates that associations could develop in random fills, which are made up of evolutionary materials such as shales (fine grain detrital sedimentary rocks). In these cases, deferred settlements can become increased by the action of external agents (weathering, freezing cycles) that highly damage these rocks.
The Construction Embankment Technical Guide [10] provides a classification of rocks characterized by the special behavior of their materials. Such materials must, in turn, be classified according to their geologic name, leading to six types of rock that are known as the R6 group and
1.2. Compaction control.
The working method is defined according to certain specifications, among which are the technical characteristics of the machinery to be used, the excavation, loading, transportation and extension of stone material methods, layer thickness, compaction procedures, number of roller passes, optimum moisture content adjustment procedures, tests using similar materials with the same implementation method and, finally, the possibility of increasing compaction assessment through post-compaction irrigation.
Oteo [7] indicates that a material made up of altered bolus granite should be used as random fill. A specific study should be conducted before excavation, transport and setting in place, and the appropriate control system must also be selected, since the classic Proctor test is hardly useful as a reference for such heterogeneous materials. The Spanish standard specifications [11] stating that the second / first modulus ratio determined by the plate bearing test (k) should be under 2.2 should be reconsidered, since such limit was traditionally established for fine soils, which are very different from random fill materials. For this reason, another specification is proposed where higher k values might be accepted when Ev2 increases. For soils with large-sized particles, the wheel-tracking and
plate bearing tests are believed to be the most appropriate control tests. On the other hand, for control of compacted random fill, the plastic density method, alongside geophysical methods, would be best. Radioactive isotope density can lead to specific problems in rock lacking fine fractions, since, because of their dimensions, the particles of such rocks do not allow the introduction of a gamma emitter into the ground. While it is still possible to measure backscattering, the soil volume tested for influence is inevitably smaller. Therefore, the measurements performed belong to the most superficial area, which is where the impact of the compaction energy is higher. Hence, this method offers higher values than thickness measurements, so that it should be correctly correlated with other control tests. Wan-Huan et al. [12] found that, considering initial porosity conditions, the proposed method can estimate the SWCCs (Soil Water Characteristic Curve) of soils with different initial dry densities. Based on several experiments using highway test sections, Fernández et al. [5] concluded that the results obtained from plate bearing tests show scatter. Hence, the k ratio value increases at the same time as the module of the second loading stage (Ev2).
For the wheel-tracking test, seat measurements are performed before and after carriage passes at ten points that are 1m apart from each other. This should be correlated with the plate bearing soil test and average settlement should not exceed 3mm.
Sun et al. [13] carried out certain experiments on 75 × 75 × 87 cm crushed rock samples subjected to vertical cyclic loading. Three coarsely crushed rock samples with initial grain sizes of 16–40, 25–50 and 50–80 mm were used to measure the corresponding parameters. According to their results, cyclic vibration loading can cause breakage and abrasion of particles and their edges in the coarsely crushed rock layer, and particles also tend to be rounded and non-angular. This results in particle rearrangement and particle-size reduction with an increase in fines content in the coarsely crushed rock layer, thus reducing its porosity. Compared with initial average porosity before cyclic loading, reduction rates in final average porosity in the three crushed rock samples after cyclic loading at 18,000 cycles were 6.53, 7.45 and 8.08%, which correspond to initial grain sizes of 16–40, 25–50 and 50–80 mm, respectively.
García et al. [14] compare different compaction control methods, analyzing the granular sub-ballast that works as the sub-base in railway lines. Nevertheless, Ev2 does not provide information
on the compaction degree, so that other criteria using Ev1 are considered more appropriate.
first modulus are considered more appropriate. This underdevelopment suggests the need for a new compaction control procedure, which entails the need for different functional parameters, such as automatic online complete process monitoring or specific loading plate diameters. The strongly anisotropic properties of slate make it suitable for its use in random fill or sub-base layers for any traffic volume.
2. Materials and Methods
The materials were obtained from the A-66 Spanish highway, Cáceres (N) - Aldea del Cano section, which is also where the in-situ tests were performed.
2.1. Materials
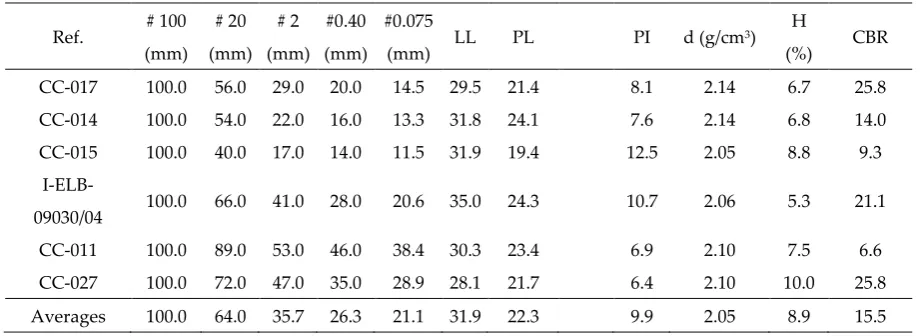
Table 1 provides a summary including examples of the tests that were conducted on the slate alluvial material during excavation, the last row showing average values.
Table 1. Examples of physical parameters for slate alluvial material identification.
Ref. # 100 (mm)
# 20 (mm)
# 2 (mm)
#0.40 (mm)
#0.075
(mm) LL PL PI d (g/cm
3) H
(%) CBR CC-017 100.0 56.0 29.0 20.0 14.5 29.5 21.4 8.1 2.14 6.7 25.8 CC-014 100.0 54.0 22.0 16.0 13.3 31.8 24.1 7.6 2.14 6.8 14.0 CC-015 100.0 40.0 17.0 14.0 11.5 31.9 19.4 12.5 2.05 8.8 9.3
I-ELB-09030/04 100.0 66.0 41.0 28.0 20.6 35.0 24.3 10.7 2.06 5.3 21.1 CC-011 100.0 89.0 53.0 46.0 38.4 30.3 23.4 6.9 2.10 7.5 6.6 CC-027 100.0 72.0 47.0 35.0 28.9 28.1 21.7 6.4 2.10 10.0 25.8 Averages 100.0 64.0 35.7 26.3 21.1 31.9 22.3 9.9 2.05 8.9 15.5
These soils come from the alteration of slates and are associated with low to medium plasticity. According to the USCS classification (Unified Soil Classification System), most of them belong to the GC group of the coarse-grained soils wrapped in a clay matrix. Large sizes of the parent rock remain, the percentage after sifting through the 20mm sieve being 64%, and, at the same time, there is an important percentage of fine fractions, with an average of 21% after using fine sieve (0.075 mm). Bedrock weathering variations resulted in the classification of a significant number of samples within the group of high plasticity silts (MH). The existence of coarse sizes implies that CBR testing yielded high values, with an average of 15.
2.2. Methods
2.2.1. Laboratory and Field Tests
This subsection describes the control methods and ensuing specifications for compaction control according to satisfactory results in the experimental sections. More than 4500 in-situ density and moisture measurements, UNE 103900 [15], 850 modified Proctor, 960 wheel-tracking tests, UNE 103407 [16], 580 topographic settlements and 130 plate bearing tests (ɸ 600mm), UNE 103808 [17], were performed during the research.
Initially, compaction control test procedures were revised in order to verify their effectiveness, modifying the wheel-tracking test and topographic settlement. The core includes foundation and backfills.
are taken by placing the metal device on each measurement point, before and after the loaded carriage passes. There must be 10 measurement points, spaced 1m apart from each other and aligned to the left side of the carriage. This means a reduced testing length compared to the usual in compaction batches, which is between 100-200 m. Moreover, peg layout was modified to make the test more representative, spacing the points 10m apart from each other. The rut to the left of the carriage proved equal to that of the right, rendering driver weight influence insignificant due to the vehicle’s suspension performance. Similarly, there are other dead weights such as the fuel tank that allows both sides to balance out. Therefore, it is preferable to arrange pegs into 2 rows, 1 for each roll of the carriage. Finally, 2 points are checked using the fill profile. Thus, the final arrangement of the 10 measurement points consists of 2 rows with 5 measurement points each, separated every 10 meters by 2 measurement points, as shown in figure 1. This new arrangement allows the testing of 40m against the initial 10m. Additionally, 2 measurements per section help to compensate for any possible errors resulting from single measurements of heterogeneous material.
Figure 1. Revised wheel-tracking test: location of measuring points.
The leveling peg can be quickly rearranged with edging stakes every 20m. They should be inside the layer, at the same surface level. An initial leveling of the slabs must be carried out. Leveling on metal pegs is not necessary to position the measuring device “H” on each point, since the topographic focus is placed directly on the metal pegs. This adds speed to the test by not having to transport the “H” and, most importantly, it prevents the lack of accuracy involved in measuring with the milestone resting on the ground, thus ensuring millimeter precision. The passing of the twin wheels over the alignment pegs is carried out by guiding the carriage using its front axle. Passing the front wheels through the middle of the slab ensures symmetry. The next step is to place the metal frame in a centered position on the measurement point, but above the twin wheels. To ensure homogeneous support of the “H” structure in the rut, it includes captive screws that allow regulation of the transversal frame, adapting it to the wheel impression. Once the leveling nail of the “H” is vertical where the peg is, readings should be conducted through topographic leveling on the “H”. The values for the depression caused by the passage of the carriage at each levelling point are obtained by subtracting the constant value of the height of the metal template, and by the difference of measurements. The value of the rut is calculated as the average mean of the 10 measurement points (δm). This value is the degree of compaction index. A new limit of 4mm was proposed and extreme
It allows the testing of 5 times the length of the initial test and offers 2 measurements per section. Reduction of leveling errors by means of a fixed point over the leveling peg. Millimetric accuracy
is guaranteed, avoiding ground distortion.
Higher performance by reducing test times. The first measurements were made over the pegs without the need to move the heavy metal support frame.
The dynamic effects of carriage acceleration-braking are minimized. The revised test assures that speed is constant when the carriage passes over the pikes.
2 measurements per section allow a fuller and more detailed check of the section than the measurement of a single point. When measuring in 2 parallel and independent ruts, any exceptional deficiency in one of them can be corrected. In addition, second-order effects such as driver or fuel tank weight are excluded from the test.
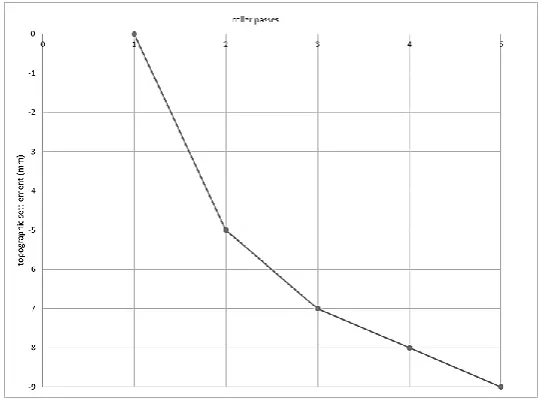
Another significant control test is topographic settlement. There is a standard procedure test in which the last roll pass must be below 1% of the thickness of the compacted layer. This settlement must be measured after the first roll pass. Figure 2 shows how the first pass has easily exceeded such settlement threshold. Besides, there are undefined indicators in the arrangement of the dots, their spacing and how they are measured.
Figure 2. Topographic settlement. Experimental section slate random fill 800mm.
In addition, it does not establish a new origin for the repetition of seats in case of non-compliance and maintaining the original settlement after the first pass could give rise to ambiguities and even lead to rejecting the layer before its compaction has finished. Therefore, this control method and its limitations should be thoroughly revised. As shown in the figure above, topographic control should achieve value stabilization by increasing the number of passes when compaction is completed. In addition, the measurement points must be defined, proposing the same layout as in the wheel-tracking test. Therefore, as in said test, extreme values deviating from the mean were excluded.
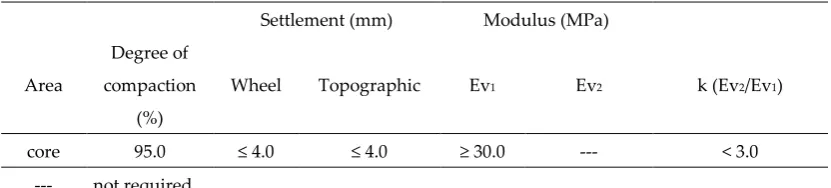
Table 2. General specifications suggested for random fills.
Settlement (mm) Modulus (MPa)
Area
Degree of compaction
(%)
Wheel Topographic Ev1 Ev2 k (Ev2/Ev1)
core 95.0 ≤ 4.0 ≤ 4.0 ≥ 30.0 --- < 3.0 --- not required
The degree of compaction proposed is associated with a modified Proctor compaction energy level. All the tests were performed under the same moisture conditions to prevent soil stiffness increases and noticeable dry density decreases in the plate bearing test as a result of decreases in water content to below optimum.
2.2.1. Statistical Estimation
Multilinear adjustment models with dependency relationships have been examined, such relationships allowing assessment of the dependent variables without the need to run them. All the models include well-defined validity zones.
Since there was a large number of lots, the Kolmogorov-Sminornov test was used instead of the Shapiro-Wilk test. Sometimes the Shapiro-Wilk test is used as a contrast. Specifically, 225 compaction lots were processed. Every compaction lot was subjected to a minimum of 2 tests. The independent variables used for each control lot were generated and introduced into the IBM SPSS statistic program. More than 12 variables were analyzed. The independent variables that obtained low absolute values in the Student's t-test were discarded, since they were not significant for statistical adjustment. Thus, the independent variables used were the following:
• d: average lot density [g/cm3].
• s: average settlement between last and first roller pass [mm]. • h: average wheel impression after test carriage [mm]. • Ev1: first vertical modulus of the plate bearing test [MPa].
• Ev2: second vertical modulus of the plate bearing test [MPa].
• k: relation between second and first modulus of the plate bearing test (Ev2 / Ev1).
A coefficient of determination value of R2 ≥ 0.70 was the general cutoff point for a strong
relationship. An analysis of variance (ANOVA) was performed, showing the sums of squares, the degrees of freedom and Levene’s F statistic.
3. Results
Possible linear correlations between 2 compaction control tests were extensively explored. Test results were gathered in compaction lots, so that the batches with the 2 analyzed tests were represented as dots. The linear nature of the adjustment studied the definition of variable as dependent or independent irrelevant.
Possible correlations between 225 compaction lots were evaluated. There was no relationship between the following tests: density–topographic settlement test, wheel-tracking–topographic settlement test, and first–second modulus plate bearing test (ɸ 600mm).
3.1. Relationship between Wheel-Tracking and Topographic Settlement Tests
Figure 3. Scatterplot for wheel-tracking and topographic settlement tests.
The high value of the Pearson correlation coefficient ρ = 0.843 shows a strong relationship between the wheel-tracking and the topographic settlement tests, as detailed in table 3. The coefficient of determination R2 = 0.710 means a variance percentage of 71.0%. The standard error is only
0.1475mm.
Table 3. Determination coefficients of wheel-tracking and topographic settlement tests.
Summary model
R R2 R2 fit standard error
0.843a 0.710 0.637 0.1475
a Predictors: constant, h (mm)
As shown in table 4, Levene test is significant (sig = 0.035 <0.05) with a value of F = 9.786. Consequently, the homoscedasticity criterion is not met. The variances are significantly different. The variables, therefore, are related.
Table 4. Variance analysis wheel impression and topographic settlement tests.
ANOVA a
model sum of
squares degrees of freedom
quadratic
average F sig.
regression 0.213 1 0.213 9.786 0.035 b
sampling error 0.087 4 0.022
total 0.3 5
a dependent variable: s (mm) b predictors: (constant), h (mm)
Table 5 shows high t-values of 11.237 and 3.128, both of them significant.
Table 5. Linear regression coefficients in wheel-tracking and topographic settlement tests.
Coefficients a
model
nonstandard coefficients standard
coefficients t sig,
B standard error beta
(constant) 2.446 0.218 11.237 0.000
h (mm) 0.257 0.082 0.843 3.128 0.035
a dependent variable: s (mm)
According to the coefficients, the linear fit equation for the topographic settlement and the wheel-tracking tests is:
s = 2.446 + 0.257 h R2 = 0.710 (1)
s being the topographic settlement test and h being the wheel-tracking test, both reflected in millimeters. The function domain uses the intervals of [2.5 ≤ s ≤ 3.5] and [1.5 ≤ h ≤ 4.0].
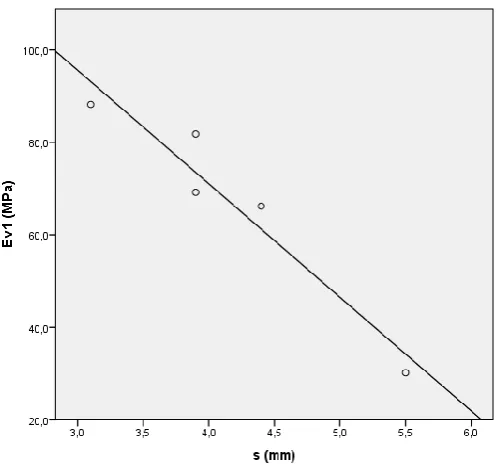
3.2. Relationship between Wheel-Tracking Test and First Modulus Plate Bearing Test
As shown in figure 4, there is a high correlation between the wheel-tracking test and the first modulus plate bearing test (ɸ 600mm), with inverse proportionality. In this case, high values for the wheel-tracking test correspond to low values for the first modulus plate bearing test.
Figure 4. Scatterplot for wheel-tracking test and first modulus plate bearing test (ɸ 600mm).
Table 6 shows a high Pearson correlation coefficient value, ρ = 0.990, which is associated with low dispersion. The coefficient of determination R2 = 0.980 yields a variance of 98%. The standard
Table 6. Determination coefficients for wheel-tracking test and first modulus plate bearing test.
Summary model
R R2 R2 adjusted standard error
0.990 a 0.980 0.975 4.1934
a Predictors: constant, h (mm)
Table 7 shows the ANOVA results. Levene’s test proved significant sig = 0.000 with a value of F = 199.826. Therefore, the null hypothesis of homoscedasticity is rejected and variances are significantly different.
Table 7. Variance analysis wheel impression test and first modulus plate bearing test.
ANOVA a
model sum of squares degrees of freedom
quadratic
average F sig.
regression 3.513.855 1 3513.855 199.826 0.000 b
sampling error 70.338 4 17.585
total 3584.1932 5
a dependent variable: Ev1 (MPa) b predictors: (constant), h (mm)
The t-test in table 8 offers high values, 32.576 and -14.136, both significant (sig = 0).
Table 8. Linear regression coefficients wheel-tracking test and first modulus plate bearing test.
Coefficients a
model
nonstandard coefficients standard
coefficients t sig.
B standard error beta
(constant) 129.468 3.974 32.576 0.000
h (mm) -26.291 1.904 -0.990 -14.136 0.000
a dependent variable: Ev1 (MPa)
Moreover, the wheel impression test predicts the first vertical modulus of the plate bearing test. Besides the linear regression coefficients, the fit between the wheel impression test and the first modulus of the plate bearing test (ɸ 600mm) is:
Ev1 = 129.468 – 26.921 h R2 = 0.980 (2)
where Ev1 is the first modulus of the plate bearing test in megapascals and h is the
wheel-tracking test in millimeters. The domain of the function between the intervals is [20 ≤ Ev1 ≤ 110] and
[0.5 ≤ h ≤ 4.5].
3.3. Relationship between Topographic Settlement Test and First Modulus Plate Bearing Test
Figure 5. Scatterplot for topographic settlement test and first modulus plate bearing test (ɸ 600mm).
Table 9 shows a high Pearson correlation coefficient value, ρ = 0.962 and a low standard error of Se = 7.1343 MPa. The coefficient of determination validates a variance of 92.5%. All the parameters suggest a high correlation between both variables.
Table 9. Determination coefficients topographic settlement test and first modulus plate
bearing test.
Summary model
R R2 R2 adjusted standard error
0.962 a 0.925 0.9 7.1343
a Predictors: constant, s (mm)
ANOVA parameters are in table 10. Levene’s test is significant, F = 36.847, sig =
0.009. The homoscedasticity criterion is not clearly met. Since the variables are
strongly related, variances are significantly different.
Table 10. Analysis of variance for topographic settlement test and first modulus plate bearing
test.
ANOVA a
model sum of squares degrees of
freedom quadratic average F sig. regression 1875.433 1 1875.433 36.847 0.009 b
sampling error 152.695 3 50.898
total 2028.128 4
a dependent variable: Ev1 (mm) b predictors: (constant), s (mm)
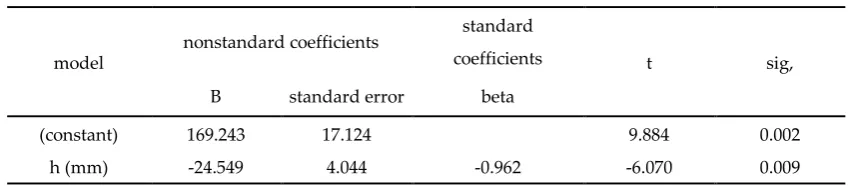
Table 11. Linear regression coefficients for topographic settlement test and first modulus plate bearing test.
Coefficients a
model
nonstandard coefficients standard
coefficients t sig,
B standard error beta
(constant) 169.243 17.124 9.884 0.002
h (mm) -24.549 4.044 -0.962 -6.070 0.009
a dependent variable: Ev1 (MPa)
According to the linear regression coefficients, the adjustment line is:
Ev1 = 169.243 – 24.549 s R2 = 0.925 (3)
where Ev1 is the first module of the plate bearing test (ɸ 600mm) in megapascals and the
topographic settlement test in millimeters. The domain of the function uses the [20 ≤ Ev1 ≤ 100] and
[3.0 ≤ s ≤ 6.0] intervals.
3.4. Relationship between Topographic Settlement Test and Second Modulus Plate Bearing Test
As shown in figure 6, there is a high correlation between topographic settlement and first modulus plate bearing test. The distribution is inversely proportional to the lower settlement values corresponding to the higher values of the second modulus of the plate bearing test (ɸ 600mm).
Table 12 illustrates a high Pearson correlation coefficient, ρ = 0.995. There is a low standard error Se = 4.5260 MPa and a high coefficient of determination R2 = 0.990. In other words, there is a high
correlation associated with low dispersion.
The ANOVA analysis parameters are shown in table 13. Levene’s test is clearly significant, sig = 0.005 with a value of F = 19.251, therefore the assumption of homoscedasticity criterion is not met, since variances are significantly different. The variables clearly have a strong dependency relationship.
Table 13. Variance analysis for topographic settlement test and second modulus plate bearing
test.
ANOVA a
model sum of squares degrees of freedom quadratic average F sig. regression 3951.860 1 3951.860 19.251 0.005 b
sampling error 40.970 2 20.845
total 3992.830 3
a dependent variable: Ev2 (mm) b predictors: (constant), s (mm)
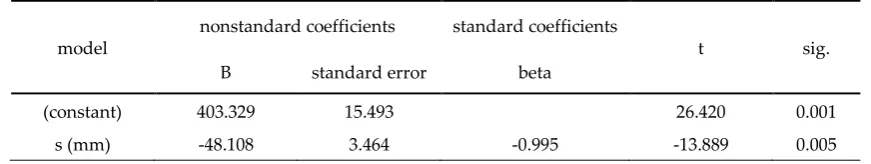
Student's t test values are significant. As shown in table 14, there is a significant contribution of the topographic settlement in the second modulus plate bearing test (ɸ 600mm).
Table 14. Linear regression coefficients for topographic settlement test and second modulus
plate bearing test.
Coefficients a
model
nonstandard coefficients standard coefficients
t sig.
B standard error beta
(constant) 403.329 15.493 26.420 0.001
s (mm) -48.108 3.464 -0.995 -13.889 0.005
a dependent variable: Ev2 (MPa)
The expression of the adjustment line is:
Ev2 = 403.329 – 48.108 s R2 = 0.985 (4)
where s is the topographic settlement in millimeters and Ev2 is the second modulus plate bearing
test in megapascals. The domain of the function has values between [140 ≤ Ev2 ≤ 240] and [3.5 ≤ s ≤
6.0].
3.5. Slate Random Fill Significance Matrix
Table 12. Determination coefficients for topographic settlement test and second modulus plate
bearing test.
Summary model
R R2 R2 adjusted standard error
0.995 a 0.990 0.985 4.5260
The results were grouped into a significance matrix, as shown in table 15, which also presents the combinations of analyzed tests with their coefficients of determination. When nonsignificant, the numerical value has been replaced by ns (not significant). Some terms were not considered for being obvious.
Table 15. Slate random fill significance matrix.
Determination coefficients (R2)
d (g/cm3) h (mm) s (mm) Ev1 (MPa) Ev2 (MPa) k (Ev2 / Ev1)
d (g/cm3) ---
h (mm) ns ---
s (mm) ns 0.710 ---
Ev1 (MPa) 0.874 0.925 ---
Ev2 (MPa) 0.990 ns ---
k (Ev2 / Ev1) ---
ns: nonsignificant
The in-situ density did not correlate with any other variable. Alternatively, with the first modulus of plate bearing test (ɸ 600 mm), the wheel-tracking and topographic settlement tests proved to have a strong relationship. A revised control method has been designed for the in-situ density test and the plate load test.
4. Discussion
The wheel-tracking test lacks precision in that the distance tested is very short and that the measurements are taken at soil surface level. Therefore, the wheel-tracking test has been revised in order to improve such shortcomings. The improved wheel-tracking test includes defining the use of pegs, more measurement points and assessment of a longer distance. Even so, the strong correlation of this improved version with the plate bearing test means that the plate bearing test (ɸ 600mm) could replace the improved wheel-tracking test.
The traditional topographic settlement test usually measures the first and last compaction roller passes. In the improved topographic settlement test, measurements are also taken twice, but not at the first compaction roller pass. Instead the two measurements are taken after the compaction roller passes the second to last time and after the last compaction roller pass.
Even after the topographic settlement test had been improved, its correlation with the plate bearing test (ɸ 600mm) was so strong that the plate bearing test could easily replace it as well. Although there were significant improvements in both the topographic settlement test and the wheel-tracking test, the plate bearing test correlates so strongly with both that the plate bearing test (ɸ 600mm) could replace the two of them.
As the maximum dry density is obtained by laboratory compaction using a Modified Proctor test, the degree of compaction is obtained from the field of dry density. However, average density control using nuclear methods is characterized by its high heterogeneity, low performance and testing of only low degrees of thickness, making plate bearing tests necessary to assess stiffness. To evaluate the quality of compacted soil only from the results of plate bearing tests, these were performed using compacted soils with a moisture content within a specific interval (-2, +1%) above Modified Proctor optimum water content (wopt). A decrease in the water content from wopt according
5. Conclusions
In some cases, the maximum size of the random-fill particles hinders the accurate execution of several tests, including the in-situ density test, modified Proctor, plate bearing test, topographic settlement and wheel-tracking test. For this reason, the wheel-tracking test and the topographic settlement test were revised and improved to optimize their results. The statistical processing of the control tests has simplified the quality control procedure in slate random fills. Some of the major contributions and findings of the study are:
A new wheel-tracking test procedure was proposed, with measurement points in 2 rows of 5 measurement points placed 10 meters away from each other.
The entire topographic settlement control method was reviewed, considering its limitations. Measurements were taken after the second to last compaction roller pass and after the last compaction roller pass.
The wheel-tracking test correlates strongly with other compaction control tests and can therefore be replaced to avoid redundant results.
For core slate random fill, adjustments have been made to replace the topographic settlement test and the wheel-tracking test with the load plate bearing test (ɸ 600mm).
In conclusion, the improved tests proposed for the quality control are the in-situ density test and the plate bearing test (ɸ 600mm).
Author Contributions: All authors have read and agree to the published version of the manuscript. Data
curation, L.-Z. and A.B.; formal analysis, L.-Z.; investigation, L.-Z. and A.B.; methodology, L.-Z.; project administration, L.-Z.; resources, L.-Z.; software, L.-Z. and A.R-M.; supervision, E.T.-L.-Z., Á .V.-Z. and M.Á .C.-P.; validation, E.T.-E.T.-L.-Z., Á .V.-Z. and M.Á .C.-P.; writing–original draft, E.T.-L.-Z.; writing–review and editing, E.T.-L.-Z., Á .V.-Z. and M.Á .C.-P.
Funding: This research received no external funding.
Conflicts of Interest: The authors declare no conflict of interest.
References
[1] L.M. Sopeña, “Compaction control and in-situ tests”, 2007, II Journal on marginal materials in road works, ATC-AIPCR World Road Association.
[2] Zhong et al., “Real-time compaction quality monitoring of high core rockfill dam”, 2011, Science China-Technological Sciences, 54(7), 1906–1913. 10.1007/s11431-011-4429-6.
[3] E. Teijón, Á. Vega, M.Á. Calzada, “Quality control compaction revision on rock crushed”, 2019, Carreteras, 4(223), 54-61.
[4] M. Mazari, S. Nazarian, “Mechanistic approach for construction quality management of compacted geomaterials”, 2017, Transportation Geotechnics, 13(2017), 92-102. 10.1016/j.trgeo.2017.08.001.
[5] F. Fernández F et al., Rock and random fill test fills, 2009, INTEMAC quarterly nº75 – 3rd quarter.
[6] S. Horpibulsuk, A. Suddeepongb, P. Chamket, A. Chinkulkijniwat, “Compaction behavior of fine-grained soils, lateritic soils and crushed rocks”, 2013, Soils and foundations, 53(1), 166-172. 10.1016/j.sandf.2012.12.012.
[7] C. Oteo, Stabilization and reinforcement of marginal materials, 2007, II Workshop on marginal materials in road works, ATC-AIPCR World Road Association.
[8] V.L. Onana, A. Ngo’o Ze, R. Medjo Eko, R.F.D. Ntouala, M.T. Nanga Bineli, B. Ngono Owoudou, G.E. Ekodeck, “Geological identification, geotechnical and mechanical characterization of charnockite-derived lateritic gravels from Southern Cameroon for road construction purposes”, 2017, Transportation Geotechnics, 10 (2017), 35-46. 10.1016/j.trgeo.2016.12.001
[9] C. Sagaseta, Geotechnical aspects of embankment-viaduct transitions, 2007, Journal on embankment-viaduct transitions, ATC-AIPCR World Road Association.
[10] Laboratoire Central des Ponts et Chaussées [LCPC]. Service d´Études Techniques des Routes et Autoroutes [SETRA], Centre de Sécurité et des Techniques Routières, Technical Guide Embankments and upgrades [GTR]. Fascicle 1. General principles, (2003).
[12] Z. Wan-Huan, Y. Ka-Veng, T. Fang, “Estimation of soil–water characteristic curve and relative permeability for granular soils with different initial dry densities”, Engineering Geology, 179 (2014), 1-9. 10.1016/j.enggeo.2014.06.013.
[13] B. Sun, L. Yang, W. Bai, Q. Liu, X. Xu, “Experimental investigation on porosity reduction of a coarsely crushed rock layer subject to vertically cyclic loading”, Cold Regions Science and Technology, 104–105 (2014), 88–96. 10.1016/j.coldregions.2014.05.004.
[14] García JL, Santiago E, Comparison of different compaction control methods in sub-ballast, 2011, Journal Rutas, 142[1], pp. 66-70.
[15] UNE 103900. In situ determination of density and moisture content of soil and granular materials by nuclear methods: low depths.