R E S E A R C H
Open Access
Diagnostic accuracy of diffusion-weighted
imaging with conventional MR imaging for
differentiating complex solid and cystic ovarian
tumors at 1.5T
Ping Zhang
1†, Yanfen Cui
2†, Wenhua Li
2*, Gang Ren
2, Caiting Chu
2and Xiangru Wu
3Abstract
Background:Preoperative characterization of complex solid and cystic adnexal masses is crucial for informing patients about possible surgical strategies. Our study aims to determine the usefulness of apparent diffusion coefficients (ADC) for characterizing complex solid and cystic adnexal masses.
Methods:One-hundred and 91 patients underwent diffusion-weighted (DW) magnetic resonance (MR) imaging of
202 ovarian masses. The mean ADC value of the solid components was measured and assessed for each ovarian mass. Differences in ADC between ovarian masses were tested using the Student’st-test. The receiver operating characteristic (ROC) was used to assess the ability of ADC to differentiate between benign and malignant complex adnexal masses.
Results:Eighty-five patients were premenopausal, and 106 were postmenopausal. Seventy-four of the 202 ovarian masses were benign and 128 were malignant. There was a significant difference between the mean ADC values of benign and malignant ovarian masses (p < 0.05). However, there were no significant differences in ADC values between fibrothecomas, Brenner tumors and malignant ovarian masses. The ROC analysis indicated that a cutoff ADC value of 1.20 x10⁻³mm2/s may be the optimal one for differentiating between benign and malignant tumors. Conclusions:A high signal intensity within the solid component on T2WI was less frequently in benign than in malignant adnexal masses. The combination of DW imaging with ADC value measurements and T2-weighted signal characteristics of solid components is useful for differentiating between benign and malignant ovarian masses.
Keywords:Ovary, Ovarian tumors, Diffusion-weighted imaging, Apparent diffusion coefficients
Background
Ovarian tumors are the leading indication for gynecologic surgery, and the preoperative characterization of complex solid and cystic adnexal masses is crucial for informing patients about possible surgical strategies. Recently, in order to improve quality of life, laparoscopic surgery has been increasingly used for the treatment of ovarian tumors that are believed to be benign. For malignant ovar-ian lesions, there is no evidence that laparoscopy for the
management of early stage ovarian tumors may improve the quality of life [1-3].
Ultrasonography (US) is the first-line imaging modality for adnexal lesions and is a particularly useful preopera-tive test for the characterization of noncomplex masses. Magnetic resonance imaging (MRI) may be of great help in identifying malignant lesions before surgery, particu-larly when US findings are suboptimal or indeterminate [4-10]. MRI can reveal morphologic characteristics such as papillary projections, nodularity, septa, solid portions and signal intensity on T1- and T2-weighted images, but none of these criteria reliably distinguish between benign and malignant tumors. The use of magnetic resonance (MR) diffusion-weighted imaging (DWI) may improve
* Correspondence:[email protected] †Equal contributors
2
Department of Radiology, Xinhua Hospital affiliated to Shanghai JiaoTong University School of Medicine, Shanghai 200092, China
Full list of author information is available at the end of the article
MR characterization of ovarian lesions. Diffusion-weighted imaging is sensitive to changes in the microdif-fusion of water into both intracellular and extracellular spaces. Differences in the apparent diffusion coefficient (ADC) of benign and malignant complex adnexal masses have been reported [11-13]. Kayayama et al. [11] and Fujii et al. [14] assessed the feasibility of DWI for the differentiation of benign and malignant ovarian lesions. They concluded that the ADC values of cystic and solid components were not useful for differentiating between lesions. However, their data included endometrial cysts, mature cystic teratomas, and fibromas and fibrotheco-mas, in which hemorrhagic contents, sebaceous materi-als and fibrous tissue may cause an increase or a reduction in signal on DWI.
The purpose of this study was to clarify the relation-ship between the ADC values of the solid components of benign and malignant ovarian lesions, and to evaluate the supplementary use of ADC values of the solid com-ponents for differentiating between benign and malig-nant lesions.
Methods
Patients
Our institutional review board approved the study and waived the requirement to obtain written informed con-sent. A total of 601 female patients evaluated for ovarian tumors between January 2005 and December 2011 were enrolled. A retrospective review of MRI data was under-taken. The MRI studies met the following inclusion cri-teria for the study: (1) MRI was performed using a 1.5T magnet, and (2) both conventional MRI with DWI and dynamic contrasted-enhancement MRI were performed. In addition, the diagnosis was confirmed by surgery and pathological examination. Of the 601 patients, 383 were excluded due to the presence of endometriomas (n = 73), mature cystic or immature teratomas (n = 39), and purely cystic ovarian lesions (including simple cysts and purely cystic adenomas) with thin and regular walls and/or septa (n = 232). A further 27 were excluded due to failed fat suppression or artifacts. The remaining 191 patients with 202 complex adnexal masses were included in the study.
MR protocol
All subjects underwent MRI with a 1.5T MR unit (Twinspeed, GE Medical Systems, Milwaukee, WI, USA). The imaging protocol involved axial non-contrast T1-weighted (TR/TE, 400-600/10-14 ms) and axial T2-weighted (TR/TE, 4,000-6,000/100-120 ms) imaging performed with a chemical shift-selective fat saturation pulse using the following parameters: slice thickness, 5 mm; gap, 1 mm; field of view (FOV), 32 to 42 cm; matrix, 256 × 256; and excitation, 2. Sagittal T1-weighted and T2-weighted (TR/TE, 3,000-6,000/100-110 ms) fast
spin-echo imaging without chemical shift-selective fat satur-ation pulse was also performed, as well as post-contrast enhanced axial and sagittal T1-weighted imaging using parameters as described above, apart from a slice thick-ness of 5 mm. Diffusion-weighted MRI was acquired in the axial plane prior to administration of contrast medium using a single-shot echo-planar imaging se-quence (TR/TE effective range, 8,000-10,000/70-100; slice thickness/intersection gap, 5/1 mm; FOV, 32 to 42 cm; matrix, 128 × 128; excitation, 2. A b-value of 0 and of 1,000 s/mm2 was also applied in three orthogonal (Z, Y, and X) directions.
MRI analysis
Conventional MRI and DWI imaging data were analyzed on an Advantage Windows workstation 4.2 (GE Health-care, Milwaukee, WI, USA) by two radiologists (with 15- and 10- year experience in pelvic MRI, respectively), in consensus, having carefully reviewed all images. The solid component, according to a previously established classification by Timmerman et al. [7] included thick-ened septa, vegetation (papillary projection) and solid portions that showed enhancement post-injection. The cystic component was defined as tissue with homoge-neous long T1 and T2 characteristics or different signal intensities on T1- or T2-weighted MR images, and showed no enhancement post-injection. The signal in-tensity of solid components on T2-weighted MR images was defined as low or intermediate (equal to or greater) compared to that of the outer myometrium. The signal intensity of the cystic and solid components on DWI at b = 1,000 s/mm2 was classified as intermediate or low com-pared to that of serous fluid (urine or cerebrospinal fluid).
Data calculation and analysis
The solid components of the lesions were identified on T2-weighted and post-contrast T1-weighted images, and were matched on ADC maps. The ADC values of the solid components of each tumor were measured on DW images by a radiologist using an Advantage Windows workstation 4.2 (GE Healthcare), using the manufacturer’s software (FuncTool; GE, Medical Systems, Milwaukee, WI, USA). In order to minimize variability, the largest possible regions of interest (ROIs), which varied from 15 to 150 mm2, were manually placed in the solid parts of the tumor. When the lesion exhibited irregular or heterogeneous solid components, numerous vegetations or thickened ir-regular septa, between two and five ROIs were drawn within the targeted components and the mean ADC value was used in the analysis.
Statistical analysis
were performed using SPSS version 13.0 for Windows (SPSS, Chicago, IL, USA). Differences in mean tumor ADC values between benign and malignant groups were evaluated using Student’s t-test. A P-value < 0.05 was considered statistically significant. Receiver operating characteristic (ROC) curve analysis was performed in order to assess the diagnostic performance of the mean ADC values in terms of characterization of benign and malignant ovarian tumors.
Results
Clinical demographics
The surgical pathological types of 202 complex adnexal masses in 191 patients can be seen in Table 1. The mean patient age was 56.52 ±15.31 (mean±SD; range, 12 to 85) years. Eighty-five women (44.5%) were premenopau-sal and 106 (55.5%) were postmenopaupremenopau-sal. Seventy-four (36.6%) of the 202 ovarian masses were benign, and 128 (63.4%) were malignant.
MRI findings
A high signal intensity within the solid component on T2-weighted MR images was observed less frequently in benign (39/74) than in malignant (108/128) adnexal masses (P < 0.01). The solid portion of 74 benign complex adnexal lesions contained homogeneous or heterogeneous low signal intensity on T2-weighted images in 100% of cystadenofibromas (Figure 1), 83.3% of fibrothecomas (Figure 2), 80.0% of Brenner tumors, 23.5% of mucinous cystadenomas, and 21.4% of serous cystadenomas (Figure 3). Among 128 malignant complex adnexal masses, only 20 (15.6%) displayed a low signal
intensity of their solid components on T2-weighted images (Figure 4). On DWI, a high signal intensity at
b = 1,000 s/mm2 within the solid component was
observed less frequently in benign (71.6%) than in malig-nant (100%) adnexal masses (P <0.05). Our results dem-onstrate that the following factors can be considered predictive of malignancy: the presence of a solid compo-nent with high or low signal intensity on T2-weighted images and high signal intensity on DWI with low ADC values (less than 1.20 × 10⁻³mm2/s) at b = 1,000 s/mm2. On the other hand, the following factors can be consid-ered predictive of a benign mass: the presence of a solid component with high or low signal intensity on T2-weighted images and high signal intensity on DW images with high ADC values (greater than 1.20 × 10⁻³mm2/s), or low signal intensity on T2-weighted images and DW images with lower ADC values at b = 1,000 s/mm2.
ADC analysis
The mean ADC values of the tumor solid components were determined for each group. There was much over-lap between the range of values observed for benign and for malignant tumors. However the mean ADC value for benign tumors was 1.22 ± 0.46 × 10⁻³ mm2/s, and for malignant tumors 0.91 ± 0.20 × 10⁻³mm2/s, which was a significant difference (P < 0.05). This result suggests that an ADC value≥1.20 × 10⁻³mm2/s may be the opti-mal cutoff for differentiating between benign and opti- malig-nant tumors, with a sensitivity of 66.7%, a specificity of 90.9%, a positive predictive value (PPV) of 81.4%, a nega-tive predicnega-tive value (NPV) of 82.1%, and an area under the curve (AUC) of 0.72. In our study, the mean ADC
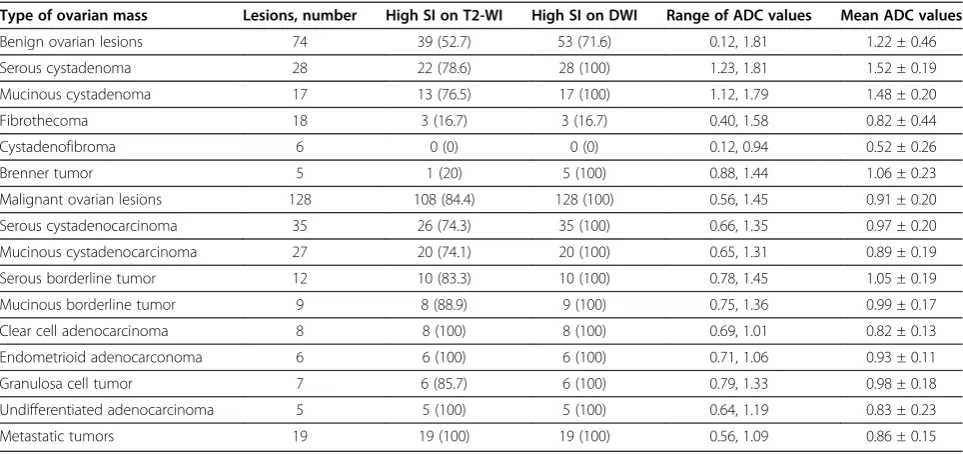
Table 1 Histological types and apparent diffusion coefficient (ADC) values of 202 ovarian masses
Type of ovarian mass Lesions, number High SI on T2-WI High SI on DWI Range of ADC values Mean ADC values
Benign ovarian lesions 74 39 (52.7) 53 (71.6) 0.12, 1.81 1.22 ± 0.46 Serous cystadenoma 28 22 (78.6) 28 (100) 1.23, 1.81 1.52 ± 0.19 Mucinous cystadenoma 17 13 (76.5) 17 (100) 1.12, 1.79 1.48 ± 0.20 Fibrothecoma 18 3 (16.7) 3 (16.7) 0.40, 1.58 0.82 ± 0.44 Cystadenofibroma 6 0 (0) 0 (0) 0.12, 0.94 0.52 ± 0.26 Brenner tumor 5 1 (20) 5 (100) 0.88, 1.44 1.06 ± 0.23 Malignant ovarian lesions 128 108 (84.4) 128 (100) 0.56, 1.45 0.91 ± 0.20 Serous cystadenocarcinoma 35 26 (74.3) 35 (100) 0.66, 1.35 0.97 ± 0.20 Mucinous cystadenocarcinoma 27 20 (74.1) 20 (100) 0.65, 1.31 0.89 ± 0.19 Serous borderline tumor 12 10 (83.3) 10 (100) 0.78, 1.45 1.05 ± 0.19 Mucinous borderline tumor 9 8 (88.9) 9 (100) 0.75, 1.36 0.99 ± 0.17 Clear cell adenocarcinoma 8 8 (100) 8 (100) 0.69, 1.01 0.82 ± 0.13 Endometrioid adenocarconoma 6 6 (100) 6 (100) 0.71, 1.06 0.93 ± 0.11 Granulosa cell tumor 7 6 (85.7) 6 (100) 0.79, 1.33 0.98 ± 0.18 Undifferentiated adenocarcinoma 5 5 (100) 5 (100) 0.64, 1.19 0.83 ± 0.23 Metastatic tumors 19 19 (100) 19 (100) 0.56, 1.09 0.86 ± 0.15
values were much lower for cystadenofibromas, fibrothe-comas and Brenner tumors. There was no statistically significant difference between values for fibrothecomas, Brenner tumors and malignant tumors (P > 0.05), but there was a significant difference between values observed for cystadenofibromas and for malignant tumors (P = 0.002). When cystadenofibromas, fibrothe-comas and Brenner tumors were excluded from the ana-lysis, the sensitivity, specificity, PPV, NPV, and AUC for the optimal cutoff ADC value of 1.20 × 10⁻³mm2/s for differentiating between benign and malignant tumors, were 97.7%, 90.1%, 86.6%, 99.1%, and 0.96, respectively (Figure 5).
Discussion
Our findings demonstrate that the presence of high sig-nal intensity in solid components of ovarian lesions on DW and T2-weighted imaging combined with low ADC values can be used to distinguish malignant from benign ovarian lesions. The results also suggest a potential role for DW imaging with quantitative analysis of ADC values in improving the diagnostic performance of ovar-ian MRI and yielding functional measures of the tumor microenvironment.
In the present study, ADC values are largely propor-tional to the ratio of extracellular and intracellular com-ponents, cell density, intracellular organelles, matrix fibers, and soluble macromolecules. Although some overlap in ADC values was observed between the benign and malignant groups, the mean ADC value of the 128 malignant ovarian tumors was significantly lower than that of the 74 benign ovarian tumors (P < 0.05). Our results suggest that an ADC value ≥ 1.20 × 10⁻³mm2/s may be the optimal cutoff for differentiating between benign and malignant tumors. Furthermore, a sensitivity of 66.7%, a specificity of 90.9%, a PPV 81.4%, an NPV of 82.1%, and an AUC of 0.72, was observed with this ADC cutoff value. This result is consistent with previ-ous reports [10,12,15,16]. In a study by Fujii et al. [14], the authors evaluated the contribution of DWI in combination with quantitative ADC analysis to the characterization of 123 ovarian lesions, which included 42 malignant and 81 benign lesions (including 7 fibro-mas, 18 mature cystic teratomas and 24 endometrio-mas). The results suggest that DW imaging of ovarian lesions and ADC values of the solid component are not useful for differentiating between benign and ma-lignant ovarian lesions. This apparent discrepancy is probably due to the pathologic architectures of benign tumors. In our series, 83.3% (15/18) of fibrothecomas, 100% (6/6) of cystadenofibromas and 80% (4/5) of Brenner tumors demonstrated low signal intensity in the solid components on DWI and low ADC values, due to the presence of abundant collagen-producing Figure 1A 67-year-old woman with an ovarian
fibroblastic cells and a dense network of collagen fibers within the extracellular matrix, which can restrict the Brownian motion of water molecules. Previous studies have also reported that endometriomas and mature
teratomas exhibit low ADC values [11]. This could ex-plain the observed absence of a difference between the mean ADC values of benign and malignant ovarian lesions in the study by Fujii et al. [14].
Figure 2A 27-year-old woman with an ovarian fibrothecoma.(A) An axial T1-weighted image shows a right ovarian mass with hypointensity. (B) Axial T2-weighted image shows a solid heterogeneous signal mass; the area containing abundant fibrous tissue has marked low signal intensity (arrow) and the area containing an abundant thecoma component has intermediate signal intensity (arrowhead). (C) On axial diffusion-weighted imaging (DWI), the apparent diffusion coefficient (ADC) value of the fibrous tissue area is very low (circle 1, ADC = 1.05 × 10⁻³ mm2/s) and that of the thecoma component is very high (circle 2, ADC = 1.45 × 10- 3mm2/s). (D) Sagittal T2-weighted image demonstrates
endometrial thickening.
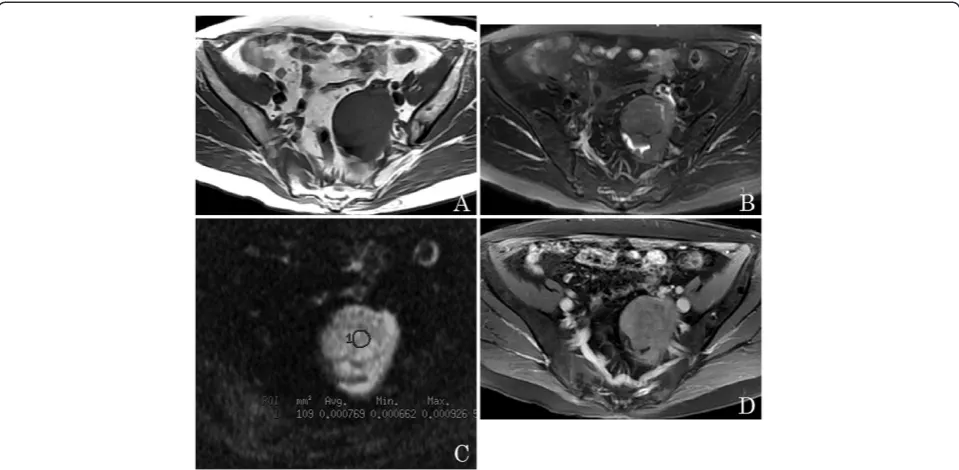
Figure 3A 28-year-young woman with bilateral benign serous ovarian cystadenomas.(A) An axial T1-weighted image shows a pelvic tumor with hypointensity. (B) Axial T2-weighted image shows a complex adnexal tumor with solid and cystic components, and solid components as vegetations with intermediate signal intensity (arrow). (C) Axial diffusion-weighted imaging (DWI) obtained at b =1,000 s/mm2
shows the solid component as hyperintense with a high apparent diffusion coefficient (ADC) value (circle 1, ADC = 1.26 × 10⁻³mm2/s), and the
cystic component with an even higher value (circle 2, ADC = 2.59 × 10- 3mm2/s). (D) Axial contrast-enhanced T1-weighted image demonstrates
Furthermore, our study confirms that high signal in-tensity within solid components with low ADC values on DWI is a useful criterion for predicting malignancy. In our study, on T2-weighted images solid components of malignant tumors had high signal intensity in 84.4% and low signal intensity in 15.6%. On the other hand, 100% of solid components in malignant lesions had high signal intensity on DW images with low ADC values. This finding, that of low signal intensity on T2-weighted
images and high signal intensity on DWI in solid compo-nents, may result from a reduction in both the extracellu-lar matrix and the diffusion space of water protons in the extracellular and intracellular dimensions due to an increased nuclear to cytoplasmic ratio and hypercellular-ity. However, the low signal intensity on T2-weighted images and DWI in benign ovarian tumors such as fibrothecomas, cystadenofibromas and Brenner tumors, may be due to the high density of fibers, the low cellularity, Figure 4A 63-year-old woman with a left ovarian cystadenocarcinoma.(A) An axial T1-weighted image shows a left pelvic mass with isointensity. (B) Axial T2-weighted image reveals that the mass is a solid tumor with low signal intensity. (C) Axial diffusion-weighted imaging (DWI) obtained at b = 1,000 s/mm2reveals the solid tumor as hyperintense with a lower apparent diffusion coefficient (ADC) value (circle 1, ADC = 0.769 × 10⁻³mm2/s). (D) Axial contrast-enhanced T1-weighted image demonstrates marked enhancement of the solid part.
Figure 5Comparative diagnostic values of quantitative apparent diffusion coefficient (ADC) value parameters for discriminating between benign and malignant ovarian tumors.When an absolute ADC value less than 1.20 × 10⁻³mm2/s is predictive of malignancy, on
and the low water content in both extracellular and intra-cellular spaces [13-20]. Our study suggests that low signal intensity on T2-weighted images and DWI with low ADC values within a solid component is an effective criterion for predicting the presence of benign disease.
There were several limitations to our study. First, the exclusion of endometriomas and mature cystic terato-mas and pure cystic adenoterato-mas may have induced a selection bias. As recommended by Takeuchi et al. [16], the DWI findings of endometriomas and mature cystic teratomas are problematic, and most cases can be accurately diagnosed on conventional MRI. Secondly, drawing the ROI on DW images while viewing T2-weighted or contrasted T-weighted images may have resulted in an information bias, as DWI usually has poor spatial reso-lution. A better approach would be to fuse DW images at b = 1,000 × 10-3mm2/s onto structural images in order to accurately position the ROI of solid components that show an abnormal signal on DW images. Thirdly, the reported ADC threshold value needs to be validated in a larger group of patients, as many factors can affect the ADC value, including magnetic susceptibility, spatial resolution, signal to noise ratio, and the pathophysiological characteris-tics of the ovarian lesion.
Conclusion
DWI appears to be a useful method for differentiating between benign epithelial ovarian tumors with solid components and malignant ovarian tumors, and is asso-ciated with high sensitivity and specificity. The solid component within the complex adnexal mass that exhi-bits low signal intensity on T2-weighted images and DW images is invariably benign. In addition, a notable advan-tage of DWI is that it avoids further impairment of renal function, as the use of contrast medium is not necessary. For patients with renal failure, this would prevent the development of fibrosis.
Competing interests
This work had no specific funding. The authors declare that they have no conflict of interest.
Authors’contributions
WH Li planned, designed and analyzed the study, collected data and wrote the manuscript, YF Cui, G Ren collected data, P Zhang designed the study, XR Wu contributed as a pathologist and helped in writing the manuscript. All authors read and approved the final manuscript.
Acknowledgements
We thank Huarong Gong, Huitao AN, Qiufeng Yin, and Ming Liu for technical support.
Author details
1
Department of Obstetrics and Gynecology, Xinhua Hospital affiliated to Shanghai JiaoTong University School of Medicine, Shanghai 200092, China.
2
Department of Radiology, Xinhua Hospital affiliated to Shanghai JiaoTong University School of Medicine, Shanghai 200092, China.3Department of
Pathology, Xinhua Hospital affiliated to Shanghai JiaoTong University School of Medicine, Shanghai 200092, China.
Received: 16 August 2012 Accepted: 18 October 2012 Published: 9 November 2012
References
1. Medeiros LR, Freitas LB, Rosa DD, Silva FR, Silva LS, Birtencourt LT, Edelweiss MI, Rosa MI:Accuracy of magnetic resonance imaging in ovarian tumor: a systematic quantitative review.Am J Obstet Gynecol2011,204(67):e1–10. 2. Lalwani N, Prasad SR, Vikram R, Shanbhogue AK, Huettner PC, Fasih N:
Histologic, molecular, and cytogenetic features of ovarian cancers: implications for diagnosis and treatment.Radiographics2011,31:625–646. 3. Bazot M, Nassar-Slaba J, Thomassin-Naggara I, Cortez A, Uzan S, Darai E:MR imaging compared with intraoperative frozen-section examination for diagnosis of adnexal tumors; correlation with final histology.Eur Radiol
2006,16:2687–2699.
4. Timmerman D, Valentin L, Bourne TH, Collins WP, Verrelst H, Vergote I:
Terms, definitions and measurements to describe the sonographic features of adenexal tumors: a consensus opinion from the International Ovarian Tumor Analysis (IOTA) Group.Ultrasound Obstet Gynecol2000,
16:500–505.
5. Bazot M, Darai E, Nassar-Slaba J, Lafont C, Thomassin-Naggara I:Value of magnetic resonance imaging for the diagnosis of ovarian tumors: a review.J Comput Assist Tomogr2008,32:712–723.
6. Sohaib SAA, Sahdev A, Trappen PV, Jacobs IJ, Reznek RH:Characterization of adnexal mass lesions on MR imaging.AJR2003,180:1297–1304. 7. Ghossain MA, Buy JN, Ligneres C, Bazot M, Hassen K, Malbec L, Hugol D,
Truc JB, Decroix Y, Poitout P:Epithelial tumors of the ovary: comparison of MR and CT findings.Radiology1991,181:863–870.
8. Jung SE, Lee JM, Rha SE, Byun JY, Jung JI, Hahn ST:CT and MR imaging of ovarian tumors with emphasis on differential diagnosis.Radiographics
2002,22:1305–1325.
9. Thomassin-Naggara I, Darai E, Cuenod CA, Rouzier R, Callard P, Bazot M:
Dynamic contrast-enhanced magnetic resonance imaging: a useful tool for characterizing ovarian epithelial tumors.J Magn Reson Imaging2008,
28:111–120.
10. Thomassin-Naggara I, Darai E, Cuenod CA, Fournier L, Toussaint I, Marsault C, Fournier L, Tossaint I, Marsault P, Bazot M:Contribution of diffusion-weighted MR imaging for predicting benignity of complex adnexal masses.Eur Radiol2009,19:1544–1552.
11. Katayama M, Masui T, Kobayashi S, Ito T, Sakahara H, Nozaki A, Kabasawa H:
Diffusion-weighted echo planar imaging of ovarian tumors: is it useful to measure apparent diffusion coefficients?J Comput Assist Tomogr2002,
26:250–256.
12. Li WH, Chu CT, Cui YF, Zhang P, Zhu MJ:Diffusion-weighted MRI: a useful technique to discriminate benign versus malignant ovarian surface epithelial tumors with solid and cystic components.Abdom Imaging
2012,37:897–903.
13. Moteki T, Ishizaka H:Evaluation of cystic ovarian lesions using apparent diffusion coefficient from turboFLASH MR images.Br J Radiol1998,
71:612–620.
14. Fujii S, Kakite S, Nishihara K, Kanasaki Y, Harada T, Kigawa J, Kaminou T, Ogawa T:Diagnostic accuracy of diffusion-weighted imaging in differentiating benign from malignant ovarian lesions.J Magn Reson Imaging2008,28:1149–1156.
15. Thomassin-Naggara I, Toussaint I, Perrot N, Rouzier P, Cuenod CA, Bazot M, Darai ED:Characterization of complex adnexal masses: value of adding perfusion- and diffusion-weighted MR imaging to conventional MR imaging.Radiology2011,258:793–803.
16. Takeuchi M, Matsuzaki K, Nishitani:Diffusion-weighted magnetic resonance imaging of ovarian tumors: differentiation of benign and malignant solid components of ovarian masses.J Comput Assist Tomogr
2010,34:173–176.
17. Li XC, Zhang WD, Zhu GB, Liu QG, Shen YC:Imaging features and pathologic characteristics of ovarian thecoma.J Comput Assist Tomogr
2012,36:46–53.
18. Umemoto M, Shiota M, Shimono T, Hoshiai H:Preoperative diagnosis of ovarian tumors, focusing on the solid area based on diagnostic imaging.
19. Erturk SM, Ichikawa T, Sano K, Motosugi U, Sou H, Araki T:
Diffusion-weighted magnetic resonance imaging for characterization of focal liver masses: impact of parallel imaging (SENSE) and b value.
J Comput Assist Tomogr2008,32:865–871.
20. Nakai G, Matsuki M, Inada Y, Tatsugami F, Tanikake M, Narabayashi I, Yamada T:Detection and evaluation of pelvic lymph nodes in patients with gynecologic malignancies using body diffusion-weighted magnetic resonance imaging.J Comput Assist Tomogr2008,32:764–768.
doi:10.1186/1477-7819-10-237
Cite this article as:Zhanget al.:Diagnostic accuracy of diffusion-weighted imaging with conventional MR imaging for differentiating complex solid and cystic ovarian tumors at 1.5T.World Journal of Surgical Oncology201210:237.
Submit your next manuscript to BioMed Central and take full advantage of:
• Convenient online submission
• Thorough peer review
• No space constraints or color figure charges
• Immediate publication on acceptance
• Inclusion in PubMed, CAS, Scopus and Google Scholar
• Research which is freely available for redistribution