Available Online atwww.ijcsmc.com
International Journal of Computer Science and Mobile Computing
A Monthly Journal of Computer Science and Information Technology
ISSN 2320–088X
IJCSMC, Vol. 4, Issue. 11, November 2015, pg.64 – 71
RESEARCH ARTICLE
Design of Incremental Data Mining
Algorithm [IMA] and its Performance
Evaluation over Cumbersome Warehouse
Ashish Saxena
1, Prof.(Col). Gurmit Singh
21
Ph.D. Scholar Shepherd Institute of Engg, &Technology, SHIATS(AAI-DU) , Allahabad, India
Prof Emeritus, Deptt of Computer Sc. and Information Tech, SSET, SHIATS (AAI- DU )NAINI, Allahabad -211007, India
Abstract— In the current world of large datawarehouse there is a need of developing and incremental data mining algorithm which can mine data from large warehouse in lesser time utilizing less memory .In the current study the emphasis is laid on developing IMA incremental data mining algorithm and is a performance evaluation over existing incremental data mining algorithm[DELTA] using MATLAB and SPSS 16.0
Keywords— updatecount function, Getfrequent, minsup, Fknown, count
I. INTRODUCTION
Data mining is an analytic process designed to explore data (usually large amounts of data - typically business or market related) in search of consistent patterns and/or systematic relationships between variables, and then to validate the findings by applying the detected patterns to new subsets of data. The ultimate goal of data mining is prediction - and predictive data mining is the most common type of data mining and one that has the most direct business applications. The process of data mining consists of three stages: (1) the initial exploration, (2) model building or pattern identification with validation/verification, and (3) deployment (i.e., the application of the model to new data in order to generate predictions).
II. REVIEW OF LITERATURE
Chen et.al. (2011) worked onIncremental learning from stream data and used the concept of tree like structure. Mark et al. (2011) worked on a financial data mining model for extracting customer behavior. He used the concept of clustering as a case of incremental data mining using large warehouse of aims at developing an intelligent Financial Data Mining Model (FDMM) for extracting customer behaviour in the financial industry, so as to increase the availability of decision support data and hence increase customer satisfaction. The proposed financial model first clusters the customers into several sectors, and then finds the correlation among these sectors. It was noted that better customer segmentation can increase the ability to identify targeted customers, therefore extracting useful rules for specific clusters can provide an insight into customers buying behavior and marketing implications. To validate the feasibility of the proposed model, a simple dataset collected from a financial company in Hong Kong. The simulation experiments show that the proposed method not only can improve the workflow of a financial company, but also deepen understanding of investment behaviour. Thus, a corporation is able to customize the most suitable products and services for customers on the basis of the rules extracted. Sung et al.(2011) worked on forecasting changes in Korea Composite Stock Price Index (KOSPI) using association rules. They used the association rule mining for obtaining golden association rules over large data warehouse.
Lin et al.( 2012)worked on incremental mining of a short Chinese text using incremental clustering algorithm based on weighted semantics and naive bayes , which worked on a cluster based approach. The availability of large quantity of text documents from the world wide web and business document management systems has made the dynamic separation of texts into new categories as a very important task for every business intelligence systems. But, the presented text clustering algorithms still suffer from problems of practical applicability. In order to improve the performance of document clustering, ontologies are useful. Ontology is nothing but the conceptualization of a domain into an individual identifiable format, but machine-readable format containing entities, attributes, relationships and axioms. By analyzing all types of techniques for document clustering, a clustering technique depending on Genetic Algorithm (GA) is determined to be better as GA is a global convergence technique and has the ability of determining the most suitable cluster centres without difficulties. They proposed a new document clustering scheme with fuzzy ontology based genetic clustering is proposed. They experimental results reveal that the proposed approach increases the accuracy to a large extent and the clustering time is also highly reduced.
III.METHODOLOGY
The count function is used in a new pass in addition to the delta algorithm. The synthetic standard warehouses T10I4D100K of about 50 million data is used as incremental warehouse .The algorithms were applied on it by programming these algorithms in MATLAB7.6 .The values of FDB and NDB are obtained in the form of support are returned at
the end of execution of algorithm .The statistical analysis of the results obtained by MATLAB 7.6 has been done on SPSS16.0 .The comparative graphs of DELTA and IMA algorithm along with statistical analysis are generated in SPSS16.0 and comparison is made between them. The steps are shown in Figure1
Fig1: Steps taken in data mining performance evaluation of incremental data-mining algorithm
The (IMA) Incremental Mining Algorithms
The DELTA used for mining have only three passes, however , proposed IMA uses four passes, The IMA in the 1st pass reads previous database and then increments d(database
element) using the updatecount function, by this some item sets may become frequent in
N(Negative border database element) .The infrequent itemsets are denoted in Fknown. These itemsets are extracted using the function Getfrequent .The infrequent itemsets are calculated by Infrequent =(FdbUNdb)- Fknown..In the 2nd pass of the algorithm these itemsets are used
for pruning.If some itemsets do not move from Ndb to Fknown, then the negative border of Ndb of Fknown is computed by using apriori function. Itemsets in Nknown with unknown counts are stored in Nu thus the remaining counts are all infrequent. Any itemset in Nu and their extension are computed. If there are no elements in Nu their extensions. Any itemset which is not frequent in db cannot be frequent in DBUdb.
In the 3rd pass all possible extensions of Fknown which could be in form ((FDBUdb )U
(NDBUdb))and store them in set count C. This is done by computing the layers of negative borders closure of Fknown .It is expected that all the other remaining layers can be generated together since the number of the two itemsets in Fknown is typically much smaller than the total number of 2-itemsets pairs. Initially C is reset to zero using the function of reset count. Then at every stage of computation of closure, those itemsets that are in Infrequent and Infrequent db are removed so that none of the extensions are generated. Itemsets from Fknown
and Nu are removed from C. In this pass the counts within db of the remaining itemsets C are Synthetic
Standard Dataset T10I4d100k Of About 50 Million Data DELTA / IMA algorithm in
form of code in MATLAB7.6
Results in the form of FDB ,NDB which gives the
computed. The 4th pass scans the set of minsup *| D U d | and returns FDBudb(frequent itemsets)
andNDBudb(Negative Border)values, which gives a unique value of support .This value of
support is used to evaluate the performance of the algorithm.
IV.FINDING
MULTILAYER PERCEPTON ANALYSIS OF DELTA AND IMA ALGORITHM
The multilayer percepton analysis of DELTA and IMA was done on SPSS16.0. It gave the following results are obtained are shown in tabular form.
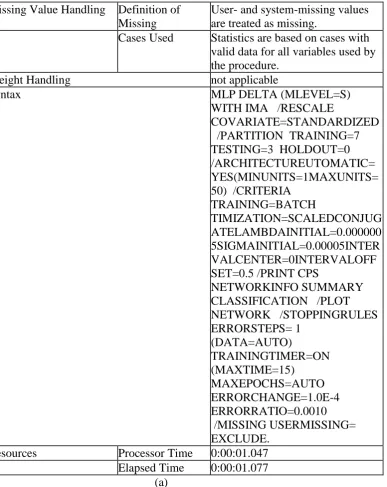
Table 1 Multilayer Percepton analysis of DELTA and IMA (MLLEVEL=S)
Missing Value Handling Definition of Missing
User- and system-missing values are treated as missing.
Cases Used Statistics are based on cases with
valid data for all variables used by the procedure.
Weight Handling not applicable
Syntax MLP DELTA (MLEVEL=S)
WITH IMA /RESCALE
COVARIATE=STANDARDIZED /PARTITION TRAINING=7 TESTING=3 HOLDOUT=0 /ARCHITECTUREUTOMATIC= YES(MINUNITS=1MAXUNITS= 50) /CRITERIA
TRAINING=BATCH
TIMIZATION=SCALEDCONJUG ATELAMBDAINITIAL=0.000000 5SIGMAINITIAL=0.00005INTER VALCENTER=0INTERVALOFF SET=0.5 /PRINT CPS
NETWORKINFO SUMMARY CLASSIFICATION /PLOT NETWORK /STOPPINGRULES ERRORSTEPS= 1
(DATA=AUTO)
TRAININGTIMER=ON (MAXTIME=15)
MAXEPOCHS=AUTO ERRORCHANGE=1.0E-4 ERRORRATIO=0.0010 /MISSING USERMISSING= EXCLUDE.
Resources Processor Time 0:00:01.047
Elapsed Time 0:00:01.077
Case Processing Summary
N Percent
Sample Training 20 83.3%
Testing 4 16.7%
Valid 24 100.0%
Excluded 0
Total 24
(b)
Network Information
Input Layer Covariates 1 IMA
Number of Unitsa 1
Rescaling Method for Covariates Standardized
Hidden Layer(s) Number of Hidden Layers 1
Number of Units in Hidden Layer 1a 5
Activation Function Hyperbolic tangent
Output Layer Dependent Variables 1 DELTA
Number of Units 1
Rescaling Method for Scale Dependents
Standardized
Activation Function Identity
Error Function Sum of Squares
a. Excluding the bias unit
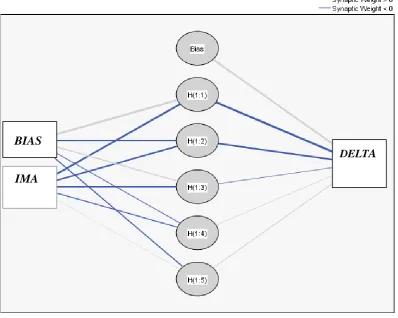
Fig 2Hidden layer Activation function of DELTA and IMA algorithm
On performing hidden layer analysis of DELTA and IMA, it is observed that IMA has higher value of hidden layer activation function than DELTA. From the figure 2 it is evident that IMA pertains more synaptic threads as compared to DELTA. Thereby IMA is having more efficiency.
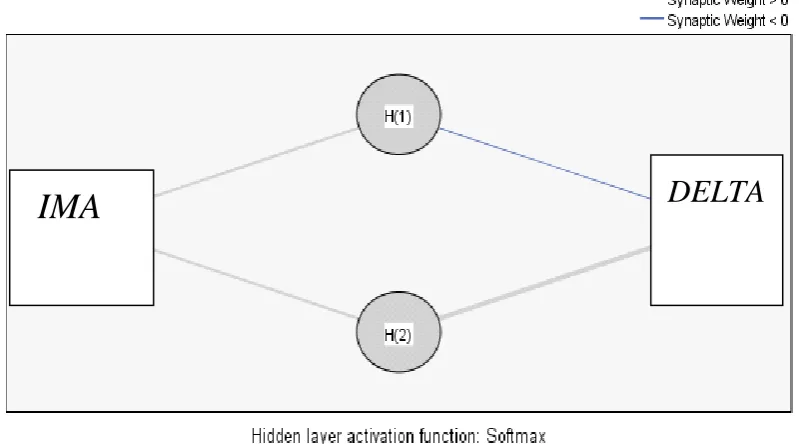
HIDDEN LAYER ACTIVATION ANALYSIS OF DELTA AND IMA ALGORITHM
The DELTA and IMA were analyzed over the radial function Softmax and outer layer activation function Identity. We find that the Synaptic weight of IMA is higher than that of DELTA. Thus, IMA has high performance
IMA
BIAS
(d)
Fig 3: Hidden Layer Activation Function Analysis of DELTA and IMA
From the above it is clear that on using the hidden layer activation function, Softmax the performance of IMA is higher than that of DELTA as synaptic weight of IMA is always greater than zero, from the figure 3 it is evident that IMA is having more storage for memory as compared with DELTA
V. CONCLUSIONS
From the above it is clear that IMA is more efficient than existing DELTA incremental data mining algorithm .This algorithm can be used in the case of pattern recognition , pattern evaluation and image processing in future.
REFERENCES
[1] Sung, H.N., So, Y. S, (2011) “ Forecasting changes in Korea Composite Stock Price
Index (KOSPI) using association rules”, Expert Systems with Applications, vol. 38, no. 7,
9046–9049p,2011
[2] Mark K.Y. Mak , George T.S. Ho and S.L. Ting (2011) “ A Financial Data Mining
Model for Extracting Customer Behavior” ,International journal of engineering , business
management., 2011, Vol. 3, No. 3,59-72p,2011
[3] P. Lin, Z. Lin, B. Kuang, P. Huang,(2012) A Short Chinese Text Incremental Clustering Algorithm Based on Weighted Semantics and Naive Bayes, Journal of Computational Information Systems, 2012, 4257- 4268p,2012
[4]Madhyastha, T. and Tanimoto, S. (2009), Student Consistency and Implications for Feedback in Online Assessment Systems. In Proceedings of the 2nd International Conference
on Educational Data Mining, 81-90p,2009
[5]Miller, H., &Han, J. (2009). “Geographic data mining and knowledge discovery: An
overview.” In H. Miller & J. Han (Eds.) , Geographic data mining and knowledge discovery,
26p. CRC Press, Taylor and Francis Group,2009
[6] Momm, H., Easson, G., & Kuszmaul, J. (2009). “ Evaluation of the use of spectral and textural information by an evolutionary algorithm for multi-spectral imagery classification.” Computers, Environment and Urban Systems, 33(6), 463–471p,2009
[7]Yao, X.,and Thill, J.-C. (2007) “Neuro fuzzy modeling of context–contingent proximity
relations”. Geographical Analysis, 39(2), 169–194p,2007
Address for correspondence: Ashish Saxena,
S/O Dr Vinod Kumar Saxena, H No 41, UMANG,
MAHANAGAR PHASE –II, BAREILLY -243006
[U.P]
Mobile no 9639220491, 9639222923