Available online: https://edupediapublications.org/journals/index.php/IJR/ P a g e | 904
Soil Stabilization of Shrinkage Soils Using Molasses
M. Devender, M.Tech (Highway Engineering), Dept of Civil Engineering, GNIT, Hyderabad, Telangana, INDIA
Depavath Jagan, Teaching Assistant, Dept of Civil Engineering, JNTU-Sultanpur, Telangana, INDIA
Abstract- Expansive soils are active clays that pose problem to civil engineering structures. This is caused by structural and volume instability in the soil mass due to swelling and shrinkage characteristics triggered by moisture variation. These soils are found in widespread areas in the world. Several researches have been done and various methods and techniques have been proposed and developed for stabilization of expansive soils to improve engineering properties. During construction, the removal of expansive soils and replacement with suitable fill material is an appropriate method in areas where abundant suitable fill materials are available nearby. However, at places of limited suitable fill material within economical distance and if large thickness of poor sub-grade soil to be replaced occurs, the method is not suitable. The most commonly used technique is chemical stabilization with cement and lime. These chemicals are most effective when used on site with very controlled moisture of hydration and site-specific techniques. Other manufactured inorganic and organic compounds are used worldwide but most of them are not economically viable. Since most of them are import commodities they are very expensive. This is especially true for developing countries like INDIA. The rising cost of traditional stabilizing agents and the need for economical utilization of industrial and agricultural wastes for valuable engineering purposes has driven an investigation into the stabilizing potential of molasses (a byproduct of sugar industry) in expansive clay soils. The necessary laboratory tests, index tests, strength testes, swelling tests are incorporated for the natural as well as the stabilized soil. Chemical and physical testes to characterize the stabilizer molasses has also been carried out. Analysis of the results show that slight improvement on the geotechnical properties of Molasses stabilized soil. Molasses reduces plasticity
index, CEC, soil PH, swelling potentials and swelling pressure and OMC and increased MDD, CBR, UCS values as molasses content is increased up to certain percentage. On the other hand, if the Molasses is increased beyond certain percentage the reverse properties are observed. Curing has an insignificant effect on the geotechnical properties of molasses stabilized soil.
I. INTRODUCTION
Available online: https://edupediapublications.org/journals/index.php/IJR/ P a g e | 905 trachyte’s. (S.M & Julius K., 2012) Due to the fact
that the engineering properties of expansive soil are different from the same soil in other localities, researches on the engineering properties of expansive soil is essentially done [7-9].
The prevailing stabilization related solutions to resolve problems associated with expansive soil during constructions of roads and building are;
1) The use of traditional chemical stabilizers (lime
and cement). They are moderately expensive.
2) To use imported manufactured chemical
stabilizers, in most cases, most of them are not effective and proven not to improve engineering properties of expansive soil of our country. In addition, they are highly expensive. (Tesfahun, 2010). 3) The use of horizontal and vertical moisture barriers, for e.g. Geo-membranes, which are expensive and can’t be economical for the construction of long road sections.
4)The effectiveness of these mixed additives (soil
stabilizers) towards improving engineering property and cost reduction depends on the soil conditions, stabilizer properties, type and importance of construction (i.e., houses, roads, etc.). The selection of a particular additive depends on costs, benefits, availability, and practicality of its application. The relative occurrence of expansive soil along the construction site and the extent depth/ thickness of expansive soil formation also control the choice of stabilization method.
Soil stabilization:
Soil stabilization is the alteration of one or more soil properties to create an improved soil material possessing the desired engineering properties. There are three purposes for soil stabilization. These include; increasing the shear strength of an existing ground condition to enhance its load-bearing capacity (i), achieve a desired improved permeability (ii) and enhance the durability of the soil.
COMPONENT OF STABILIZATION:
Soil stabilization involves the use of stabilizing agents (binder materials) in weak soils to improve its geotechnical properties such as compressibility,
strength, permeability and durability. The
components of stabilization technology include soils and or soil minerals and stabilizing agent or binders (cementitious materials).
In chemical stabilization, soil is stabilized by adding different chemicals. The main advantage of chemical stabilization is that setting time and curing time can be controlled. Chemical stabilization is however generally more expensive than other types of stabilization.
A.SOILS:
Most of stabilization has to be undertaken in soft soils (silty, clayey peat or organic soils) in order to achieve desirable engineering properties. According to Sherwood (1993) fine grained granular materials are the easiest to stabilize due to their large surface area in relation to their particle diameter. A clay soil compared to others has a large surface area due to flat and elongated particle shapes. Peat soils and organic soils are rich in water content of up to about 2000%, high porosity and high organic content. The consistency of peat soil can vary from muddy to fibrous, and in most cases, the deposit is shallow, but in worst cases, it can extend to several meters below the surface.
Organic soils have high exchange capacity; it can hinder the hydration process by retaining the calcium ions liberated during the hydration of calcium silicate and calcium aluminate in the cement to satisfy the exchange capacity. In such soils, successful stabilization has to depend on the proper selection of binder and amount of binder added.
Objectives
General Objective
• To determine potential use of molasses as
expansive soil stabilizer and identify
economical mixing proportion of the
molasses with expansive soil. Specific Objectives
• To reduce the swelling potential of the soil
after stabilization
• To improve the strength and compaction
Available online: https://edupediapublications.org/journals/index.php/IJR/ P a g e | 906
• To characterize and determine Atterberg
limits and indices, free swell, California Bearing Ratio, Compaction property (MDD and OMC), swelling pressure of the soil after stabilization.
II. MATERIAL DESCRIPTION AND LABORATORY METHODS
TESTS RESULTS WITHOUT MOLASSES Materials:
A. Expansive Soil
The Expansive soil sample used for this research work is collected from sultanpur, sangareddy, from one test pit. The soil is grayish black in color highly plastic clay. Disturbed and undisturbed sample were collected from the test pit at a depth of 3m. Soil sampling from the test pit.
Figure 1: soil sampling collected from the test pit
B. Molasses
Molasses was obtained from Metehara sugar factory which is found in Telangana State at 7 Km distance from sultanpur. Samples were taken from the containers of black strap molasses connected to the direct production pipe line which leads to the ethanol plant. To avoid spoil and contamination due atmospheric air and water, the cover of the plastic containers is tightly closed and placed under cool shelter.
Mixing of Soil and Stabilizers: I) Percentage Rates
Percentage rates can be specified in many different ways. Traditionally used powder stabilizers are proportioned by weight, commercially available
liquid stabilizers are proportioned by volume and some are specified by the manufacturer as DMR and AMR (Alan, Jacqueline, Lynn, & Howard) Dilution mass ratio (DMR) is the mass ratio of concentrated chemical product to water, used to express the product dilution in water prior to soil application. Application mass ratio (AMR) is the mass ratio of concentrated chemical product to oven-dry material in the treated soil.
The most common way to define the percentage rate is based on the dry weight of soil to be treated. For the stabilizers used in this research dosage rates are given as a percentage of the dry weight of the untreated soil. Accordingly, the amount of stabilizer to be used was calculated as follows
MST= PST x WS ( −I )
Where; MST =mass of stabilizer required in gm PST =percentage of stabilizers required WS =mass of air-dry soil in gm
IMC=Initial moisture Content of the soil in fraction
II) Mixing Procedures
After the necessary soil samples are prepared passing the corresponding sieve No then the molasses to be add is prepared. The molasses is very thick and viscous, calculated amount of molasses based on the dry weight of soil was diluted with measured amount of water. Then the solution is added to the pre-determined amount of soil. Samples were thoroughly hand mixed before further steps.
Figure 2: Water dilution of the molasses
Available online: https://edupediapublications.org/journals/index.php/IJR/ P a g e | 907 Molasses treated samples were covered in plastic
bags to avoid moisture loss and cured in room temperature to maintain uniform condition. Atter berg limit and free swell samples were covered in plastic and placed in desiccators for 7 and 14 days curing period. Samples for all other testes are properly sealed in plastic bags and left for 7-days for curing.
Standard Laboratory Tests i) Grain size analysis
The grain-size analysis is carried out to determine the relative proportions of different grain sizes which makes up a given soil mass. The mechanical or sieve analysis is performed to determine the distribution of the coarser, larger-sized particles larger than 75 μm (retained on the No.200 sieve). Sedimentation process using hydrometer analysis method is carried out to determine the distribution of the finer particle size smaller than 75 μ m (usually silt and clay). After complete grain size analysis of both, the relative proportion of different size groups in each soil sample can be determined. The ranges of size especially the proportion of clay faction is very important in case of expansive soils. The test was conducted according to AASHTO T-11 96(2000).
Sand 0.075-2mm as per AASHTO and 0.075-4.75mm as per USCS Silt 0.002-0.075mm as per both AASHTO and USCS Clay < 0.002 mm as per both AASHTO and USCS
After molasses is add to the soil and thoroughly mixed, aggregated /agglomerated soil particles are visually observed. Washing as well as pulverization process will damage the bonding that might be developed by the soil-molasses mix. Hence the grain size analysis with additives was not tested as the washing as well as pulverization process will damage the bonding that might be developed in the soil-molasses mix.
ii) Initial Moisture Content of the Soil
This test was conducted according to. The oven-drying method was used to determine the moisture
contents of the disturbed and undisturbed soil samples. Small representative natural soil specimens obtained from large bulk samples from the site are placed in plastic bags. The samples were then weighed as received and placed in moisture can, oven-dried at 105°C for 24 hours. Final dry weight is determent and the difference in weight was assumed to be the weight of the water driven off during drying, the difference in weight was divided by the weight of the dry soil, recorded as the initial moisture content for the disturbed natural soil as 58%. Since undisturbed soils are obtained from the side pit, the moisture content is also determent with the same procedure and recorded a natural moisture content of the soil as 60%.
iii) Atterberg Limits Testing
The test is a consistency Limit identification test on the basis of moisture content. It includes the determination of; the liquid limits, plastic limits and the plasticity index for the natural soil and the soil-molasses mixtures. The tests are conducted for uncured, 7 and 14 days cured stabilized soil samples in accordance testing procedures.
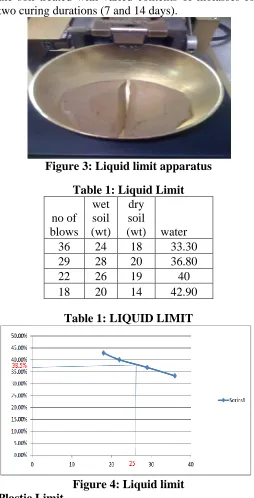
Liquid Limit
Available online: https://edupediapublications.org/journals/index.php/IJR/ P a g e | 908 number of blows is then plotted on a semi–
logarithmic graph. The liquid limit is determined as the moisture content corresponding to 25 blows from the graph. The same procedure is also carried out for the soil treated with varied contents of molasses for two curing durations (7 and 14 days).
Figure 3: Liquid limit apparatus
Table 1: Liquid Limit
no of blows
wet soil (wt)
dry soil
(wt) water
36 24 18 33.30
29 28 20 36.80
22 26 19 40
18 20 14 42.90
Table 1: LIQUID LIMIT
Figure 4: Liquid limit Plastic Limit
The plastic limit is the moisture content that defines where the soil changes from a semi-solid to a plastic (flexible) state. It is the water content, in percent, at
which a soil can no longer be deformed by rolling into 3.2 mm (1/8 in.) diameter threads without crumbling. A portion of the natural soil used for the liquid limit test is retained for the determination of plastic limit. The ball of soil sample is molded between the fingers and rolled between the palms of the hand until it dried adequately. The sample is then approximately divided into two equal parts. Each of the parts is rolled into a thread between the first finger and the thumb. The thread is then rolled between the tip of the fingers of one hand and the glass until the diameter of the thread is reduced to about 3mm and crumbled. The crumbled sample is put in container and the moisture content is determined. The same procedure is also followed for the molasses treated soil samples with and without curing periods.
Figure 5: 1) Plastic limit apparatus 2) glass plate
Wet weight = 26 gms , Dry weight = 22 gms
Final plastic limit value = 19.04% Plasticity Index
The plasticity index of the natural soil and the soil– Molasses mixture is the difference between the liquid limits and their corresponding plastic limits. The plasticity indexes of the samples are calculated as:
Available online: https://edupediapublications.org/journals/index.php/IJR/ P a g e | 909 Figure 6: sample curing, Atterberg limit testing
Plasticity of index=liquid limit-plastic limit =38.5-19.04 =19.46
Plasticity index of A line =0.73(liquid limit-20)
=0.73(38.5-20) =13.05 (Ip of A)<(Ip)
Hence it is intermediate compressible clayey soil.
Shrinkage limit
Shrinkage limit is the maximum water content at which a reduction in water content will not cause decrease in the volume of the soil mass. The samples are first air dried and placed in oven for complete drying. On further drying the water begins to withdraw from the interior of the soil, whose color then changes from dark to light. The surface of the desiccating soil shows a characteristics pattern of shrinkage crack. The finer the particle of the soil, the greater is the amount of shrinkage.
Shrinkage limit value = 10.74%
Compaction
This test includes the determination of the maximum dry density and the optimum moisture content in
accordance with AASHTO T99-94 testing
procedures. The test is conducted for both the natural and soil-Molasses mixture. By varying the moisture content for each trial, air dried fresh soil sample of about 2.0 kg are used. Every sample is then compacted into the 944 cubic centimeters of mass; in three layers of approximately equal mass with each layer receiving 25 blows. The blows are uniformly distributed over the surface of each layer. The collar is then removed and the compacted sample leveled
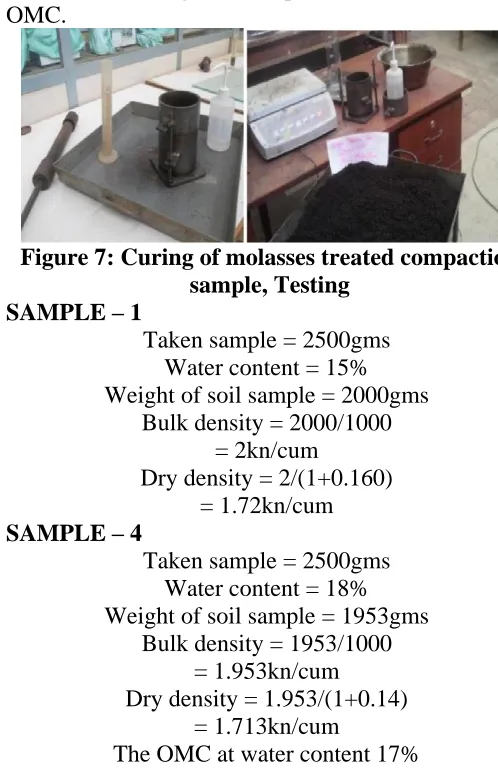
off at the top of the mould with a straight edge. The mould containing the leveled sample is then weighed to the nearest 1g. One small representative sample is then taken from the middle of compacted soil for the determination of moisture content. The same procedure is repeated until minimum of five sets of samples are taken for moisture content determination. The bulk and dry densities are then calculated for each compacted specimen. The values of the dry densities are plotted against their respective moisture contents; MDD is deduced as the maximum point on the resulting curves. The corresponding value of moisture contents at maximum dry densities, which is deduced from the graph of dry density against moisture content, gives the optimum moisture content OMC.
Figure 7: Curing of molasses treated compaction sample, Testing
SAMPLE – 1
Taken sample = 2500gms Water content = 15% Weight of soil sample = 2000gms
Bulk density = 2000/1000 = 2kn/cum
Dry density = 2/(1+0.160) = 1.72kn/cum SAMPLE – 4
Taken sample = 2500gms Water content = 18% Weight of soil sample = 1953gms
Bulk density = 1953/1000 = 1.953kn/cum Dry density = 1.953/(1+0.14)
= 1.713kn/cum
Available online: https://edupediapublications.org/journals/index.php/IJR/ P a g e | 910 The maximum percentage of dry density is
1.713kn/cum
Unconfined Compression Test
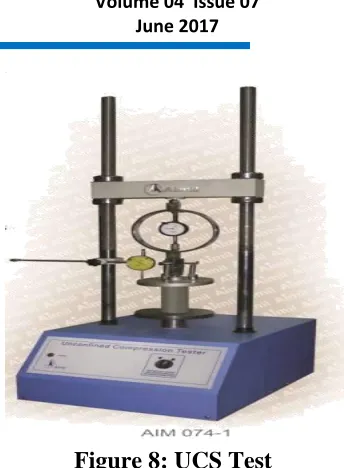
The Unconfined Compression Test determines approximate undrained shear strengths due to the slightly relaxed in situ pressures of the sample. This test is a fast and economical means of approximating the shear strength at shallow depths. A cylindrical soil sample diameter 38mm and height of which is 76mm without any confining pressure, is subjected to an axial compressive load until failure occur.
Tests are performed for the natural as well as molasses treated soils. Remolded samples were prepared after the required quantity of soil is determent from previously calculated values of the bulk density and moisture content of the Proctor Tests. Equation to determine the unconfined compressive strength is given as follows:
P= Qu
A
Qu = unconfined compressive strength (kPa) P = Compressive force (kN)
A = cross section area (m2)
Typical values for cohesive soils of the specified soil types are cited beyond presented here in under. Very soft: <0.25kg/cm2 (24kPa)
Soft: 0.25kg/cm2 to 0.5 kg/cm2 (24-50kPa) Medium: 0.5kg/cm2 to 1.0 kg/cm2 (50-98kPa) Stiff: 1.0kg/cm2 to 2.0 kg/cm2 (98-196kPa)= Very Stiff: 2.0kg/cm2 to 4.0 kg/cm2 (196-392kPa) Extremely stiff: >4.0kg/cm2 (329kPa)
The changed average cross-sectional area at a particular deformation during the test was calculated using the following equation
A = Ao / 1−ε
Where; A = corrected cross sectional area (m2)
Ao= original cross-sectional area (m2) ε = axial strain (mm/mm), ε = ΔL/L The shear strength is defined as half the compressive strength:
c= qu/2
The total quantity of each needed to prepare the required number of test specimens at each prescribed stabilizer percentage of maximum dry unit weight and water content is specified in the Appendices.
Figure 8: UCS Test
California Bearing Ratio (CBR) Test
Available online: https://edupediapublications.org/journals/index.php/IJR/ P a g e | 911 of the dial indicator is taken hence the swell
percentage of the initial sample is given by: soaking the sample. At the end of 96 hours the final dial reading of the dial indicator is taken hence the swell percentage of the initial sample is given by:
Figure 9: CBR Test CBR TEST VALUES:
Taken sample = 5000gms Water content = 17% (omc)
Number of blows = 56 blows for each layer Number of layers = 5
Standard CBR value at 2.5 mm = 1370kn/sqm CBR @ 2.5mm = 70.84/1370 *100
= 5.17%
Standard CBR value at 5mm = 2055kn/sqm CBR @ 5mm = 93.94/2055 *100
= 4.571 CBR test under soaking condition:
Taken sample = 5000gms Water content = 17% (OMC) Number of blows 56 blows per each layer. After compaction, the mould is placed for soaking in
water bath for 4days
After 4days take the sample for CBR test, CBR @ 2.5mm = 0.4
Free Swell Index Test
Some soils, particularly those clays containing Montmorillonite, tend to increase their volume when their moisture content increases. The free swell test is one of the most frequently used simple tests to estimate the swelling Potential of expansive clay. It is
beneficial to carry out this test before further laboratory tests are conducted. Free swell test may be considered as a measurement of volume change in clay upon saturation. This test includes the determination of the free swell index of the natural soil and molasses treated samples in accordance with IS: 2720 (Part 40) 1977 testing procedure.
The test is performed by pouring, 10cc of oven dry soil passing a sieve size of 0.425mm (No. 40), into a 100cc graduated jar filled with water. Samples are left undisturbed for 24 hours. Then the swelled Volume of the soil after the material settles (24hr) is measured. Soils having a free swell value greater than 100% are expansive soils.
Free swell index is computed using Equation shown below. The same procedure was followed for the treated cured and uncured soil samples with increment of Molasses content.
FS= ((Vf-Vo)/Vo) x 100% Where, FS= free swell, %
Vf= soil volume after swelling, cm3 Vo=volume of dry soil, 10cm3
Figure 10: (i) oven dried sample before test (ii) samples after final swelling
Taken soil sample = 10 ml Water content= 100 ml
Swelling % =Vf-Vi/Vi = hf-hi/hi=(16-10/10)*100
= 60%
Where,
Vf = finial volume of soil sample Vi = initial volume of soil sample
hf = finial height hi = initial height
III. TEST RESULTS AND DISCUSSIONS
Available online: https://edupediapublications.org/journals/index.php/IJR/ P a g e | 912 both for natural and treated/stabilized soil samples
separately. The tests include Consistency test :- Atterberg limits (uncured, 7-days cured , 14 days cured The test results of Atterberg limit for the 7 and 14 days cured samples did not show major variations. Hence, only 7 days of curing for other tests is adopted .i.e, , free swell (uncured, 7-days cured) , moisture density relationship /compaction test , the strength tests :-unconfined compressive strength UCS test ( uncured, 7-days cured ) and California bearing ratio (CBR) , 7- days cured for both Soaked and un-soaked soil samples . In addition, using one dimensional Odometer, swell consolidation test is run on the 7-days cured samples and the natural soil.
Natural Soil
The results of the tests conducted for identification and/or determination of properties of the natural soil pre-Molasses applications are presented in Table 5.1. The soil is grayish black in color. As shown in Figure 5.1 in the particle size distribution curve almost 96.6% of the soil is passing through No. 200 sieve; it exhibits a liquid limit of 108%, a plastic limit of 35% and plasticity index of 73 %. According to Daksan and Rama (1973) Liquid limit less than 35% is low ,
between 35% and 50% medium, between 50% and
70% high and greater than 70% veryhigh . Therefore,
the value for the soil under consideration is 108%,
which is very high. Based on the USCS soil
classification system the soil is CH (high plastic clay) .According to AASHTO the soil falls under the A-7-5 soil class. Soils under this class are generally classified as a material of poor engineering property to be used as a sub-grade material. Results that are related to swelling characteristics of the soil also indicate that the soil is highly expansive clay with a free swell of about 150%. The soil has a maximum dry density of 1.24g/cm3, optimum moisture content of 35.4%. The UCS value for the remolded sample is 142 (kPa) un-soaked CBR value of 17.5% and soaked CBR value of 0.77%.
Figure 11: Particle size Distribution curve of the natural expansive soil
Characteristics of Molasses used
The quality of Molasses/Black strap is tested in the quality control lab of Methara sugar factory before it is feed in to Ethanol plant. Samples are taken at certain time interval and average values of the 24hr samples result is reported daily. According to the reported values of the molasses sampled for this research (Brix=92 ,Pol= 34.5 , Purity=37.5).This parameters are indicative of the sucrose content and set limitations for sugar contents that should not be passed to the ethanol plant . Chemical and physical tests were conducted in to characterize the stabilizer and to identify constituent elements as it is presented in Table 4.2 below. The CaO which is valuable oxide for stabilization is in higher presence than other Oxides this is probably due to the addition of lime to obtain white crystallized Sugar during milling stage of sugar processing. Also as pointed out by (Teshale, 2012), the scale formed in the distillation column of ethanol plant is 63.87% composed of CaO. To assess cause of this scaling, the raw molasses has been characterized for their composition and pH. The result shows that the molasses of Metahara sugar factory is with an average of 2.41% CaO which is abnormally high when compared to world average of 1.5% CaO % molasses. (Teshale, 2012). Other compositions are also cited in the annex part of this document which was done during factory inspection period on feasibility study regarding the production of Ethanol from Molasses.
Table 2: Chemical compositions of final Molasses samples
Available online: https://edupediapublications.org/journals/index.php/IJR/ P a g e | 913 the production line
PH 5.48
EC (ms) 32.3
Ash content (%) 20.6
Ca+2( me/l) 32
Mg+2(me/l) 12
Brix (%) 91.1
Rs (%) 10.13
Effect of Molasses on stabilized soil Effect of Molasses on Atterberg Limits
The effect of molasses on the plasticity index of the soil is shown in Figure 5.3 for un cured, 7-days cured and 14 –day’s cured samples. Generally very slight decrease with increment of molasses content is observed. The variation between cured and uncured samples is insignificant.
Figure 12: Variation of plasticity index with different molasses content
The slight decrease in plasticity indices are probably due to the reduced surface activities i.e. due to flocculation and agglomeration of clay particles caused by cat ion exchange.
Effect of Molasses on Free index
The effect of molasses on the free swell of the expansive soil both for the cured and uncured samples is insignificant. This is because since the molasses is readily dissolved or diluted in water the agglomerated soil-stabilizer mixture is dispersed and leads to increased specific surface area which facilitates swelling. The results for both cured and uncured stabilized samples are nearly 150% which is the averaged value for the natural expansive soil.
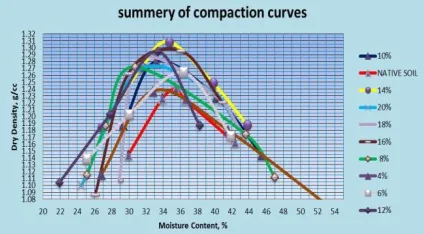
Effect of Molasses on Soil Compaction Properties All molasses treated soil samples compaction curve fail to the dry side of the natural soils compaction curve .This is more pronounced for higher percentages. When molasses is added to the soil aggregation and agglomeration takes place which leads more coarse aggregate formation and reduction in clay colloidal content which reduces the moisture uptake of the mix. The treated soil dry densities are also higher than the natural due to adhesive property of molasses.
Figure 13: Summary of compacted curves
Maximum Dry Densities
Generally, for all percentages of molasses used (from 4% to 20%, at every 2% increment) the dry densities of all compacted samples showed slight increment than for the natural soil dry density. The observed increment is probably due to the fact that:
• As molasses exhibit sticking nature, it adhere
soil particles together this gives rise to density increment.
• Since molasses contains resinous substance
Available online: https://edupediapublications.org/journals/index.php/IJR/ P a g e | 914 Figure 14: Dry density values for varied contents
of molasses Optimum Moisture Content
Generally, for all percentages of molasses used (from 4% to 20%, at every 2% increment) the optimum moisture contents‟ of all compacted samples fall to the dry side of compaction curve of the natural soil. This may be attributed to the aggregation of clay particles to form coarser size as molasses is added to the soil. Especially for higher percentages the difference is significant (3.4% and 2.9% for 18% and 20% molasses contents respectively. It was observed that the 8% molasses contents result in reduced OMC values than other percentages. As Molasses is liquid stabilizer the moisture content of the higher percentages molasses itself is nearly adequate to lubricate soil particles and facilitate water intrusion in the soils pore space resulting in higher OMC values.
Figure 15: Optimum moisture contents varied percentages of molasses.
Effect of Molasses on Unconfined Compressive Strength
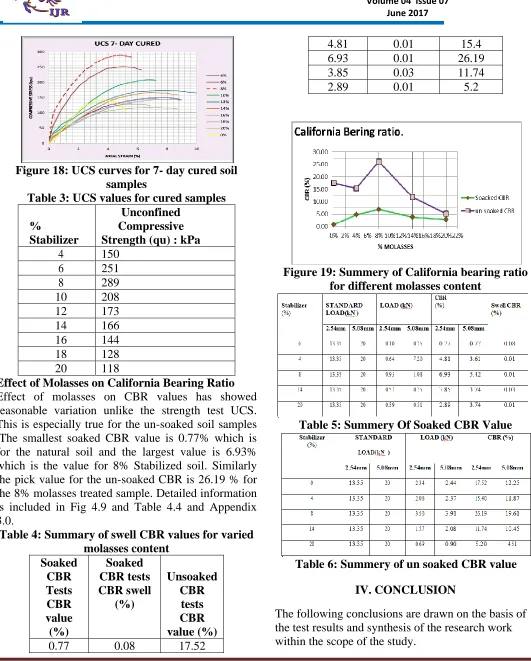
The variation between the UCS values of the cured and uncured soil samples is insignificant. For the uncured samples, it started with 182 kPa for the 4% molasses and increased to its pick value, 245kPa for the 8% molasses then drops to 109kPa for the 20% molasses contents.
For the cured samples, it started with 150 kPa for the 4% molasses and increased to its pick value, 289 kPa for the 8% molasses then drops to 118kPa for the 20% molasses contents. The values are summarized in figure 5.7 below. The soil treated with molasses exhibit ductile mode of failure. This is markedly observed for higher molasses contents, beyond 12%
molasses. The natural soil sample has the lowest strain 3.68% and the treated samples strain value ranges from 5.26% to 8.16% for the un-cured samples and it ranges from 4.87% to 8.16% for the 7-day cured samples. As molasses content increase it tends to coat soil particles and put them apart rather than adhering to each other.
Figure 16: Summarized UCS values for varied percentages of molasses
Figure 17: UCS curves for un-cured soil samples
% Stabili zer
Unconfined Compressive Strength (qu)
: kPa
4 182
6 229
8 245
10 227
12 209
14 193
16 184
18 134
Available online: https://edupediapublications.org/journals/index.php/IJR/ P a g e | 915 Figure 18: UCS curves for 7- day cured soil
samples
Table 3: UCS values for cured samples
%
Stabilizer
Unconfined Compressive Strength (qu) : kPa
4 150
6 251
8 289
10 208
12 173
14 166
16 144
18 128
20 118
Effect of Molasses on California Bearing Ratio Effect of molasses on CBR values has showed reasonable variation unlike the strength test UCS. This is especially true for the un-soaked soil samples .The smallest soaked CBR value is 0.77% which is for the natural soil and the largest value is 6.93% which is the value for 8% Stabilized soil. Similarly the pick value for the un-soaked CBR is 26.19 % for the 8% molasses treated sample. Detailed information is included in Fig 4.9 and Table 4.4 and Appendix 3.0.
Table 4: Summary of swell CBR values for varied molasses content
Soaked CBR Tests CBR value (%)
Soaked CBR tests CBR swell
(%)
Unsoaked CBR
tests CBR value (%)
0.77 0.08 17.52
4.81 0.01 15.4
6.93 0.01 26.19
3.85 0.03 11.74
2.89 0.01 5.2
Figure 19: Summery of California bearing ratio for different molasses content
Table 5: Summery Of Soaked CBR Value
Table 6: Summery of un soaked CBR value
IV. CONCLUSION
Available online: https://edupediapublications.org/journals/index.php/IJR/ P a g e | 916
• As it can be deduced from the geotechnical test
results of the natural soil, the engineering properties of the expansive clay soil under study are not suitable to be used as a sub-grade and/or embankment fill material unless its undesirable properties are improved.
• The inorganic elements especially the CaO which
is present in the sugar cane molasses used for the study is active in causing a chemical reaction involving cat ion exchange with the expansive clay soil during stabilization.
• Addition of molasses changes the slightly alkaline
soil to slightly acidic as could be observed from the PH results.
• The CEC values are reduced up on addition of
molasses to soil. This is also true for LL value as there is direct relation b/n CEC and the soil LL.
• In soils treated with molasses, 8% by dry weight
of the soil was found to be optimum stabilizer content. The pick values for strength tests: UCS, CBR are at this percentage. The minimum values or the decrease in swelling potentials and swelling pressures is also obtained for soils mixtures prepared at 12% molasses by dry weight of the soil.
• Results obtained from the strength tests; UCS and
CBR of molasses treated samples vary because: for the UCS tests, molasses treated soils are cured in plastic bag for 7-dayes in loosen state and then compacted before subsequent tests. During compaction the molasses soil aggregation and agglomeration is disturbed and reduced the strength result. This is also the reason for UCS test results not showing much variation for the cured and uncured samples. But for the CBR testes, after soil is mixed with molasses it is immediately compacted in CBR mold, covered in plastic bag and left for 7-dayes in compacted state
before testing. Since the molasses –soil
aggregation is not disturbed higher strength results were obtained.
• The above incident shows that the usual
laboratory test procedures that disturbed molasses – soil aggregation could not directly be applied to
molasses treated soils if best result is to be obtained. Hence more refined test procedures should be devised.
• Generally curing has low effect on engineering
properties of the stabilized soil.
• The plasticity index is slightly reduced with
increase in Molasses content but increased beyond 14% molasses.
• The optimum moisture content reduced and the
maximum dry densities values increased with increment of molasses content.
• Molasses readily dilute in water, this simplifies
application of the stabilizer during constriction. But, since it is easily washed by water, soil particles that were flocculated and agglomerated due to an adhesive property of molasses got
disintegrated. Since agglomerated /coarser
particles which reduced the colloidal content of the soil are reduced to finer particle, losses in strength came to effect.
• From the above scenario, Molasses could be used
as standalone soil stabilizer, provided the necessary protection form water intrusion is made. For example it could be used to improve poor expansive sub grade .underlying sub-base with properly shield shoulders.
REFERENCES
1. Alan, R., Jacqueline, H., Lynn, K., & Howard, L.
Measured Effects of Liquid Soil Stabilizers on Engineering Properties of Clay. Austin,: Harmon, Golder Associates,.
2. Bowles, J. (1992). Engineering properties of soil
and their measurements. Mc Graw-Hill. Chen, F. h. (1975). Foundations on expansive soils. New York: Elsever scintific publishing. Danel, N. (2002). Stabilization of Potentially Expansive Sub grade Soil Using Lime and Con-Aid. Msc Thesis.
3. E., R., Animesh, S., A.T, M., G., K., & A.Abdul,
Available online: https://edupediapublications.org/journals/index.php/IJR/ P a g e | 917
4. E., S., Z.Bubnika, & A., H. (2012). Molasses as a
by-product of sugar crystallization and a perspective raw material. Procedia Engineering, 1219 – 1228.
5. Ehitabezahu, N. (2011). Evaluation of Sodium
silicate and its combination with cement/lime. Msc. thesis.
6. Gresham, E., Lamanto, S., & S., C. (2014).
Enzyme Stabilization of High Liquid Limit Clay.
7. Electronic Journal of Geotechnical Engineering
(EJGE). , vol 19, 6989-6994.
8. H.B, S., R.G, W., & R., L. (1962). Prediction of
Swelling Potential for compacted clays.
Proceedings: Journal of Soil Mechanics and Foundation Engineering. 88. American Society of Civil Engineers.
9. Habtamu, S. (2011). Chemical Stabilization of
Expansive Sub-grade Soil Performance