Technology and Investment, 2010, 1, 149-153
doi:10.4236/ti.2010.12018 Published Online May 2010 (http://www.SciRP.org/journal/ti)
An Exploration of the R & D Value beyond the Generally
Accepted Accouting Principles
Yu-Wen Lan
Department of Finance and Banking, Lunghwa University of Science and Technology, Taoyuan, Taiwan, China E-mail: 93441007@cc.ncu.edu.tw
Received October 28, 2009; revised February 1, 2010; accepted February 3, 2010
Abstract
This paper utilized the real R & D option theory especial the Bellalah [1] information cost model as the dis-cussion base for the exploration of R & D value. We extended Bellalah’s model as to add the factors of Poisson event and exponential decay to approximate the reality; we calculated the derivative value of R & D investment and relaxed the Generally Accepted Accounting Principles (GAAP) as to deem the accumulated R & D investment the capital owned by a firm and to evaluate it as well. The empirical results enlightened us: our modified model meet with reality better than the original model; the derivative R & D value have ex-planatory power to the equity behavior especial the risk magnitude proxied by β and lastly, to entirely ex-pense the R & D investment could be problematic since R & D investment own the property of capital.
Keywords:Real R & D Option, Poisson Event, Exponential Decay, GAAP
1. Introduction
Merton asserted the importance of information cost and documented that an investor shall demand higher stock return if higher information cost is expensed [2]. Fol-lowing the context of Merton, Bellalah [1,3] incorporated the information cost factor in valuing both options and R & D. However, in Bellalah’s setting only the factors in-fluencing R & D’s market value were considered. The truth is that R & D value will depreciate while time elapses; its value could also be vanished overnight be-cause of any unexpected evolution. These facts imply some other exogenous factors which influence the R & D’s payoff deserve to be comprehended. This study at-tempts to modify Bellalah’s ROM as to incorporate
fac-tors like exponential decay () and Poisson event ()
into consideration.
There are three types of information cost defined
in-cluding the average cost prevailed in market (M), the
cost affiliated with R & D options (F) and the cost
af-filiated with R&D yield’s price (P). The disposal in
Bellalah [1,3] may have caused two issues: first, the in-dividual effect of information costs was unknown and,
secondly, the reason of why the M, F and P were
set to be 4% for example was unknown. For the level of information cost, Bellalah stressed the hardness in
defin-ing it and proposed an alternative as to find proxies from derivates markets; though this idea was not taken even-tually. We are going to observe the individual effect of information costs; we are also going to actualize Bella-lah’s proposal to see what the real level of information cost could be.
2. Re-Modeling
The factors of exponential decay and Poisson event
are going to be considered. means the required
rate of return which is the sum of expected capital gain
and dividend . While exponential decay and
Poisson event are jointly considered, the project value can be:
( ) 0
( )
0 0
( ) (1 ) / ( )
/ ( )
/ ( )
T T
T T
V P e P e dT
P e dT e
P
dT
(1)Through (1), a spiky event like and can be
smoothened as an additional discount factor in the de-nominator.
According to ROM, an R & D project value V can be
therefore V(P) = I + F(P). We may utilize a portfolio
( )
F P nP
n
as to long one unit of option and to
short units output with price P and let its payoff be:
r F nP dt dF ndP n Pdt (2) From (2) we can derive a corresponding Bellman equation:
2 2
(1 2) P FPP (r )PFPrF0 (3)
In (3), we set to eliminate the disturbance
term . (3) is a Partial Differential Equation (PDE)
and we can solve F by either analytical, if it has a close
form solution, or numerical way. When the exponential decay, Poisson event and information cost are jointly considered, the Bellman equation becomes:
'( )
n F P
dz
2 2
(1 / 2) ( )
( ) ((1 ) )
PP P P
F 0
F P r F P
r F F P
(4)
F solved from (4) is the value of a simple option and we
denote it F1 in latter expressions.
We further consider a complex situation as to let the option compound with succeeding replacement options.
P* means a threshold which is optimal to exercise the R
& D project. When , the value of the compound
option over next interval is:
* P P
'
( ) ( )
(1 ) ( )
'( )
F
F
r dt r dt
F Pdt dt e E F P dP dte E F P dP
(5)
This means an installed investment could either
sur-vive with probability(1dt)or die with probability
dt
in next short interval. when , (5) can be
expanded as:
* P P
2 2
' 2 2
(1 )(1 ( ) )
( ) (1 / 2)
((1 ) ) (1 ( ) )
' ' ( ) (1 / 2) '
' '((1 ) )
F
P P PP
F
P P PP
F Pdt dt r dt
F F Pdt F P dt
Fdt F P dt dt r dt
F F dt F P dt
F dt F P dt
when P P *, (5) can be expanded as:
( ) ( ) 2 2 2 2(1 ) ( )
( )
(1 )(1 ( ) )
( ) (1/ 2)
((1 ) ) (1 ( ) )
( ) (1/ 2)
((1 ) )
r dt r dt
F
P P PP
F
P P PP
F
F
F Pdt dt e E F P dP dte E F P dP I
Pdt dt r dt
F F Pdt F P dt
Fdt F P dt dt r dt
F F dt F P dt
Fdt F P dt I
The respective Bellman equation becomes:
2 2
(1 / 2) ( )
( ) '
PP P P
F 0
F P r F P
r F F P
(6)
0 ) ( ) ( ) 2 / 1
( 2 2
P I F r P F r P F F P P PP (7)
Be noted that (6) and (7) will meet tangentially on P*.
F solved from (6) and (7) is the value of a compound
option and we denote it F2 in latter expressions.
3. Simulations
To illustrate the F1 and F2, we shall exploit an industrial
case as the background to keep the simulations ‘virtual’. The ‘Local Area Network’ (LAN) industry in Taiwan was selected due to its high R & D orientation. The LAN industry in Taiwan is eye-catching referring to its annual global share 76.5%, 53%, 90.9% and 84% on NIC, Hub / Switch, SOHO router and WLAN (wireless LAN). We focused on the listed LAN companies and collect their financial and stock parameters from both Taiwan Eco-nomic Journal (TEJ) and the website of Taiwan Stock Exchange Corporation (TSEC). Sample period is from
January 1st, 1999 to March 31st, 2006.
We set the parameters , r, to equal the
prac-tical level and let , F and P innovate in
follow-ing simulations.
Figures 1 and 2 demonstrate the F1 and F2 value plane
under influence of F and . Figures 3 and 4
demon-strate an additional influence caused by P. In Figure 1,
the back (right) plane exhibits F1 which moves with
in-formation cost F while keeping fixed; the front
(left) plane exhibits F1 which moves with information
cost F and Poisson event simultaneously. As
shown, the plane will mainly incline toward axis if
0. 030 0. 042 0. 054 0. 066 0. 000 0. 012 0.
02
4
0.
0
36 0.004 0.
01
6
0.
028 0.04
0 0 10,000 20,000 30,000 40,000 50,000 60,000 F(P) Poisson
event information cost
F(P)
information cost Poisson
[image:2.595.318.537.542.705.2]event
Y. W. LAN 151 0. 030 0. 0 42 0. 05 4 0. 066 0. 0
00 0.012 0.
02
4
0.
036 0.004 0.
0
16
0
.028 0.040 0 5,000 10,000 15,000 20,000 25,000 30,000 35,000 40,000 45,000 F(P) Poisson
event information cost
F(P)
information cost Poisson
[image:3.595.61.284.63.446.2]event 0.030
Figure 2. Value plane of F2.
0. 030 0. 0 42 0. 054 0. 066 0.
000 0.01
2
0
.02
4
0.
036 0.004 0. 016 0.02
8 0. 040 0 10,000 20,000 30,000 40,000 50,000 60,000 70,000 80,000 90,000 F(P) Poisson
event information cost
F(P)
information cost Poisson
event 0.030
Figure 3. Value plane of F1 (P moves from 0 to 4%).
is considered. This expounds that is a more
in-fluential factor; the scenario of Figure 2 is similar also.
In Figures 3 and 4, we let the P innovate with F,
which makes the plane toward information cost axis be-coming a positive slope. The result implies that the
ap-preciation of P will raise the option value and partly
cancel the influence of F. The value depreciation
caused by can somehow be alleviated by the raise of
P
but not much; is still the major strength to
do-main the plane. Situations are similar if let the join
0. 030 0. 04 2 0. 054 0. 066 0. 00 0 0.
012 0.024 0.
03 6 0. 00 4 0.
016 0.02
8 0. 040 0 10,000 20,000 30,000 40,000 50,000 60,000 70,000 F(P) Poisson
event information cost
F(P)
information cost Poisson
[image:3.595.313.534.76.244.2]event 0.030
Figure 4. Value plane of F2 (P moves from 0 to 4%).
except the influence of is minor than . The
simu-lations elucidate two things: first, the incorporation of exogenous factors which influence to R & D’s payoff should be important since the new factors outweighs the
information cost and, secondly, spending P will
im-prove the stochastic control on price thus a positive rela-tionship with option value was observed.
4. An Exploration to the Level of
Information Cost
Bellalah stressed that the magnitude of information cost is hard to define and proposed an alternative as to collect proxies from derivates markets [3]. We are going to ac-tualize Bellalah’s idea to find these proxies. The plausi-bility of proxies will be tested by the regression analysis:
0 1 2 3
4 5 ,
1
( / )
it it it it
it k j i t k it
k
Finan DE LQ
ROE V S u
(8)
i denotes the sample companies, j1, 2, Vj I Fj, t
denotes time. means the beta coefficient belonging
to CAPMi which represents the risk level. Since the higher R&D investment will incur a higher company’s
risk [4,5], we take as a dependent variable to be
re-gressed and a positive coefficient of is expected.
The financial leverage (Finan), debt-equity ratio (DE), liquidity (LQ) and profitability (ROE) are comprehended
as control variables. We let V be divided by
contempo-raneous sales to eliminate the idiosyncratic scale effect. (8) implies that
/
j
V S
is a function of multi-period R&D
value. Be noted the multicollinearity could happen on therefore a polynomial distributed lags (PDL)
technique is exploited.1
/
j V S
1We set 3
, 3 2 2 1 0 ,
5khhkhk hk
( ) ( 3)
3 2 2 0 1 0 0 , ,
5 I h hk hk hk k
k k itk
k t i I
( ), h0W0th1W1th2W2th3W3t, , ,
0 ,
0 ( )
k itk
t I W 0 ,
1 ( )
k itk
t k I
W 0 , 2
2 ( )
k itk
t k I
W , and . The degree is set to be three
since the significance level of remarka 0 , 3
3 ( )
k itk
t k I
W
[image:3.595.63.285.81.245.2]5. Conclusions
Before collecting the proxies of information costs, we need to clarify two issues including what the adequate proxy should be and how the proxy can be collected. For the first issue, we followed Amihud and Mendelson [6] who asserted that the bid-ask spread an adequate proxy of information cost; for the second issue, we followed the Chicago Board Options Exchange (CBOE)
disci-plines in estimating the volatility index (VIX).2 M,
F
and P can be estimated by Taiwan weighted
stock index (TAIEX), stock options and common stocks. Anyway, we utilized the data from Taiwan stock index
options (TXO) for M and Taiwan electronics options
(TEO) for F since there’s no TAIEX transactions and
no individual stock options offered by sample companies. The proxies collected from markets are deemed the real level of information cost.
The Bellalah’s [1,3] model can though depict the change of R & D’s market value due to the spillover effect of information collecting, it cannot figure the change of R & D’s payoff due to the competitor’s activity. This makes Bellalah’s model deviating to the reality. We made extension to Bellalah’s models as to incorporate
exogenous factors including exponential decay and
Poisson event for compensation on aforesaid
defi-ciency.
The influence of information cost onto R & D value is
roughly half to exponential decay and one third to
Poisson event , which tells the new added factors
outweighs the information cost as well as support our modeling extension. Bellalah [1,3] did not observe the information cost individually but a lump-sum effect in-stead; we made an individual survey and found that the
information cost affiliated with price P moves
con-versely from the others. This finding implies that the cost in pursuing a more adequate price will boost the R & D
[image:4.595.57.542.460.552.2]value, vice versa.
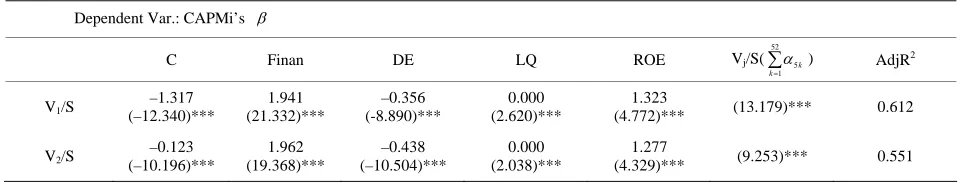
Table 1 shows the situation while M F P 0. On Table 2 we start to consider the non-zero situation and let the cost be either Bellalah’s [3] or real level. The
AdjR2 slightly changed between Tables 1 and 2 while
letting the cost be the Bellalah’s level. The change be-comes remarkable if let the cost be the “real”. Be noticed
that the averaged M, F and P are 2.14%, 23.24%
and 0.23%; which is much different with Bellalah’s set-ting.
Bellalah [3] commented that the information cost is hard to define and, therefore, suggested to find proxies from the derivates markets. However, such an idea was not taken eventually but only artificial numbers instead in Bellalah’s simulations. We actualized Bellalah’s idea and propose a working frame as to exploit the ways of
Table 1. The explanatory power of different R & D value approaches.
Dependent Var.: CAPMi’s
C Finan DE LQ ROE Vj/S( )
52
1 5
k k
AdjR2
V1/S –1.317
(–12.340)***
1.941 (21.332)***
–0.356 (-8.890)***
0.000 (2.620)***
1.323
(4.772)*** (13.179)*** 0.612
V2/S –0.123
(–10.196)***
1.962 (19.368)***
–0.438 (–10.504)***
0.000 (2.038)***
1.277
(4.329)*** (9.253)*** 0.551
[image:4.595.58.536.600.682.2]p < 0.1*, p < 0.05**, p < 0.01***
Table 2. The explanatory power influenced by information cost.
% 5
F P
M
real M , F and P
52
1 5
k k
AdjR2
52
1 5
k k AdjR
2
V1/S (13.547)*** 0.618 (7.798)*** 0.859
V2/S (8.782)*** 0.545 (7.571)*** 0.859
< 0.1*, p < 0.05**, p < 0.01***
p
2CBOE demands the contract series of “near-the-money”, “nearby” and “second-nearby” being applied for VIX estimation. For the contracts with
Y. W. LAN 153
volatility indices estimation. The average level of the
proxies of M, F and P are 2.14%, 23.24% and
0.23%. The new level is much different than the conven-tional knowledge and seems more plausible since it
brings better predictability on , this helps investors
be-ing more prudent because he knows better the risk level what have borne by portfolio.
5
. References
[1] M. Bellalah, “Valuation of Futures and Commodity Op-tions with Information Costs,” The Journal of Futures
and Markets, Vol. 19, 1999a, pp. 645-664.
[2] R. C. Merton, “A Simple Model of Capital Market Equi-librium with Incomplete Information,” The Journal of
Finance, Vol. 42, No. 3, 1987, pp. 483-510.
[3] M. Bellalah, “On Irreversibility, Sunk Costs and Invest-ment Under Incomplete Information,” In: Paxson, D. A. Ed., Real R & D Options, Butterworth Heinemann, Bur-lington, 2003b.
[4] F. Black and M. Scholes, “The Pricing of Options and Corporate Liabilities,” Journal of Political Econometrics, Vol. 81, No. 3, 1973, pp. 637-654.
[5] Y. K. Ho, Z. Y. Xu and C. M. Yap, “R & D Investment and Systematic Risk,” Accounting and Finance, Vol. 44, No. 3, 2004, pp. 393-418.
[6] Y. Amihud and H. Mendelson, “The Effects of Beta, Bid-Ask Spread, Residual Risk, and Size on Stock Re-turns,” The Journal of Finance, Vol. 44, No. 2, 1989, pp. 478- 486.