Big Data Analytics:
A Classification of Data Quality
Assessment and Improvement Methods
K Deepthi Reddy
&K Sinduja
1assistant Professor,Cse Department,Cvr College Of Engineering,Jntuh. 2assistant Professor,Cse Department,Cvr College Of Engineering,Jntuh.
Abstract:
The categorization of data and information requires
re-evaluation in the age of Big Data in order to
ensure that the appropriate protections are given to
different types of data. The aggregation of large
amounts of data requires an assessment of the harms
and benefits that pertain to large datasets linked
together, rather than simply assessing each datum or
dataset in isolation. Big Data produce new data via
inferences, and this must be recognized in ethical
assessments. We propose a Classification of Data
Quality Assessment and Improvement Methods The
use of schemata such as this will assist
decision-making by providing research ethics committees and
information governance bodies with guidance about
the relative sensitivities of data. This will ensure that
appropriate and proportionate safeguards are
provided for data research subjects and reduce
inconsistency in decision making.
Keywords
Big data analytics; Massive data; Structured data; Unstructured Data; DQ
Introduction
The Big Data technology involves
collecting data from different resources
merge it that is becomes available to deliver
a data product useful for the organization
business. The process of converting large
amount of data i.e unstructured raw data
received from different sources to produce a
data product useful for the organizations
and the users.
Most big data problems can be categorized
in the following ways −
Supervised classification
Supervised regression
Unsupervised learning
Learning to rank
Let us now learn more about these four
concepts.
Supervised Classification
Given a matrix of features X = {x1, x2, ...,
xn} we develop a model M to predict
different classes defined as y = {c1, c2, ...,
cn}. For example: Given transactional data
of customers in an insurance company, it is
possible to develop a model that will
predict if a client would churn or not. The
latter is a binary classification problem,
where there are two classes or target
variables: churn and not churn.
Other problems involve predicting more
than one class, we could be interested in
response vector would be defined as: y =
{0, 1, 2, 3, 4, 5, 6, 7, 8, 9},
a-state-of-the-art model would be convolution neural
network and the matrix of features would
be defined as the pixels of the image.
Supervised Regression
In this case, the problem definition is rather
similar to the previous example; the
difference relies on the response. In a
regression problem, the response y ∈ ℜ,
this means the response is real valued. For
example, we can develop a model to
predict the hourly salary of individuals
given the corpus of their CV.
Unsupervised Learning
Management is often thirsty for new
insights. Segmentation models can provide
this insight in order for the marketing
department to develop products for
different segments. A good approach for
developing a segmentation model, rather
than thinking of algorithms, is to select
features that are relevant to the
segmentation that is desired.
For example, in a telecommunications
company, it is interesting to segment
clients by their cell phone usage. This
would involve disregarding features that
have nothing to do with the segmentation
objective and including only those that do.
In this case, this would be selecting
features as the number of SMS used in a
month, the number of inbound and
outbound minutes, etc.
Learning to Rank
This problem can be considered as a
regression problem, but it has particular
characteristics and deserves a separate
treatment. The problem involves given a
collection of documents we seek to find the
most relevant ordering given a query. In
order to develop a supervised learning
algorithm, it is needed to label how
relevant an ordering is, given a query.
It is relevant to note that in order to
develop a supervised learning algorithm, it
is needed to label the training data. This
means that in order to train a model that
will, for example, recognize digits from an
image, we need to label a significant
amount of examples by hand. There are
web services that can speed up this process
and are commonly used for this task such
as Amazon mechanical tuck. It is proven
that learning algorithms improve their
performance when provided with more
data, so labeling a decent amount of
examples is practically mandatory in
supervised learning.
In large organizations, in order to
needed to have management backing up
the project. This normally involves finding
a way to show the business advantages of
the project. We don’t have a unique
solution to the problem of finding sponsors
for a project, but a few guidelines are given
below −
Check who and where are the
sponsors of other projects similar to
the one that interests you.
Having personal contacts in key
management positions helps, so any
contact can be triggered if the
project is promising.
Who would benefit from your
project? Who would be your client
once the project is on track?
Develop a simple, clear, and exiting
proposal and share it with the key
players in your organization.
The best way to find sponsors for a project
is to understand the problem and what
would be the resulting data product once it
has been implemented. This understanding
will give an edge in convincing the
management of the importance of the big
data project.
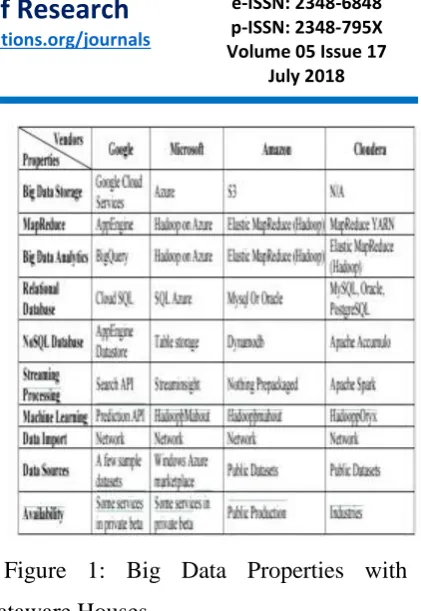
Figure 1: Big Data Properties with
Dataware Houses
Big Data Challenges
Adaptability
The information is developing and is being
created as terra bytes of information. How
would I Store it? Where do I keep the
information? What calculations will be
utilized for handling it? Will any Data
Mining method have the capacity to deal
with such tremendous information? A few
versatile systems are being utilized by
associations, for example, Microsoft. The
exchange of information onto the cloud is a
moderate procedure and we require a
legitimate framework that does it at an
extensive speed particularly when the
information is dynamic in nature and
calculations exist and depend on stack
adjustment and histogram assembles up.
Versatility exists at the three levels in the
cloud stack. At the Platform level there is:
even and vertical versatility.
Security and Access Control: Security is a
viewpoint that emerges as an issue from
inside an association or when an individual
uses a cloud to transfer "its own particular
information". At the point when a Client
transfers a data and pays too for the
service, so who is responsible for access to
the data, permissions to use the data, the
location of the data, its loss, authority to
use the data being stored on clusters, The
right of the cloud service provider to use
the client’s personal data and many others.
One of the major solutions was encrypting
the data.
Privacy and Integrity Issues:
The data being generated might be too
personal for an individual or an
organization. This big data might be
collected from Facebook accounts,
WhatsApp applications each of these being
more personal as compared to other
applications. In addition to this online data,
several data maybe pertaining to health
records purchases etc. these might lead to,
identification issues, profiling, loss of
control, location whereabouts of a person
related to purchases in supermarkets and
many more. Thus anonymization of this
data or its encryption comes as solutions to
this issue. Privacy approaches can be dealt
with user consent over its usage or sharing
on the globe. Several privacy and
protection laws exist for this which is a
part of regulatory framework.
Big Data Difficulties
1. Information Protection:
Information Security is a significant
component that warrants examination.
Undertakings are hesitant to purchase a
confirmation of business information
security from merchants. They fear losing
information to rivalry and the information
privacy of buyers. In many occurrences,
the genuine capacity area isn't unveiled,
including onto the security worries of
endeavors. In the current models, firewalls
crosswise over server farms (claimed by
undertakings) ensure this touchy data. In
the cloud show, Service suppliers are in
charge of keeping up information security
and undertakings would need to depend on
them.
2. Information Recovery and
All business applications have Service
level assertions that are stringently taken
after. Operational groups assume a key part
in administration of administration level
assertions and runtime administration of
uses. Underway conditions, operational
groups bolster proper bunching and Fail
over
Information Replication
Framework observing (Transactions
checking, logs checking and others)
Support (Runtime Governance)
Limit and execution administration
3. Administration Capabilities
Regardless of there being numerous cloud
suppliers, the administration of stage and
foundation is still in its earliest stages.
Highlights like „Auto-scaling‟ for instance,
is urgent prerequisite for some ventures.
There is colossal potential to enhance the
versatility and load adjusting highlights
gave today.
4. Administrative and Compliance
Restrictions
In a portion of the European nations,
Government directions don't permit client's
individual data and other delicate data to be
physically situated outside the state or
nation. Keeping in mind the end goal to
meet such prerequisites, cloud suppliers
need to setup a server farm or a capacity
site solely inside the nation to conform to
directions. Having such a foundation may
not generally be practical and is a major
challenge for cloud suppliers.
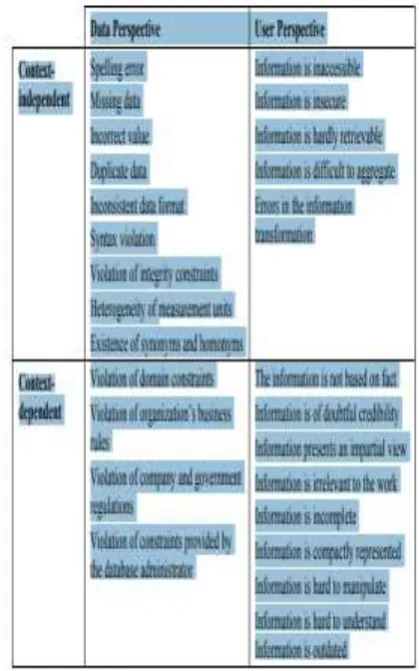
Proposed System: A Classification of Data Quality Assessment and Improvement Methods
Figure 2: Data Quality Problems
DQ Assessment and Improvement
reviewed the existing software tools for
both DQ assessment and improvement and
extracted the different methods provided
within these tools. The landscape of DQ
software tools is regularly reviewed by the
information technology research and
advisory firm Gartner, and we used their
latest review to scope the search for DQ
tools from which to extract DQ methods.
The list of DQ tools reviewed is as follows:
To perform the extraction of methods, we
reviewed the actual tool (for those that were
freely available) and any documentation of
the tool including information on the
organizations’ websites. We also augmented
this review with a general review of DQ
literature that describes DQ methods, and
have cited the relevant works in our
resulting list of DQ methods in the
following section. Once we had reviewed
each tool and extracted the DQ methods, the
methods were validated (for completeness
and validity) by an expert with 10 year’s
practitioner’s experience of current
practices in the data quality industry. The
resulting methods are described in the
following two subsections and have been
split according to whether they are for DQ
assessment or improvement.
DQ Methods for Assessment As noted
before, the aim of DQ assessment is to
inspect data to determine the current level of
DQ and the extent of any DQ deficiencies.
The following DQ methods, obtained from
the review of the DQ tools above, support
this activity and provide an automated
means to detect DQ problems.
Column analysis typically computes the
following information: number of (unique)
values and the number of instances per
value as percentage from the total number
of instances in that column, number of null
values, minimal and maximal value, total
and standard deviation of a value for
numerical columns, median and average
value scores, etc. In addition, column
analysis also computes the inferred type
information.
For example, a column could be declared
as a ‘string’ column in the physical data
model, but the values found would lead to
the inferred data type ‘date’. The frequency
distribution of the values in a column is
weight factors in some probabilistic
matching algorithms. Another metric is
format distribution where only 5 digit
numeric entries are expected for a column
holding German zip codes. Some DQ
profiling tools (for example, Talend
profiler) differentiate between analyses that
are applicable to a single column compared
to a “column set”.
Column set analysis refers to how values
from multiple columns can be compared
against one another. For this research, we
include this functionality within the term
“column analysis”.
Cross-domain analysis (also known as
functional dependency analysis in some
tools) can be applied to data integration
scenarios with dozens of source systems. It
enables the identification of redundant data
across tables from different, and in some
cases even the same, sources. Cross-domain
analysis is done across columns from
different tables to identify the percentage of
values that are the same and hence indicates
whether the columns are redundant.
Data verification algorithms verify if a
value or a set of values is found in a
reference data set ; these are sometimes
referred to as data validation algorithms in
some DQ tools. A typical example for
automated data verification is checking
whether an address is a real address by
using a postal dictionary. It is not possible
to check if it is the correct address, but these
algorithms verify that the address refers to a
real, occupied address. The results depend
on high quality input data. For example,
verification against the postal dictionary
will only produce good results if the address
information has been standardized.
Conclusion
This paper describes the data DQ problems,
despite the fact that some problems can be
automatically detected and that the correction
methods can also be automated, the whole process
cannot be carried out automatically without human
intervention in most cases in finding a common
spelling error in many different instances of a word,
a human is often used to develop the correct regular
expression to automatically find and replace all the
incorrect instances. So between the application of the
automated assessment and improvement methods,
there often exists a manual analysis and
configuration step. The aim of this research was to
provide a review of methods for DQ assessment and
improvement and identify gaps where there are no
existing methods to address particular DQ problems.
References
[1] Briand, L. C., Daly, J., and Wüst, J., "A unified framework for coupling measurement in objectoriented systems", IEEE Transactions on Software Engineering, 25, 1, January 1999, pp. 91-121.
Program Comprehension (IWPC'02), Paris, France, June 27-29 2002, pp. 289-292.
[3] Marcus, A., Semantic Driven Program Analysis, Kent State University, Kent, OH, USA, Doctoral Thesis, 2003.
[4] Marcus, A. and Maletic, J. I., "Recove [1] M. K.Kakhani, S. Kakhani and S. R.Biradar, Research issues in big data analytics, International Journal of Application or Innovation in Engineering & Management, 2(8) (2015), pp.228-232. [2] A. Gandomi and M. Haider, Beyond the hype: Big data concepts, methods, and analytics, International Journal of Information Management, 35(2) (2015), pp.137-144. [3] C. Lynch, Big data: How do your data grow?, Nature, 455 (2008), pp.28-29. [4] X. Jin, B. W.Wah, X. Cheng and Y. Wang, Significance and challenges of big data research, Big Data Research, 2(2) (2015), pp.59-64. [5] R. Kitchin, Big Data, new epistemologies and paradigm shifts, Big Data Society, 1(1) (2014), pp.1-12. [6] C. L. Philip, Q. Chen and C. Y. Zhang, Data-intensive applications, challenges, techniques and technologies: A survey on big data, Information Sciences, 275 (2014), pp.314-347. [7] K. Kambatla, G. Kollias, V. Kumar and A. Gram, Trends in big data analytics, Journal of Parallel and Distributed Computing, 74(7) (2014), pp.2561-2573. ring Documentation-to-Source-Code Traceability Links using Latent Semantic Indexing", in Proceedings 25th IEEE/ACM International Conference on Software Engineering (ICSE'03), Portland, OR, May 3-10 2003, pp. 125-137.
[5] Salton, G., Automatic Text Processing: The Transformation, Analysis and Retrieval of Information by Computer, Addison-Wesley, 1989.
[8] S. Del. Rio, V. Lopez, J. M. Bentez and F. Herrera, On the use of mapreduce for imbalanced big data using random forest,
Information Sciences, 285 (2014), pp.112-137.
[9] MH. Kuo, T. Sahama, A. W. Kushniruk, E. M. Borycki and D. K. Grunwell, Health big data analytics: current perspectives, challenges and potential solutions, International Journal of Big Data Intelligence, 1 (2014), pp.114-126.
[10] R. Nambiar, A. Sethi, R. Bhardwaj and R. Vargheese, A look at challenges and opportunities of big data analytics in healthcare, IEEE International Conference on Big Data, 2013, pp.17-22. [11] Z. Huang, A fast clustering algorithm to cluster very large categorical data sets in data mining, SIGMOD Workshop on Research Issues on Data Mining and Knowledge Discovery, 1997.
[12] T. K. Das and P. M. Kumar, Big data analytics: A framework for unstructured data analysis, International Journal of Engineering and Technology, 5(1) (2013), pp.153-156.
[13] T. K. Das, D. P. Acharjya and M. R. Patra, Opinion mining about a product by analyzing public tweets in twitter, International Conference on Computer Communication and Informatics, 2014.
[14] L. A. Zadeh, Fuzzy sets, Information and Control, 8 (1965), pp.338- 353.
[15] Z. Pawlak, Rough sets, International Journal of Computer Information Science, 11 (1982), pp.341-356.
[16] D. Molodtsov, Soft set theory first results, Computers and Mathematics with Aplications, 37(4/5) (1999), pp.19-31.
[17] J. F.Peters, Near sets. General theory about nearness of objects, Applied Mathematical Sciences, 1(53) (2007), pp.2609-2629.
[19] I. T.Jolliffe, Principal Component Analysis, Springer, New York, 2002.
[20] O. Y. Al-Jarrah, P. D. Yoo, S. Muhaidat, G. K. Karagiannidis and K. Taha, Efficient machine learning for big data: A review, Big Data Research, 2(3) (2015), pp.87-93.
[21] Changwon. Y, Luis. Ramirez and Juan. Liuzzi, Big data analysis using modern statistical and machine learning methods in medicine, International Neurourology Journal, 18 (2014), pp.50-57.
[22] P. Singh and B. Suri, Quality assessment of data using statistical and machine learning methods. L. C.Jain, H. S.Behera, J. K.Mandal and D. P.Mohapatra (eds.), Computational Intelligence in Data Mining, 2 (2014), pp. 89-97.