Psychological Factors Influencing Adherence to Nasal Continuous Positive Airway Pressure in
Obstructive Sleep Apnoea Patients
Simon Roger Mamone (3088364)
Bachelor of Science (Honours) (Psychology) Master of Psychology (Organisational)
Submitted in fulfilment of the requirements for the degree of Doctor of Philosophy
Department of Psychology Victoria University
Keywords
List of key words:
Adherence
Continuous Positive Airway Pressure Health Belief
Health Locus of Control Mood
Non-adherence
Obstructive Sleep Apnoea Personality
Psychological predictors Self-efficacy
Abstract
Obstructive sleep apnoea (OSA) is a chronic sleep-related breathing disorder that if left untreated leads to serious adverse health consequences, poor quality of life, and also impacts negatively on society. Continuous positive airway pressure (CPAP) is widely acknowledged as the best available treatment for moderate to severe OSA. CPAP treatment has been linked to reduced co-morbidities as well as improved quality of life. However, adherence to CPAP therapy is a major obstacle to effective long-term treatment. The aim of this study was to explore and identify predictors of CPAP adherence in a sample of patients with moderate to severe OSA. Specifically the study explored; 1) the combination of psychological factors—mood, personality self-efficacy, health locus of control, and health belief—that best predicted adherence and non-adherence to CPAP use; 2) the impact of adherent CPAP use on mood following the
adherence. Cross-validated classification showed that the overall predictive accuracy was 88%. The results also showed a positive and strong statistically significant reduction in the Apnoea-Hypopnoea Index as well as a positive and strong statistically significant increase in O2
saturation at implementation of CPAP use that demonstrated that CPAP treatment continues to remain an effective treatment option for OSA sufferers. While more research is still needed to exploring the predictive value of a range of psychological factors in relation to CPAP non-adherence in moderate to severe OSA patients the present study provides initial useful
information for predicting adherence and non-adherence. This information is likely to be vital to the development and design of intervention strategies based on the health belief model to
Doctor of Philosophy Declaration
“I, Simon Roger Mamone, declare that the PhD thesis titled ‘Psychological Factors Influencing Adherence to Nasal Continuous Positive Airway Pressure in Obstructive Sleep Apnoea Patients’ is no more than 100,000 words in length including quotes and exclusive of tables, figures, appendices, bibliography, references, and footnotes. This thesis contains no material that has been submitted previously, in whole or in part, for the award of any other academic degree or diploma. Except where otherwise indicated, this thesis is my own work.”
Acknowledgments
It was not without trials and tribulations that I submit this thesis and as such my profound gratitude goes to my PhD supervisor, Associate Professor Gerard Kennedy, who has mentored me in research, critical thinking, and scientific writing. He has had a profound influence on my education, not to mention my professional growth as a psychologist and as an individual. I am indebted to his invaluable insights, suggestions for improvements, motivation, and most of all friendship.
This research was supported by Victoria University (VU) and the respiratory departments at Southern Health and Austin Health and as such I am indebted to the people within these institutions for the opportunities they provided me. Specifically, I would like to extend a big thank you to the School of Social Science and Psychology at VU and in particular the
university’s staff and committee members within the Office for Postgraduate Research for the perseverance and patience. I would also like to extend a big thank you to the staff at the
respiratory departments at Southern Health and Austin Health, in particular Dr Michael Ho, Dr Maree Barnes and most of all Lisa Vessey. Without their ongoing support for this project and attending to my countless needs, completion of this thesis may not have been possible.
I am also grateful to my family members for standing by me throughout the completion of this thesis. I have benefitted from the never-ending support of my parents Jose and Elsa Mamone, and many thanks to my sister Joanne, who also supported me throughout the program and assisted me with follow-up phone calls to patients during the data collection phase. Also, I am thankful for the support and encouragement of my partner, Jane Goller; I could not have completed this thesis without you and our beautiful baby son Harris. You are both an inspiration to me, and I believe I would not have been successful without your support and assistance in data collection and proof reading this dissertation.
TABLE OF CONTENTS
Keywords ... i
Abstract ... ii
Doctor of Philosophy Declaration ... iv
Acknowledgments... v
LIST OF FIGURES ... xii
LIST OF TABLES ... xiii
LIST OF ABBREVIATIONS ... xv
LIST OF APPENDICES ... xx
CHAPTER 1 ... 1
1.1 Introduction ... 1
1.2 Sleep Apnoea ... 7
1.2.1 Definition ... 7
1.2.2 Types of sleep apnoea ... 8
1.3 Diagnosis of OSA ... 10
1.4 Clinical Features of OSA ... 13
1.4.1 Pathophysiology ... 14
1.4.2 Risk factors ... 16
1.4.2.1 Obesity. ... 16
1.4.2.2 Age. ... 17
1.4.2.3 Sex... 18
1.4.2.5 Genetics. ... 21
1.4.2.6 Other risk factors. ... 21
1.4.3 Epidemiology and prevalence ... 23
1.5 Quality of Life... 27
1.6 CPAP Treatment for OSA ... 28
1.6.1 Issues surrounding CPAP treatment for OSA ... 31
1.6.2 Determinants of CPAP adherence ... 34
1.7 Adherence ... 38
1.7.1 Terminology–compliance or adherence ... 38
1.7.2 Adherence research ... 40
1.7.3 CPAP adherence rates ... 43
1.8 Psychological Determinants of CPAP Adherence ... 46
1.8.1 Mood ... 47
1.8.2 Personality... 64
1.8.3 Health Belief Model ... 69
1.8.4 Locus of Control ... 75
1.8.5 Self-Efficacy ... 78
1.8.6 Daytime sleepiness... 82
1.9 Statement of Significance and Contribution to Knowledge ... 83
1.10 Aims ... 86
1.11 Exploratory Question ... 87
2.1 METHOD ... 88
2.1.1 Patients ... 88
2.1.2 Materials ... 89
2.1.2.1 Explanatory statement. ... 89
2.1.2.2 Demographics questionnaire. ... 89
2.1.2.4 Eysenck Personality Questionnaire-Revised Short Form. ... 91
2.1.2.6 Multidimensional Health Locus of Control-Form C. ... 93
2.1.2.7 Epworth Sleepiness Scale. ... 95
2.1.3 Procedure ... 97
2.1.3.1 Diagnostic phase. ... 98
2.1.3.2 Implementation phase. ... 99
2.1.3.3 Data analysis phase. ... 99
2.1.4 Preparation ... 100
2.1.4.1 Polysomnograph procedure. ... 100
2.1.4.2 Monitoring parameters. ... 102
CHAPTER 3 ... 108
3.1 Results ... 108
3.1.1 Treatment of Missing Values and Outliers ... 109
3.1.1.1 Missing values. ... 109
3.1.1.2 Outliers. ... 112
3.3 Test of Assumptions ... 113
3.4 Reliability Analyses ... 115
3.5 Statistical Analysis ... 119
3.5.1 Patient characteristics ... 119
3.5.2 Examination of Sleep-Related Variables ... 122
3.5.3 Exploration of Psychological Factors ... 125
3.5.3.1 Psychological predictors of CPAP adherence. ... 130
4.1 Discussion ... 135
4.2 Review of Exploratory Questions and Explanation of Findings ... 137
4.2.1 Characteristics of the sample ... 137
4.2.2 Exploratory Question One ... 140
4.2.2.1 Mood. ... 141
4.2.3 Social Cognitive Factors ... 144
4.2.3.1 Health Locus of Control. ... 146
4.2.3.2 Self-Efficacy. ... 148
4.2.3.3 Health Belief. ... 150
4.2.3.4 Personality. ... 152
4.2.4 Exploratory Question Two ... 154
4.2.5 Exploratory Question Three ... 158
4.2.5.1 Sleepiness. ... 161
4.3 Clinical Implications ... 165
4.3.2 Intervention Options to Increase CPAP Adherence... 167
4.3.2.1 Supportive interventions. ... 167
4.3.2.2 Educational interventions. ... 168
4.3.2.3 Cognitive behavioural interventions. ... 168
4.3.2.4 Mixed strategy interventions. ... 169
4.4 Limitations, Strengths and Future Direction ... 169
4.5 Conclusion ... 172
LIST OF FIGURES
Figure 1 Dickens’ “Fat Boy”...2
Figure 2 An integrated map of the pathogenesis of the cyclical nature of OSA...15
Figure 3 Summary of risk factors grouped as modifiable and non-modifiable...16
Figure 4 Diagram of normal and apneic an upper airway...20
Figure 5 CPAP device...28
Figure 6 Patient connected to a polysomnography...104
Figure 7 Polysomnography results...106
Figure 8 Parameters monitored during a polysomnography...107
Figure 9 Educational level of the study participants...119
LIST OF TABLES
Table 1 Landmark Sleep Studies of OSA During the 1970s and 1980s... 4
Table 2 Medical Consequences of Sleep Apnoea... 7
Table 3 Common Symptoms of Obstructive Sleep Apnoea... 10
Table 4 AHI and Oxygen Saturation Values Representing Different Severity Levels... 12
Table 5 Risk Factors for Obstructive Sleep Apnoea... 22
Table 6 Large Sample Studies on the Prevalence of OSA... 24
Table 7 Estimated Prevalence of Moderate to Severe OSA in Australia, 2010... 26
Table 8 Reports of Minor Adverse Events from CPAP... 30
Table 9 Intervention Studies to Improve CPAP Adherence... 35
Table 10 Summary of the Findings from the Literature on Mood and Sleep Apnoea………..…... 50
Table 11 Treatment Options for Obstructive Sleep Apnoea... 85
Table 12 Stages of Sleep... 108
Table 13 Reliability Coefficients for the POMS, EPQ-RS, MHLC-C, GSE, and Health Belief Measure at the Diagnostic and Implementation Phases (n = 69)... 116
Table 14 Perceptions of OSA and CPAP Use at Diagnostic and Implementation Phases (n = 69)... 120
Table 16 Means, Standard Deviations and Percentages Associated with Psychological Factors (Mood, Personality, General Self-Efficacy, Health Locus of Control, Health Belief) at the Diagnostic Phase
and Six Months following the Implementation Phase... 126 Table 17 Stepwise Statistics Loadings Ranked According to Relative Importance
of the Predictors for CPAP Adherence and Non-Adherence………... 131 Table 18 Means and Standard Deviations for Identified Predictor Variables for the
LIST OF ABBREVIATIONS
% Percentage
< Less than
> Greater than
Α Alpha
ADHD Attention Deficit Hyperactivity Disorder
AHI Apnoea-Hypopnoea Index
AIDS Acquired Immunodeficiency Syndrome
ANOVA Analysis of Variances
APA American Pharmacist Association
ASP Average Sleep Propensity
Auto-PAP Auto-titrating Positive Airway Pressure
BAS Behavioural Activation System
BDI Beck Depression Inventory
Bi-level PAP Bi-level Positive Airflow Pressure
BIS Behavioral Inhibition System
BMI Body Mass Index
BSI Brief Symptoms Inventory
CAD Coronary Artery Disease
CES-D Center for Epidemiologic Studies
CES-D Scale Center for Epidemiological Studies Depression Scale
CI Confidence Interval
CO2 Carbon Dioxide
CPAP Continuous Positive Airway Pressure
CSA Central Sleep Apnoea
CVA Cerebrovascular Accidents
DA Discriminant Functional Analysis
DS-14 Type D Scale 14
ECG Electrocardiograph
ECG or EKG Electrocardiogram
EDS Excessive Daytime Sleepiness
EEG Electroencephalogram
EM Expectation-maximization
EMG Electromyogram
EOG Electrooculogram
EPQ-RS Eysenck Personality Questionnaire-Revised Short
ESS Epworth Sleepiness Scale
ESS Epworth Sleepiness Scale
FOSQ Functional Outcomes of Sleep Questionnaire
FPI Freiberger Personality Inventory
GG Genioglossus
GSE General Self Efficacy Scale
HADS Hospital Anxiety and Depression Scale HAM-D Hamilton Rating Scale for Depression;
HBM Health Belief Model
HIV Human Immunodeficiency Virus
HLC Health Locus of Control
ICSD International Classification of Sleep Disorders
IPIP International Personality Item Pool-Five-Factor Model measure
IQ Intelligence Quotient
M Mean
MANOVA Multiple Analysis of Variances
MCAR Missing Completely at Random
MET Motivational Enhancement Therapy
MHLC Multidimensional Health Locus of Control
MHLC-C Multidimensional Health Locus of Control – Form C
MI Multiple Imputation
MMPI Minnesota Multiphasic Personality Inventory
MOOD-SR MOOD Questionnaire
MSLT Multiple Sleep Latency Test
MSQ Mini Sleep Questionnaire
MVA Missing Value Analysis
MWT Maintenance of Wakefulness Test
N or n Sample Size
NA Negative Affectivity
NCPAP Nasal Continuous Airway Pressure
NIH National Institutes of Health
O2 Oxygen
OR Odds Ratio
OSA Obstructive Sleep Apnoea
p Statistical Significance
PAP Positive Airway Pressure
PAQ Patient Assessment Questionnaire
POMS Profile of Mood States;
POMS-SF Profile of Mood States - Short form
PSG Polysomnography
PSQI Pittsburgh Sleep Quality Index
RDI Respiratory Disturbance Index
REM REM - Rapid Eye Movement
REM AHI Rapid Eye Movement Apnoea-Hypopnoea Index REM O2 Rapid Eye Movement oxygen saturation
Rho Spearman's Rank Correlation Coefficient
SADS Schedule for Affective Disorders and Schizophrenia; SAQLI Sleep Apnoea Quality of Life Index
SAS Sleep Apnoea Symptoms
SCL Symptom Checklist
SCT Social Cognitive Theory
SD Standard Deviation
SDB Sleep-Disordered Breathing
SDS Zung Self-Rating Depression Scale
SECI Side Effects of CPAP Inventory
SEMSA Self-Efficacy Measure for Sleep Apnoea
SI Social Inhibition
SIDS Sudden Infant Death Syndrome
SPSS Statistical Package for Social Science STAI The State-Trait Anxiety Inventory
TM Transtheoretical Model
TMAS Taylor Manifest Anxiety Scale
TMD Total Mood Disturbance
UK United Kingdom
U.S. United States
VU Victoria University
WHO World Health Organization
WHR Waist-Hip Ratio
LIST OF APPENDICES
Appendix A Austin Health consent form………216
Appendix B Victoria University consent form………...…218
Appendix C Demographic questions………..221
Appendix D The Profile of Mood States-Short Form……….…………224
Appendix E General Self Efficacy Scale……….………...226
Appendix F The Eysenck Personality Questionnaire……….……….228
Appendix G Multidimensional Health Locus of Control–Form C………..231
Appendix H Health Belief Scale……….….233
CHAPTER 1
1.1 Introduction
It was not until the 1970s that researchers began to study and understand sleep apnoea, although medical literature suggests that it was noted in the early 19th century. While it is highly likely that common symptoms of sleep apnoea—loud snoring and daytime sleepiness—have been noted since the “dawn of time”, it was not until the 1870s that British physicians began to reporting on several cases of obstructive apnoeas, describing them as “fruitless contractions of the inspiratory and expiratory muscles against glottic obstruction with accompanying cyanosis during sleep” (Lavie, 2003, p. 24). Such findings led to early research pioneered by physicians Hunter, Cheyne and Stoke in the 19th century on daytime sleepiness and periodic breathing in patients with heart failure (Lavie, 2003). It was not until after the mid-19th century that physicians began to observe initial links between obese individuals and daytime sleepiness, describing them as having “Pickwickian syndrome” after Charles Dickens’ “Fat Boy” Joe from the 1837 Pickwick Papers (Dickens, 1837) (see Figure 1). In mid-1950s, over 100 years later, researchers began to draw firm conclusions regarding the link between obesity and the control of breathing, although the association with a sleep disorder was not initially considered by
Figure 1. Dickens’ “Fat Boy”. Described as being upright with his eyes closed as if in sleep and
having an expression of “calmness and repose”. Such an image depicts symptoms of modern-day sleep apnoea, as it is recognised that many people with OSA fall asleep at inappropriate times and inappropriate situations (e.g., in a theatre, at the dinner table and even while driving) Adapted from, Dickens' "Fat Boy": A Classic Case of Sleep Apnoea, by K. White, 2000. Retrieved from http://www.talkaboutsleep.com/sleep-disorders/archives/Snoring_apnoea _dickens.htm.
It was not until Bulow’s study in the early 1960s that a more accurate description of obstructive sleep apnoea (OSA) was reported and by the mid-1960s, Gastaut, Tassinari, and Duron reported the first comprehensive account of OSA in obese individuals as intermittent airway obstruction with frequent arousals (cited in Lavie, 2003). Gastaut et al.’s study
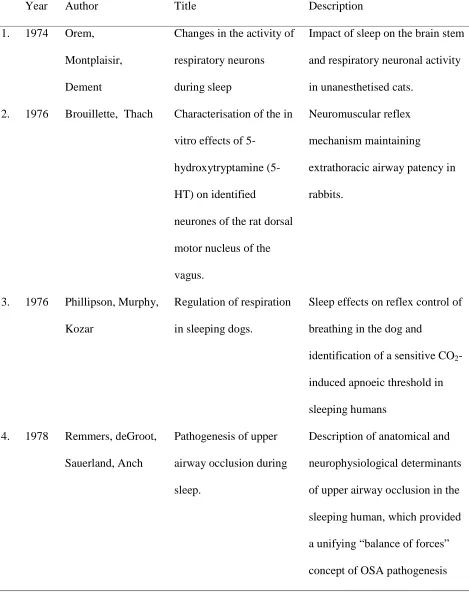
and daytime sleepiness (Lavie, 2003). However, regardless of the importance of Gastaut et al.’s findings, OSA research continued to progress very slowly, and it was not until mid-1970s through to the early 1980s that physiological research really got underway. During this period, a number of reports paved the way for sleep and breathing research and the introduction of continuous positive airway pressure (CPAP) as the non-invasive treatment option for OSA sufferers—a move away from the use of tracheostomy in the early 1970s (see Table 1).
Table 1
Landmark Sleep Studies of OSA During the 1970s and 1980s
Year Author Title Description
1. 1974 Orem, Montplaisir, Dement
Changes in the activity of respiratory neurons during sleep
Impact of sleep on the brain stem and respiratory neuronal activity in unanesthetised cats.
2. 1976 Brouillette, Thach Characterisation of the in vitro effects of
5-hydroxytryptamine (5-HT) on identified
neurones of the rat dorsal motor nucleus of the vagus.
Neuromuscular reflex mechanism maintaining
extrathoracic airway patency in rabbits.
3. 1976 Phillipson, Murphy, Kozar
Regulation of respiration in sleeping dogs.
Sleep effects on reflex control of breathing in the dog and
identification of a sensitive CO2 -induced apnoeic threshold in sleeping humans
4. 1978 Remmers, deGroot, Sauerland, Anch
Pathogenesis of upper airway occlusion during sleep.
5. 1981 Sullivan, Issa, Berthon-Jones, Eves
Reversal of obstructive sleep apnoea by
continuous positive airway pressure applied through the nares.
The landmark introduction of CPAP application as the noninvasive treatment for obstructive sleep apnoea.
Source: Dempsey, Sigrid, Veasey, Barbara, Morgan, & O'Donnell (2010).
In the 1990s, Fletcher, Lesske, Qian, Miller, and Unger (1992) paved the way for studies exploring long-term cardiovascular consequences of OSA by inducing sleep apnoea in rats. Using 12-second infusionsof nitrogen gas into daytime sleeping chambers, four groups of male rats (250–375 g) were subjected to cyclic hypoxia (3–5% nadir ambient oxygen) every 30 seconds, seven hours per day for up to 35 days, to create daytime hypertension. Fletcher and colleagues were one of the first to study an association between chronic high blood pressure and OSA and hypothesised that repetitive episodic hypoxia patterned after the hypoxia seen in OSA could contribute to the elevation of blood pressure.
At the same time, Mezzanotte, Tangel, and White (1992) studied the waking
In 1993, Young et al. published the first population-based study conducted using
laboratory sleep studies. Young et al. utilised the data from the Wisconsin Sleep Cohort Study, a longitudinal study of the natural history of cardiopulmonary disorders of sleep, to estimate the prevalence of undiagnosed sleep-disordered breathing among adults. Using a random sample, Young et al. selected 602 employed men and women aged 30 to 60 years old to determine the frequency of episodes of apnoea and hypopnoea per hour of sleep. The estimated prevalence of sleep-disordered breathing—defined as an apnoea-hypopnoea score of five or greater—was 9% for women and 24% for men. Young et al. estimated that 2% of women and 4% of men in the middle-aged workforce met the minimal diagnostic criteria for sleep apnoea syndrome (an apnoea-hypopnoea score of five and greater and daytime sleepiness). Again, men and obesity were strongly associated with the presence of sleep-disordered breathing. In their study, Young et al. also reported that habitual snorers, both men and women, tended to have a higher
prevalence of apnoea-hypopnoea scores of 15 and greater. Most importantly, Young et al.’s findings provided evidence to suggest that the prevalence of undiagnosed sleep-disordered breathing was high among men and much higher than suspected among women. This study also drew a strong association between undiagnosed sleep-disordered breathing and daytime
sleepiness, demonstrating the potential importance and impact that sleep apnoea has on public health. It is also probable that the prevalence of sleep-disordered breathing is actually higher than reported by Young and colleagues (Popescu, Latham, Allgar, & Elliott, 2001).
As such, sleep apnoea has attracted many researchers from varying disciplines, psychology being one of the more recent specialities to contribute to the growth of research in this area.
1.2 Sleep Apnoea
1.2.1 Definition
Derived from the Greek word “apnoea” literally meaning “without breath,” sleep apnoea is characterised by the recurrent cessations or interruptions of breathing during sleep due to the functional collapse of the upper airway. Cessation can be partial (hypopnoea), contributing to decreased tidal volume, or complete (apnoea), contributing to the loss of ventilatory effort. As a result, an individual’s capacity to take in oxygen is decreased, contributing to a lowered blood oxygen level that triggers the brain to prompt the individual to breathe again via gasping, which in turn “jump starts” the breathing process until the next cessation. Many medical consequences have been associated with sleep apnoea and they are strongly related to pathophysiological findings linked to sleep fragmentation (leading to complications arising from sleep deprivation) and blood oxygen desaturation in severe cases (see Table 2).
Table 2
Medical Consequences of Sleep Apnoea
Cardiovascular consequences Other consequences Other associated conditions Hypertension (high blood
pressure)
Trauma (traffic accidents) Obesity
Prader-Willi syndrome Atherosclerosis (heart attacks,
angina)
Snoring spouse syndrome Polycystic ovary disease
Atherosclerosis (stroke) Diminished libido Renal failure Atrial fibrillation In children: illness like
attention deficit hyperactivity disorder (ADHD)
Hypothyroidism
Ventricular arrhythmias In children: slowed growth Marfan syndrome
Pulmonary hypertension Charcot-Marie-Tooth disease
Post-polio syndrome Gastro-esophageal reflux Worsening of epilepsy
1.2.2 Types of sleep apnoea
There are three different types of sleep apnoea:
Wuensch, Lee, & Demaree, 2011). It is believed that the actual prevalence of OSA is in fact double that currently reported and diagnosed (Popescu et al., 2001). OSA is usually associated with the following commonly identifiable symptoms: daytime sleepiness, loud or chronic snoring, choking or snorting, and long pauses in breathing (see Table 3) (Popescu et al., 2001).
2. Central sleep apnoea (CSA). CSA is a relatively rare form of sleep apnoea where the airway remains open, but the thoracic and abdominal muscles (i.e., diaphragm and chest muscles) temporarily fail to process instructions from the brain to continue moving air to and from the lungs. Because the airway is typically open, a CSA sufferer does not snore loudly but does experience daytime sleepiness. The prevalence of CSA is asymptomatic given the very low number of reported cases in the general population (less than 1%) (Bixler, Vgontzas, Ten Have, Tyson, & Kales, 1998). CSA is more common among people over 60 years of age, and it is often associated with other medical conditions such as, sleep disorders, insomnia, neurological disorders, and heart failure where the prevalence of CSA is said to be as high 40% to 60% (Javaheri et al., 1998; Lanfranchi et al., 1999; Lavie, Pillar, & Malhotra, 2002).
Table 3
Common Symptoms of Obstructive Sleep Apnoea
Daytime symptoms Symptoms during sleep
Daytime sleepiness or fatigue Restlessness during sleep Headaches in the morning Dry mouth or sore throat Trouble concentrating, forgetfulness,
depression, or irritability
Sudden awakenings with a sensation of gasping or choking
Sexual dysfunction Snoring
Difficulty getting up in the mornings Night sweats
1.3 Diagnosis of OSA
The International Classification of Sleep Disorders (ICSD), Revised Diagnostic and Coding Manual states that “obstructive sleep apnoea syndrome is characterised by repetitive episodes of upper airway obstruction that occur during sleep, usually associated with a reduction in blood oxygen saturation” (American Academy of Sleep Medicine, 2001). The American Academy of Sleep Medicine recommends the following diagnostic criteria for determining OSA:
A. The patient has a complaint of excessive sleepiness or insomnia. Occasionally, the patient may be unaware of clinical features that are observed by others. B. Frequent episodes of obstructed breathing occur during sleep.
C. Associated features include: 1. loud snoring
3. a dry mouth upon awakening
4. chest retraction during sleep in young children D. Polysomnographic monitoring demonstrates:
1. more than five obstructive apnoeas, greater than 10 seconds in duration, per hour of sleep and one or more of the following:
a. frequent arousals from sleep associated with the apnoeas b. bradytachycardia; and
c. arterial oxygen desaturation in association with the apnoeic episodes 2. A mean sleep latency of less than 10 minutes as measured by the Multiple Sleep Latency Test (MSLT).
E. The symptoms can be associated with other medical disorders (e.g., tonsil enlargement).
F. Other sleep disorders can be present (e.g., periodic limb movement disorder or narcolepsy).
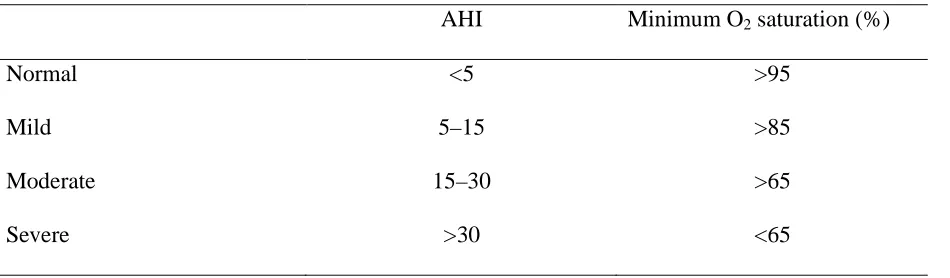
For a diagnosis, a full night’s sleep study should be undertaken in a sleep laboratory where ideally six hours of sleep is recorded. The sleep study generally consists of continuous arterial oxygen and electrocardiograph (ECG) monitoring and polysomnography (PSG), as well as measurements of airflow through the nose and/or mouth and thoracic cage movement during all stages of sleep. OSA severity is assessed by the Respiratory Disturbance Index (RDI) and/or the Apnoea-Hypopnoea Index (AHI). The AHI is the most commonly reported index in sleep disorder research as well as sleep studies and it is calculated by dividing the number of
the AHI cut-off points have not been adequately determined and are mainly based on
epidemiological data and consensus (Young et al. 1993; American Academy of Sleep, 1999).
Table 4
AHI and Oxygen Saturation Values Representing Different Severity Levels
AHI Minimum O2 saturation (%)
Normal <5 >95
Mild 5–15 >85
Moderate 15–30 >65
Severe >30 <65
A detailed medical history is taken, and a thorough otolarynogological examination is conducted to provide information about airway morphology. Furthermore, a general physical examination is also commonly conducted to detect any co-existing cardiopulmonary
abnormalities. Blood samples may be taken to assess for polycythaemia resulting from hypoxic bone marrow stimulation. A chest radiograph and ECG may also be conducted to evaluate cardiopulmonary functioning and identify any co-existing abnormality, as well as a spirometry test where a saw toothed patterned result may be indicative of possible airway obstruction during sleep (Lavie et al., 2002).
occurring during sleep apnoea. It is considered that fibre-optic pharyngoscopy would yield better information if it could be performed during sleep, but this method is generally viewed as too invasive and impractical (Lavie et al., 2002).
The aforementioned investigations are commonly used for diagnosis and enable the necessary distinction to be made between type, frequency, and severity of apnoeic episodes, as well as their incidence during rapid eye movement (REM) sleep and non-REM sleep. For a diagnosis of CSA, at least 80% of the events are required to be of central origin. The RDI and/or AHI is used to assess the severity of OSA and CSA by means of measuring of the rate of sleep-disordered breathing events per hour of sleep and the magnitude of associated oxygen
desaturation (low partial pressure of oxygen in the arterial blood) (Lavie et al., 2002; Somers, et al., 2008).
1.4 Clinical Features of OSA
Daytime sleepiness due to repeated nocturnal wakening is a major incapacitating
symptom of OSA, which can have serious social, economic (job loss, lost work time), and safety consequences (work and road accidents). Decreased quality of life, fatigue, neuro-cognitive impairments, increased risk of mood disorders, morning headaches, decreased libido, and impotence are also common symptoms of OSA (see Table 2) (Young, Blustein, Finn, & Palta, 1997; Masa, Rubio, & Findley, 2000; Aloia, Arnedt, Stepnowsky, Hecht, & Borrelli, 2005).
1.4.1 Pathophysiology
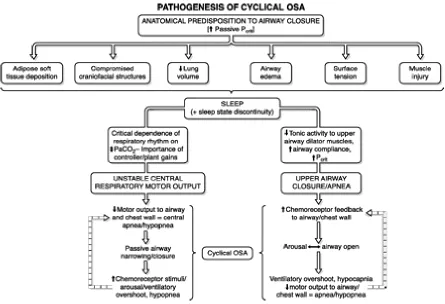
OSA occurs as a result of the collapse of the upper airway during sleep that limits airflow and in more severe cases reduces blood oxygen levels during sleep. Physiologically, structural narrowing, generally in the velopharyrnx and/or tongue base hypopharyngeal region, contributes to airway occlusion as the tongue comes into contact with the soft palate and posterior
Figure 2. An integrated map of the pathogenesis of the cyclical nature of OSA. This map
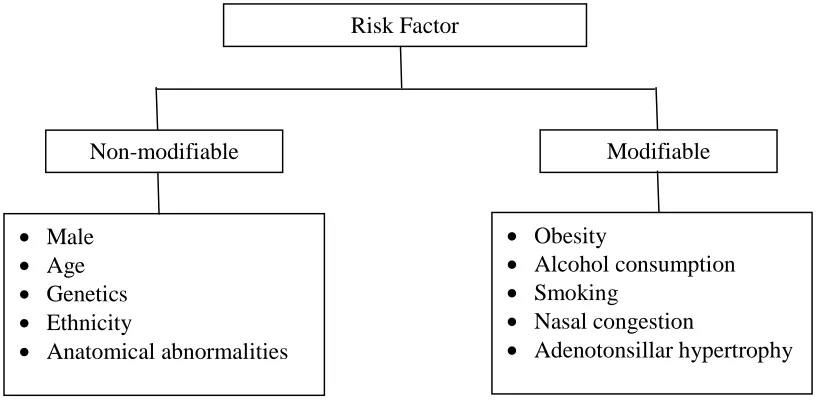
1.4.2 Risk factors
Several risk factors are responsible for the development and progression of OSA and can be categorised into modifiable and non-modifiable risk factors (see Figure 3).
Figure 3. Summary of risk factors grouped as modifiable and non-modifiable. Adapted from
Sleep Disordered Breathing Disorders, S. Sharma, A. Khanna, & A. Sharma, A. n.d., The Association of Physicians of India. Retrieved from http://www.apiindia.org/medicine
_update_2013/chap104.pdf.
1.4.2.1 Obesity.
Obesity has been identified as the most likely single predictive risk factor for the development of OSA. Numerous studies have reported a high prevalence of OSA in obese patients, with up to 70% of those classified as morbidly obese (body mass index/BMI of 40
Risk Factor
Non-modifiable Modifiable
• Male
• Age
• Genetics
• Ethnicity
• Anatomical abnormalities
• Obesity
• Alcohol consumption
• Smoking
• Nasal congestion
kg/m2 or more) suffering from OSA (Davies & Stradling,1990; Davies, Ali, & Stradling, 1992; Hoffstein & Mateika, 1992; Katz, Stradling, Slutsky, Zamel, & Hoffstein, 1990; Levinson et al., 1993; Millman, Carlisle, McGarvey, Eveloff, & Levinson, 1995; Shelton, Woodson, Gay, & Suratt, 1993; Shinohara, et al., 1997 all cited in Young, Peppard. & Gottlieb, 2002).
To date, clinical research has provided little explanation of the exact mechanism(s) by which obesity causes OSA. However, it is widely suggested that the relationship between obesity and OSA relates to a combination of several factors. These factors include upper airway
narrowing (as stated above), weakening of the upper airway muscles, and decreased lung volumes. Central obesity, where fat distributions are localised to the abdomen and upper part of the body, contribute more to the risk for OSA than general obesity. Some researchers consider this to be the best explanation for why a greater proportion of men suffer from OSA. Neck circumference index and waist-hip ratio (WHR) have also been identified as predictors of OSA (Lavie et al., 2002). The predictive association between obesity and OSA is supported by research showing that weight reduction in morbidly obese patients often either eliminated or more commonly reduced the severity of OSA (Young et al., 2002; Lavie et al., 2002). Physical activity and an exercise training regime have been shown to have positive moderate treatment efficacy for the reduction of AHI in obese adults, which suggests that exercise may be beneficial for the management of OSA beyond weight reduction (Kline et al., 2011).
1.4.2.2 Age.
predispose individuals to an increased risk of apnoea. However, the most likely explanation is that with increasing age many people gain weight. In addition, there may be deterioration in the integrity of the muscles in the neck and throat area. Historically, a number of longitudinal and cross-sectional studies have documented that OSA is age-dependant (Ancoli-Israel et al., 1991; Bixler, Vgontzas, Ten Have, Tyson, & Kales, 1998; Durán, Esnaola, Rubio, & Iztueta, 2001; Budhiraja et al., 2007). In children, reports of OSA (in individuals three to five years of age) are generally associated with narrow airways, large tonsils, and adenoids (Lavie, et al. 2002). Studies have shown that OSA prevalence is low during adolescence and early adulthood and then
dramatically increases during middle age and old age (i.e., 60 to 70 years of age) independently of BMI (Ancoli-Israel et al., 1991; Budhiraja et al., 2007).
1.4.2.3 Sex.
Lavie et al., 2002). The third suggests that central obesity, which is more common in men
because of the distribution of fat on the body, is the main cause of OSA (Strohl & Redline, 1996; Lavie et al., 2002). The fourth suggests that sex-related, genetic, anatomical differences in the upper airway (inclusive of hormone-mediated explanations) may cause OSA (Strohl & Redline, 1996; Lavie et al., 2002). Reports of increased OSA prevalence in post-menopausal women support the possibility that sex hormones play a role in OSA (Krystal, Edinger, Wohlgemuth, & Marsh, 1998 cited in Young et al., 2002). Other studies have reported that hormone replacement therapy in post-menopausal women results in increased upper airway muscle, thus decreasing OSA (Lavie et al., 2002). However, the replication of such studies where men were treated with hormone therapy has yielded opposite findings, which suggests that hormonal differences alone may not explain the sex-related difference in OSA (Young et al., 2002; Lavie et al., 2002).
1.4.2.4 Anatomy.
Anatomical narrowing of the upper airway has been identified as a risk factor for OSA. Using imaging technology, clinical studies have shown that having a small pharyngeal airway increases the possibility of OSA. Other anatomical factors include upper airway narrowing as a result of obesity or from specific craniofacial abnormalities, mid-face hypoplasia, mandibular hypoplasia, increased soft tissue size, hypertrophy of the tonsils and adenoids (which are especially important in children), and increased uvula size or long soft palate (Lavie, et al., 2002).
contribute to increased nasal resistance that can result in increased negative pressure by the diaphragm and an increased tendency of the upper airway to collapse (Lavie, et al., 2002).
Figure 4. a. Diagram of the upper airway showing the soft palate is normal in length and total
size. The tongue is normal in size and is angled forward. The upper airway at the level of the nasopharynx and hypopharynx is normal in size and contour. B. In contrast to the apneic where there is an elongated and enlarged soft palate impinges on the posterior airway at the level of the nasopharynx. In addition, a retruding jaw pushes an enlarged tongue posteriorly to impinge on the hypopharyngeal. Adapted from Pathophysiology of Sleep Apnoea, by J. Dempsey, S. Veasey, B. Morgan, & C. O’Donnell, 2010, Physiological Reviews 1(90), 47-112. Copyright 2010 by the American Physiological Society. Adapted with permission.
1.4.2.5 Genetics.
Several studies have reported an autosomal dominant pattern of inheritance of OSA, but the role that genetics play is not well understood (Strohl, Saunders, Feldman, & Hallett, 1978; Mathur & Douglas, 1995; Redline et al., 1995; Redline & Tishler, 2000). Nonetheless, it is widely acknowledged that the genetic link is multi-factorial and familial patterns are reported as potential indicators of OSA (Lavie et al., 2002). Research in this area has suggested a higher prevalence of OSA diagnoses in offspring whose parents were also previously diagnosed with OSA, with the relative risk of OSA being two- to four-fold greater in first-degree relatives. Some studies have reported that familial factors may account for as much as 40% of the variance in AHI and suggest that this variance remained significant after adjustment for BMI and
cephalometric measurement (Redline et al. 1995; Redline & Tishler, 2000; Lavie, et al., 2002). While little is understood about the importance of genetics, Lavie and colleagues (2002) report an increased risk of OSA in lean relatives of OSA subjects along with a higher incidence of sudden infant death syndrome (SIDS) in these families.
1.4.2.6 Other risk factors.
Several additional unique, but less common risk factors are also known to contribute to OSA. These include diseases such as hypothyroidism (mainly caused by myxoedema and decreased upper airway muscle functions) and acromegaly (mainly resulting from macroglossia and potentially disordered ventilator control stability) (Lavie et al., 2002). Additionally,
include neuromuscular diseases such as Duchenne and myotonic dystrophies, myopathies such as Nemaline-Rod myopathy or acid-maltase deficiency, and neuropathies such as Charcot-Marie-Tooth peripheral neuropathy or post-polio syndrome (Lavie et al., 2002). These muscular diseases increase the likelihood of hypoventilation and both central and obstructive types of sleep-disordered breathing events (Lavie et al., 2002). Quadriplegia also results in mild OSA as well as related neurological and cognitive deficits, sleepiness, and reduced quality of life (Berlowitz et al., 2012).
Chronic lung disease also contributes to events of oxygen desaturation, usually resulting from hypoventilation and low lung capacity. Whilst there is no real association between chronic lung disease and OSA, OSA does tend to be more severe in this population. In addition, the use of central nervous system (CNS) depressants such as hypnotics, opioids or alcohol increases the risk of apnoeas (Lavie, et al., 2002). Table 5 summarises the risk factors for OSA.
Table 5
Risk Factors for Obstructive Sleep Apnoea
Risk factors Examples
Upper airway anatomy Retrognathia, mirognathia, macroglossia, hypertrophy of tonsils or adenoids, increased uvula size, long soft palate, nasal narrowing
Obesity Increases, especially with central obesity
prevalence increases with age
Endocrine Hypothyroidism, acromegaly
Genetic OSA cluster in families, with relative risk of
two - to fourfold in first-degree relatives
Neuromuscular Myopathies, muscular dystrophies,
neuropathies
Extrinsic Alcohol, CNS depressants (hypnotics, opioids)
Source: Lavie et al. (2002).
1.4.3 Epidemiology and prevalence
The prevalence of OSA has been well documented in population-based studies, resulting in well-defined epidemiological characteristics of the condition (Chesson et al., 1997; Malhotra & White, 2002; ICSD-2, 2005). Population-based studies have estimated the prevalence of sleep-disordered breathing (AHI > five events per hour) to be approximately 9% in females and 24% in males and to be much higher (up to 80%) in the elderly. An AHI greater than five is insufficient alone for a diagnosis of OSA, and diagnosis is generally supported by characteristic
be noted however, that although subjective daytime sleepiness is currently required for the diagnosis of OSA, there is evidence to suggest that some people may be unaware of their sleepiness and that important complications of OSA such as hypertension may occur in the absence of sleepiness. Thus, the prevalence of OSA may be higher if cardiovascular complications are included in the definition (Popescu et al., 2001).
Table 6
Large Sample Studies on the Prevalence of OSA
Country Study Sample
size
Ethnicity Diagnostic method
Men Women
US Young et al.
(1993)
602 White Polysomnography 4% 2%
US Bixler et al. (2001)
1741 White Polysomnography 3.9% 1.2%
Australia Bearprk et al. (1995)
485 White MEASAM IV 3.1% -
India Udwadia et al. 2004)
250 Indian Polysomnography 7.5% 4.5%
The most widely referenced population-based study on the prevalence OSA is the
Wisconsin Sleep Cohort Study (American Academy of Sleep, 1999; Peppard et al., 2000; Young & Peppard, 2000; Malhotra & White, 2002; Young el at., 2002; Young, 2009). The primary goal of the Wisconsin Sleep Cohort Study (WSCS) was to provide an account of the natural history of sleep-disordered breathing (SDB) and other sleep disorders, with the longer-term goal of better understanding the total societal burden of SDB. The WSCS provided valuable and specific information describing the occurrence of SDB (including age- and sex-specific prevalence for mild, moderate, and severe SDB), an estimate (including longitudinal data) on the impact of SDB with regard to cardiovascular and morbidity and mortality, and identified risk factors for the development and progression of SDB (Young, 2009). The study design of the WSCS mirrored those of standard epidemiological cohort studies. The WSCS design utilised population-based sampling, recruitment of a probability sample, and collection of data at baseline and follow-up. Adding to the value of the design, the WSCS used laboratory PSG, which provided extensive biomedical data (sleep-related variables) and offered a means for the findings to be translated to the clinical setting (Young, 2009).
The WSCS study estimated that OSA affected approximately 2% of women and 4% of men in the north-central region of America (Peppard et al., 2000; Young & Peppard, 2000; Malhotra & White, 2002; Young el at., 2002; Young, 2009). However, up to 9% of women and 24% of men in this population had an AHI greater than five without the presence of coexisting OSA symptoms. These figures were comparable to those reported in Australia’s most
Australia: The economic cost of sleep disorder in Australia, 2010.” These Australian reviews estimated the OSA prevalence in Australia to be between 3% and 5%.
The “Wake up Australia” study estimated that 1.2 million Australians (6% of Australia’s population) suffered from sleep-related disorders that were likely to impact on both the
physiological and psychological functioning of an individual. The cost of poor sleep to the Australian population was estimated to be between $3 billion and $7 billion per annum—not inclusive of the social costs (Access Economics, 2004). The 2010 Deloitte Access Economic report (2011) estimated the total number of Australians suffering from OSA to be approximately 774,590, with women making up 24% (185,410) and men 76% (589,181) of OSA sufferers (see Table 7).
Table 7
Estimated Prevalence of Moderate to Severe OSA in Australia, 2010
Age group Women Men Persons
% No. % No. % No.
20-44 0.6 22,775 3.3 126,317 1.6 149,092
54-64 1.9 53,706 10.3 287,186 5.3 340,892
65+ 6.7 108,929 12.6 175,677 10.2 284,606
Total 2.2 185,410 7.2 589,181 4.7 774,591
Source: Deloitte Access Economic (2011).
treatment option (Pepin et al., 1999; Collard, Pieters, Aubert, Delguste, & Rodenstein, 1997; Malhotra, Ayas, & Epstein, 2000; Popescu et al., 2001; Stepnowsky & Moore, 2003). However, the insidious nature of OSA means that it often goes undiagnosed for many years and the prevalence of OSA is probably higher than estimated by the key studies mentioned above. Studies by Davies and Stradling (1996), Lindberg and Gislason (2000), and Young et al. (2002) have reported that the level of undiagnosed OSA among adults in Western countries may be as high as 5%. Wiegand and Zwillich (1994) attributed the under-diagnosis of OSA to the low awareness of OSA in the community and among health professionals and they suggested that 80% to 90% of affected individuals may not have received a clinical diagnosis (Young et al., 1993; Wiegand & Zwillich, 1994). Given the estimate of undiagnosed OSA, improving knowledge of sleep disorders at the primary care level would be a useful goal.
1.5 Quality of Life
The impact of OSA on quality of life is extensive and well documented (Young, et al., 1997; Masa et al., 2000; Baldwin, Griffith, Nieto, O'Connor, Walsleben, & Redline, 2001; Aloria et al., 2005). The consequences of OSA are commonly reflected by deficits in memory and concentration, reduced levels of alertness and increased sleepiness, fatigue, irritability,
medical implications (Flemons & Tasi, 1997; Paiva, Farinha, Martins, Batista, & Guilleminault, 1997; Wright, Johns, Watt, Melville, & Sheldon, 1997).
1.6 CPAP Treatment for OSA
CPAP use has been shown to be the most common and effective form of treatment for alleviating OSA symptoms such as loud snoring, daytime sleepiness, and excessive fatigue (Popescu et al., 2001). CPAP treatment involves connecting a patient to a CPAP device that delivers a flow of positively pressured air, via a mask worn over the nose and/or mouth, at a predetermined pressure during sleep (see Figure 5). This pressure is continuously maintained throughout phases of the respiratory cycle, acting as Sullivan et al. first described in their 1981 paper as a “pneumatic splint” holding open the upper airway to prevent the occurrence of apnoeas (Sullivan et al., 1981; McDaid et al., 2009).
Continuous Positive Air Pressure Device
Mask
Figure 5. CPAP device. Diagram of a CPAP device that “splints” the patient’s airway open
during sleep by means of a flow of pressurised air into upper airways. The patient usually wears a plastic facial mask, which is connected by a flexible tube to a small CPAP device. Adapted from Positive Airway Pressure. In Wikipedia, n.d., Retrieved May 29, 2014, from
http://en.wikipedia.org/wiki/Positive_airway_pressure. Adapted with permission.
Advances have also led to the introduction of auto-titrating devices (auto-PAP). Auto-PAP is designed to deliver minimum effective pressure (often lower than the optimal fixed CPAP) that is auto-adjusted to increase pressure as required to maintain airway patency and decrease pressure if there are no events detected over time. In doing so, auto-PAP was initially argued to increase adherence to OSA treatment and offer a solution to individuals impacted by the cost and waiting times of PSGs. However research has questioned such benefits especially in light of its utility related to reported air leaks (Berry, Parish, & Hartse, 2002; Valentin,
Subramanian, Quan, Berry, & Parthasarathy, 2011). Similarly, bi-level PAP therapy was developed with the idea of varying the administered pressure between the inspiratory and expiratory cycles. However, despite advancements in PAP technology a systematic Cochrane database review has concluded that bi-level PAP therapy was not superior to conventional CPAP therapy from an adherence standpoint (Antonescu-Turcu & Parthasarathy, 2010).
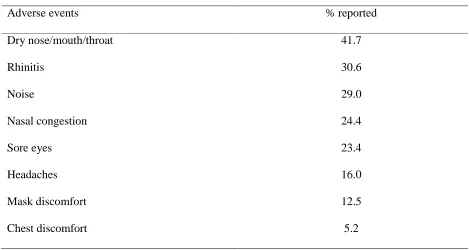
CPAP use also has a number of adverse but not serious side-effects, which can be adequately managed. These include skin sores and erosions, nasal stiffness, blocking or congestion, and discomfort due to the device itself (see Table 8). However, a large variety of commercial CPAP devices are now available with an extensive range of mask models for all shapes and forms of the human face thus minimising some of the side-effects and promoting greater comfort which leads to better ongoing usage (Berry et al., 2002; Valentin et al. 2011).
Table 8
Reports of Minor Adverse Events from CPAP
Adverse events % reported
Dry nose/mouth/throat 41.7
Rhinitis 30.6
Noise 29.0
Nasal congestion 24.4
Sore eyes 23.4
Headaches 16.0
Mask discomfort 12.5
Chest discomfort 5.2
Source: Deloitte Access Economics (2011)
Currently CPAP treatment is considered to be the most successful medical treatment available to OSA patients. Giles, Lasserson, Smith, White, Wright, and Cates (2006) and McDaid et al. (2009) conducted two separate and comprehensive reviews of the existing
CPAP treatment accounted for a significant reduction in AHI and daytime sleepiness (measured by the popular and practical Epworth Sleepiness Scale). The findings of McDaid et al.’s review mirrored those of Giles et al. (2006) in that the patients (N = 1,334) reported statistically significant reductions in sleepiness (similarly measured using the Epworth Sleepiness Scale) with CPAP use when compared to the placebo. Reduction in AHI was also reported to be statistically significant, especially amongst those with more severe OSA symptoms.
The common problem associated with CPAP treatment is adherence, which has been shown to be an issue in approximately 50% of patients (Bardwell, Berry, Ancoli-Israel, & Dimsdale, 1999; Popescu et al., 2001; Poulet et al., 2009). Adherence is generally defined as using CPAP for more than four hours nightly for up to 70% of nights (Wells, Freedland, Carney, Duntley, & Stepanski, 2007). Problems with adherence are generally attributed to negative experiences (i.e., side-effects of CPAP) and/or inconvenience, either socially or professionally (i.e., requiring assistance with adjusting the CPAP device or attending to its components) (Ballard, 2008). Promoting greater treatment adherence is an important goal, given the
prevalence of OSA in society (Greenham-Conway, 2000; Stepnowsky et al., 2002). However, clinical studies are generally performed over short periods in sleep laboratories, making it difficult to ascertain long-term adherence.
1.6.1 Issues surrounding CPAP treatment for OSA
(Bardwell et al., 1999; Popescu et al., 2001; Poulet et al. 2009). Therefore, ensuring greater CPAP adherence is an important goal of OSA research (Greenham-Conway, 2000; Stepnowsky, Marler, & Ancoli-Israel, 2002). Although there have been some publications documenting that symptoms of OSA are attenuated after relatively short periods of CPAP use, the general premise is that CPAP is a treatment and not a cure and must be applied nightly for an indeterminate period of time, perhaps lifelong. Being a self-administrated form of treatment, the efficacy of CPAP use is solely dependent on a patient’s motivation to use the device as prescribed. This poses the problem of non-adherence to long-term treatment and it is likely that short- and medium-term adherence to CPAP use is in fact far less than believed contributing to OSA morbidity and mortality (Collard et al., 1997).
interviewed and asked to complete the ESS and SAQLI only. At a follow-up four weeks later, both groups were again administered the ESS and SAQLI. To illustrate the variation in CPAP adherence, 72.9% of the treatment group returned for their follow-up, compared to 48.9% in the control group (χ2 = 5.65, p = 0.017). Wiese et al. concluded that viewing an education video at the initial stage of OSA diagnosis and treatment implementation was in fact beneficial with regard to return at follow-up. However, they found no association between viewing the video and CPAP adherence. While it is not impossible to draw firm conclusions regarding adherence from the data presented in Wiese et al.’s pilot study, it is plausible that non-adherence to CPAP
treatment may have been experienced as a result of a number of contributing factors. These could have included existing psychological problems, co-morbid illness(s), receiving poor instructions, having little ongoing support, lack of understanding, and receiving limited follow-up assistance.
In another study, Doherty, Kiely, Lawless, and McNicholas (2003) investigated the impact of CPAP treatment on the quality of life of bed partners in 55 couples where one partner had received a prior diagnosis of OSA and had commenced CPAP treatment. All couples were asked to complete the ESS, Short Form-36 health survey and the Hospital Anxiety and
Depression Scale (HADS) initially and again at the six- to eight-week mark as a follow-up. Doherty et al.’s results provided evidence that CPAP treatment assisted both patient and partners, as demonstrated via significant reductions in daytime sleepiness, overall improvement in
psychological problems may also impact on treatment adherence and commonly have been reported to include lack of motivation, claustrophobia, and anxiety (Doherty et al., 2003).
Furthermore, it is important to note that treatment can be financially draining on the patient since CPAP devices and masks are costly, and their purchase therefore places a financial strain on both the individual and health care system since few treatment options exist for OSA patients (Collard et al., 1997).
1.6.2 Determinants of CPAP adherence
Studies have commonly reported on the correlation of daily CPAP use with objective measures of OSA severity, such as the AHI, movement arousal index, and nocturnal oxygen saturation. Patients’ positive experiences at the initial titration (i.e., perceived improvement in sleep) have also been reported as factors determining subsequent CPAP usage (Drake et al., 2003). Studies have also reported finding no significant correlation between the MSLT and scores of sleepiness (using the ESS) at initial diagnosis and the subsequent use of CPAP (Pepin et al., 1999; Collard et al., 1997). This may suggest that factors relating to CPAP use are many and therefore further research is needed in this area (Pepin et al., 1999; Collard et al., 1997). It has only been within the last few decades that academics and respiratory physicians have
focussed their attention on other possible factors (i.e., psychological) that are likely to contribute to poor adherence to OSA treatment, as opposed to the traditional focus on sleep-related
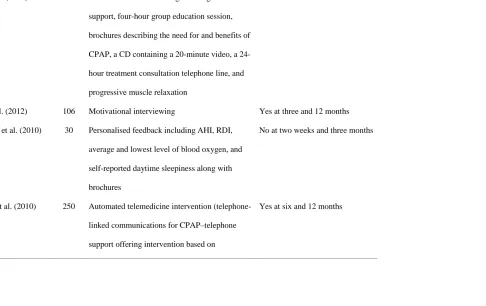
Table 9
Intervention Studies to Improve CPAP Adherence
Study Sample Intervention CPAP adherence outcome Yes/No
Wang et al. (2012) 152 Patient education involving three nights in lab
support, four-hour group education session,
brochures describing the need for and benefits of
CPAP, a CD containing a 20-minute video, a
24-hour treatment consultation telephone line, and
progressive muscle relaxation
Yes at 12 weeks
Olsen et al. (2012) 106 Motivational interviewing Yes at three and 12 months
Roecklein et al. (2010) 30 Personalised feedback including AHI, RDI,
average and lowest level of blood oxygen, and
self-reported daytime sleepiness along with
brochures
No at two weeks and three months
Sparrow et al. (2010) 250 Automated telemedicine intervention
(telephone-linked communications for CPAP–telephone
support offering intervention based on
motivational interviewing principles)
Smith et al. (2008) 97 20-minute audiotape with spoken directions for
nightly CPAP preparation and use, educational
written literature, reminder placards, and
four-week diary record of CPAP use
Yes at one month; No at three and
six months
Stepnowsky et al. (2007) 45 Telephone monitoring No at six months
Richards et al. (2007) 100 Cognitive behavioral therapy Yes at seven and 28 days
Aloia et al. (2007) 142 Motivational enhancement therapy and education
interventions
Yes at one month
Meurice et al. (2007) 112 Three educational strategies No
Golay et al. (2006) 35 Educational program/workshop involving
individual treatment goal identification,
treatment purpose discussion, and spouse
roundtable discussion
No at three months
Smith et al. (2006) 19 Telephone-delivered intervention Yes at 12 weeks
Wises et al. (2005) 100 Educational video No
Aloia et al. (2001) 12 Cognitive behavioral intervention Yes
Hui et al. (2000) 108 Video education, telephone support, and at week
one and two interaction with physician/doctor
No at one month and three months
Chervin et al. (1997) 33 Positive reinforcement No at two months
Fletcher et al. (1991) 10 Positive reinforcement No at three months
Hoy et al. (1999) 80 Intensive support involving education at home,
three nights in laboratory CPAP trial, and home
visits
1.7 Adherence
1.7.1 Terminology–compliance or adherence
As part of a global initiative launched in 2001, the World Health Organization (WHO) produced a report aimed at summarising existing information on compliance to promote discussion for the foundation of evidence-based policy making (WHO, 2003). In summary, the report estimated that half of the patients that engaged in prescribed treatment regimens did not follow them as directed (WHO, 2003). As well as exploring the reasons why patients did not comply, the report focused on the meaning of the term “non-compliance” suggesting that not following the directions for treatment may be attributed to “irrational behaviour or wilfully ignoring instructions”. Given the many reasons for “non-compliance”, present-day literature and health care professionals more commonly make use of the term “adherence” to a regimen rather than “compliance”.
According to Tilson (2004) and Ngoh (2003), the term “adherence” better reflected the diverse rationale for patients not following prescribed treatment regimes. Research by Bell, Airaksinen, Lyles, Chen, and Aslani (2007) and the United States National Institutes of Health (U.S. NIH) Office of Behavior and Social Sciences Research (2008), suggests that
The researchers at Bandolier (2004) reported that adherence to treatment regime, within this context, is improved by:
• only recommending treatments that are effective in circumstances when they are required;
• selecting treatments with lower levels of side-effects or fewer concerns for long-term use;
• prescribing the minimum number of different medications (e.g., prescribing a single antibiotic that addresses two concurrent infections);
• simplifying dosage regimen by selecting a different drug or using a sustained-release preparation that needs fewer doses during the day;
• discussing possible side-effects, and whether it is important to continue medication regardless of those effects;
• providing advice on minimising or coping with side-effects (e.g., whether to take a particular drug on an empty stomach or with food); and
• developing trust so that patients do not fear embarrassment or anger if they are unable to take a particular drug, allowing the doctor to try a better-tolerated alternative.
In the most general sense, adherence pertains to the act or process of complying with a desire, demand, proposal, or regime and is often used interchangeably with the terms
compliance, concordance, or capacitance (Ngoh, 2003). In the clinical arena, adherence generally describes the extent to which a patient correctly follows medical advice (Ngoh, 2003; Tilson, 2004). Traditionally, research in the area of adherence has focused its attentions on medication or drug adherence, but research in this field has extended its application to the use of appliances such as compression stockings, chronic wound care, self-directed physiotherapy exercises, attending counselling or other courses of therapy including that of CPAP use.
1.7.2 Adherence research
Course completion is noted as another commonly reported factor that impacts on adherence. Ngoh (2003) and the APA (2004) reported that once a patient committed to filling a prescription, they seldom followed treatment regimens as directed and rarely completed the prescribed course of treatment. Ngoh, the APA, and Elliott and Marriott (2009) attributed this to poor “health literacy”, which is defined as a misunderstanding of cost and treatment regime that together pose major barriers to accurately fulfilling treatment. According to the WHO report, this contributed to an estimated 50% of people who did not complete long-term therapy for chronic illnesses as prescribed, which potentially placed them at risk, prolonged recovery, and may have contributed to co-morbidities and potential mortality (WHO, 2003).
In order to assist patients to accurately complete prescribed treatment regimes, a variety of packaging approaches have been implemented. These have predominantly focused on promoting ease of remembering dosage as well as specific labelling aimed at increasing patient understanding of directions (Shrank, Avorn, Rolon, & Shekelle, 2007; Mahtani, Heneghan, Glasziou, & Perera, 2011).
WHO (2003) widely reports that failure to accurately complete treatment regimens as prescribed has significant negative health impacts. Examples given in this report of the rate and consequences of non-adherence for more commonly researched medical disorders include:
• hypertension non-adherence (93% in the U.S., 70% in the U.K.) as the main cause of uncontrolled hypertension-associated heart attack and stroke; and
• asthma non-adherence (28-70% worldwide) increasing the risk of severe asthma attacks requiring hospitalisation
Given that only an estimated 50% of patients suffering from chronic diseases in developed countries follow treatment regimes in part or full, further research in this area is warranted. Treatment non-adherence has the potential to have many adverse effects including complications in chronic diseases, formation of resistant infections, and untreated psychological and psychiatric illnesses that may potentially impact at an individual- and at the community-level. In accordance with the research conducted by WHO (2003), the researchers at Bandolier (2004) reported that adherence rates recorded from monitored clinical studies often differed to those reported in real-life situations, with higher adherence rates observed in clinical trials. This is illustrated by the researchers at Bandolier in a review exploring the adherence rate amongst participants prescribed with Statins (cholesterol medication). The study reported a 97%
adherence rate at the beginning of treatment, when monitored, and concluded that approximately 50% of patients were adherent after six months. Interestingly, these figures and those reported in the WHO report are in line with the adherence rate for OSA patients undertaking CPAP
1.7.3 CPAP adherence rates
In order to determine which factors contribute to CPAP adherence it is necessary to define “how much CPAP use equates to adherence” (Weaver & Sawyer, 2010, p.247). Stradling and Davies (2000) conducted a one-month, randomised, parallel, controlled study to assess the benefits of CPAP use and explored the optimal usage rates in 101 men who reported ongoing sleepiness (ESS > = 10). Fifty percent of the patients received CPAP at a sub-therapeutic level and the remaining 50% at therapeutic levels. The researchers concluded that five hours of CPAP use at the therapeutic level resulted in overall improvements in daytime sleepiness as measured by the ESS, Maintenance of Wakefulness Test (MWT), and the Energy/Vitality dimension of the SF-36 (health status questionnaire) after one month. Stradling and Davies concluded CPAP use was in fact effective in relieving symptoms of daytime sleepiness and determined that five hours a night of effective CPAP use was necessary to restore sleepiness to normal levels.
In an Australian study, Barnes et al. (2002) also conducted a randomised, controlled, cross-over study with 42 patients diagnosed with mild to severe OSA (AHI of five to 30). Patients were predominately middle-aged, overweight men (seven women and 35 men). Prior to assignment to groups, patients were administered a battery of neuro-behavioural assessments to measure memory, cognition, pre-morbid performance IQ, vigilance, and divided attention. Mood symptoms, daytime sleepiness, and quality of life were also measured. Out of the 42 patients that consented to participate in the study 28 completed both the treatment and placebo arms of the study. Outcome measures were again given after eight weeks of CPAP use and treatment with the placebo. Barnes et al. established effective CPAP use to be a mean of 3.53 hours per night, as determined by improved self-reported symptoms of OSA. However, no improvements in
1.8 Psychological Determinants of CPAP Adherence
Research investigating CPAP adherence has paid little attention to the broad range of person-centred factors that are likely to impact on CPAP treatment uptake. Historically, demographic and sleep-related variables such as age, gender, degree of daytime sleepiness, greater subjective sleepiness, poorer health, high BMI, and higher AHI, have received much of the attention (Waldhorn et al., 1990; Rolfe, Olson, & Saunders, 1991; Kribbs et al., 1993; Edinger, et al., 1994; McArdle et al., 1999; Janson, Noges, Svedberg-Randt, & Lindberg, 2000; Budhiraja et al., 2007; Joo & Herdegen, 2007). However, results have been mixed, inconclusive, or confounded by other demographic variables (Ohayon, Caulet, Philip, Guilleminault, & Priest, 1997; Wiese et al., 2005; Krishnan & Collop, 2006; Amodio, Master, Yee, & Taylor, 2008; Casale, et al. 2008). It has only been within the last three decades that factors such as mood, personality, and cognitive functioning have been investigated in relation to CPAP adherence. Many studies have concluded that further research into person-centred factors is necessary to build on existing CPAP adherence research (Kribbs et al., 1993; Engleman et al., 1994; Meurice et al., 1994; Reeves-Hoche, et al., 1994; Engleman et al. 1996; Massie et al. 1999; McAdle et al., 1999; Rosenthal et al., 2000; Peppard et al., 2000).
To date, mood has received much of the attention within this domain with mixed results reported. Guilleminault et al. (1977) paved the way for research to explore the psychological factors associated with OSA. Their study consisted of 25 men aged between 25 and 65 years old (M = 44.3): 20% were of healthy weight and the remaining 80% were classified as being