RELIABILITY AND VALIDITY TEST OF MODIFIED KNOWLEDGE MANAGEMENT ENABLERS SCALE
Dr. Ashima Chawla Ex. Asst. Prof. Management Department Aggarwal College, Ballabhgarh
ABSTRACT
The purpose of the study is to examine the reliability and validity of Modified Knowledge Management Enablers Scale developed by Lee & Choi (2003). The study involved 225 research scholars and 225 faculties’ members from nine higher educational institutions. The respondents were required to respond to a five point likert scale from strongly agree to strongly disagree. The collected data was then analyzed using the SPSS 18.0 and AMOS 18.0 software packages. An exploratory factor analysis was conducted earlier than performing a confirmatory factor analysis. All constructs revealed the acceptable internal consistency reliability and construct validity. A good model fit was found for the measurement model using several fit index tests like CMINDF, TLI, GFI AGFI, CFI, RMSEA. The findings showed that all fit indices criteria were accomplished.
Keywords: Indian Higher Educational Institutions, Modified Knowledge Management Enablers Scale, Reliability, Validity.
1. INTRODUCTION
1.1 Knowledge Management Factors Practices
Knowledge management factors are the facilitator for the institution to develop its knowledge and encourage the creation of knowledge within the institution as well as sharing, protection and efficient utilization of it. Knowledge enablers are also illustrated as influencing factors which can make achievable the knowledge management activities such as codifying and sharing knowledge assets among individuals (Chan & Chau, 2005). A variety of knowledge management enablers have been addressed in the literature. Gold, Malhotra and Segars (2001) identified three key knowledge management enabling factors such as technology, organization structure and culture.
comfortable to communicate online as compared to face to face interaction (Noor & Salim, 2011).
Organization Structure: Gan (2006) articulated that the structure of the organization impacts the ways in which organizations demonstrate their operations and it also affects how knowledge is created and shared amongst the employees. Most studies examine organizational structure from a traditional viewpoint with centralization and formalization as the two critical structural dimensions (Tata & Prasad, 2004). Centralization refers to the extent to which decision-making power is concentrated in the hands of top level of the organization. Centralization defined the locus of decision authority and control within an organizational entity whereas formularization refers to the existence of formal rules, regulations, policies and the organization's efforts to enforce those rules to be followed (Caruana, Morris & Vella, 1998). Centralization mostly creates hindrance in inter and intra departmental communication. A decentralized structure often eases the knowledge sharing and flow of knowledge in the organization. In the same way, the less formalized structure in the organization constructs the knowledge sharing and acquisition more flexible.
Organization Culture: According to Wen-bao (2008) and Robbin (2004) organizational culture is the common belief, conducts, rules and values that is shared by all organizational members. Organization culture creates a hurdle in the successful implementation of the knowledge management system. The organization must have the knowledge sharing culture which allows the individuals to have free flow of interactions with each other without any hindrance which results in new knowledge creation and innovations. In this study, two components of organization culture are measured such as Mutual trust and Collaboration.
o Mutual Trust: Trust can be defined as a degree of maintaining reciprocal or mutual faith in each other in terms of intention, behaviors and understanding (Kreitner & Kinicki, 1992). Trust may facilitate open, embodied and influential sharing of information (Nelson & Cooprider, 1996; O’Dell & Grayson, 1998). People are more willing to participate in knowledge transfer and social interactions if their relationships are based on reciprocal faith (Nahapiet & Ghoshal, 1998). Szulanski (1996) empirically found that the lack of trust among people is one of the key barriers in knowledge transfer. Davenport and Prusak (1998) stated that regardless of how firms are supported by various technologies but the knowledge management initiatives will fail if there is a lack of mutual trust among the people of the organization.
2. METHODOLOGY
2.1 Purpose
The study aims to determine the reliability and construct validity of modified Knowledge Management Enablers Scale in Indian higher educational institutions.
2.2 Participants
The sample size of the research consisted of 450 respondents. The researcher targeted 450 respondents in total, segregated it into 50 respondents from each of the nine institutions from three types of higher educational institutions i.e. IIT, traditional universities and technical universities of North India. Out of 50 respondents from each of the institution, 50 per cent were faculty members and rest of the respondents was research scholars.
2.3 Instrument
The Knowledge Management Enablers Scale developed by Lee and Choi (2003) had 36 items but the researcher used only 26 items for this study. The scale was adopted with the permission of the scale developer and it was also permitted to modify few items to be fitted and used for Indian higher educational institutions. The scale consisted of four dimensions of Knowledge Management Enablers Scale: Technology (5 items), Organization Structure (10 items), Collaboration (5 items) and Mutual Trust (6 items). The respondents were asked to rate the statements on a five point rating scale. For each statement, the following scale is being used (Strongly Agree, Agree, Indifferent, Disagree and Strongly Disagree). A score of 5 for the response of ‘Strongly Agree’, 4 for ‘Agree’, 3 for ‘Indifferent’, 2 for ‘Disagree’ and 1 for ‘Strongly Disagree’ is assigned. Each factor makes up a component of independent variables which are used to identify the knowledge management factors in higher educational institution in India.
3. RESULTS AND DISCUSSIONS
3.1 Overview
The results are presented into three parts. The first part presents outcomes of the exploratory factor analysis on Modified Knowledge Management Enablers Scale. The second part presents the outcome of confirmatory factor analysis. In the third part, reliability and construct validity values of the final scale are reported.
3.2 Exploratory Factor Analysis (EFA)
factor loading 0.492 and 0.454 respectively which is less than 0.50 so, were dropped and the cronbach alpha of Modified Knowledge Management Enablers Scale after deleted these items were 0.896. For convergent validity, the item to total correlation score was measured. Although a corrected item-total correlation value of 0.40 or greater is generally acceptable (Gliem & Gliem, 2003) whereas the value above 0.35 may also be suggested by McKelvey, W. (1967). The 6 items related to Modified Knowledge Management Enablers Scale V34,V35,V36,V37,V38 and V39 had item-to total correlation score less than 0.35 (i.e. 0.281, 0.213, 0.163, 0.229, 0.272 & 0.100) and were dropped. Table 3.4 depicts the item to total correlation score of remaining items which met the acceptable criteria of value greater than 0.35.
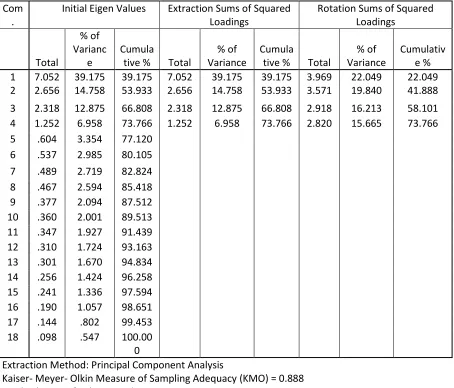
The original Knowledge Management Enablers Scale had three dimensions “Technology”, “Organization Structure” and “Organization Culture”. But here the eigen values indicated four factors explaining 73.766% of total variance. The total 4 factors are extracted out of 18 original variables with eigen values 7.052, 2.656, 2.318 and 1.252. These 4 extracted factors together account for 73.766 percent of cumulative variance. It means more than 70 percent of the information is retained to us and only 26.634 percent of information is lost (Table 3.1).
Table 3.1: Extraction of Modified Knowledge Management Enablers Scale
Extraction Method: Principal Component Analysis
Kaiser- Meyer- Olkin Measure of Sampling Adequacy (KMO) = 0.888 Bartlett's Test of Sphericity Chi- Square = 5630.241
Degree of freedom= 153, Sig. = 0.000 Source: Survey Data
Com .
Initial Eigen Values Extraction Sums of Squared Loadings
Rotation Sums of Squared Loadings
Total
% of Varianc
e
Cumula
tive % Total
% of Variance
Cumula
tive % Total
% of Variance
Cumulativ e % 1 7.052 39.175 39.175 7.052 39.175 39.175 3.969 22.049 22.049 2 2.656 14.758 53.933 2.656 14.758 53.933 3.571 19.840 41.888 3 2.318 12.875 66.808 2.318 12.875 66.808 2.918 16.213 58.101 4 1.252 6.958 73.766 1.252 6.958 73.766 2.820 15.665 73.766 5 .604 3.354 77.120
6 .537 2.985 80.105
7 .489 2.719 82.824
8 .467 2.594 85.418
9 .377 2.094 87.512
10 .360 2.001 89.513
11 .347 1.927 91.439
12 .310 1.724 93.163
13 .301 1.670 94.834
14 .256 1.424 96.258
15 .241 1.336 97.594
16 .190 1.057 98.651
17 .144 .802 99.453
18 .098 .547 100.00
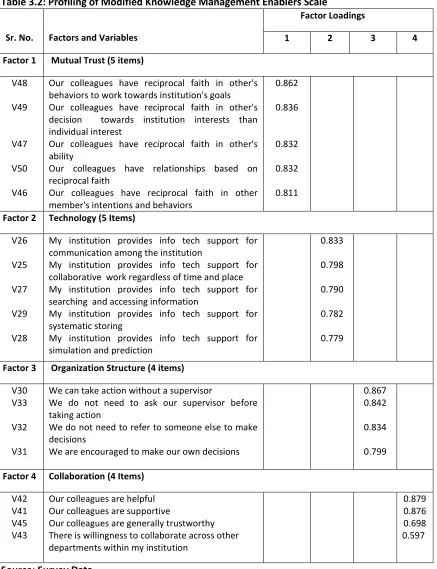
Factors were named as “Mutual Trust”, “Technology”, “Organization Structure” and “Collaboration”. Table 3.2 presents the profile of Modified Knowledge Management Enablers Scale. Nomenclature of extracted factors, the variables under each factor along with its factor loadings is illustrated in the table.
Factor 1: Mutual Trust consists of the variables (V48 Our colleagues have reciprocal faith in other's behaviors to work towards institution's goals, V49 Our colleagues have reciprocal faith in other's decision towards institution interests than individual interest, V47 Our colleagues have reciprocal faith in other's ability ,V50 Our colleagues have relationships based on reciprocal faith and V46 Our colleagues have reciprocal faith in other member's intentions and behaviors) have loading of 0.862, 0.836, 0.832, 0.832 and 0.811 on Factor 1. This suggests that Factor 1 is combination of these 5 original variables (V48, V49, V47, V50 and V46).
Factor 2:Technology is a combination of variables (V26 My institution provides info tech support for communication among the institution , V25 My institution provides info tech support for collaborative work regardless of time and place, V27 My institution provides info tech support for searching and accessing information, V29 My institution provides info tech support for systematic storing and V28 My institution provides info tech support for simulation and prediction) have factor loadings 0.833, 0.798, 0.790, 0.782 and 0.779 on Factor 2. This suggests that Factor 2 is a combination of these 5 original variables (V26, V25, V27, V29 and V28).
Factor 3:Organization Structure comprises of variables (V30 We can take action without a supervisor, V33 We do not need to ask our supervisor before taking action, V32 We do not need to refer to someone else to make decisions and V31 We are encouraged to make our own decisions) have factor loadings 0.867, 0.842, 0.834 and 0.799 on Factor 3. This suggests that Factor 3 is a combination of these 4 original variables (V30, V33, V32 and V31).
Table 3.2: Profiling of Modified Knowledge Management Enablers Scale
Sr. No. Factors and Variables
Factor Loadings
1 2 3 4
Factor 1 Mutual Trust (5 items)
V48
V49
V47
V50
V46
Our colleagues have reciprocal faith in other's behaviors to work towards institution's goals
Our colleagues have reciprocal faith in other's decision towards institution interests than individual interest
Our colleagues have reciprocal faith in other's ability
Our colleagues have relationships based on reciprocal faith
Our colleagues have reciprocal faith in other member's intentions and behaviors
0.862
0.836
0.832
0.832
0.811
Factor 2 Technology (5 Items)
V26
V25
V27
V29
V28
My institution provides info tech support for communication among the institution
My institution provides info tech support for collaborative work regardless of time and place My institution provides info tech support for searching and accessing information
My institution provides info tech support for systematic storing
My institution provides info tech support for simulation and prediction
0.833
0.798
0.790
0.782
0.779
Factor 3 Organization Structure (4 items)
V30 V33
V32
V31
We can take action without a supervisor We do not need to ask our supervisor before
taking action
We do not need to refer to someone else to make decisions
We are encouraged to make our own decisions 0.867 0.842
0.834
0.799
Factor 4 Collaboration (4 Items)
V42 V41 V45 V43
Our colleagues are helpful Our colleagues are supportive Our colleagues are generally trustworthy There is willingness to collaborate across other departments within my institution
0.879 0.876 0.698 0.597
Source: Survey Data
Collaboration. Finally, the Modified Knowledge Management Enablers Scale four factors model with 18- items were considered for confirmatory factor analysis.
3.3 Confirmatory Factor Analysis (CFA)
Confirmatory factor analysis plays the role of validating and finding the reliability of any measurement model in most social science studies (Harrington, 2009). The objective of CFA is to test whether the data fit a hypothesized measurement model. The researcher used AMOS 18.0 to perform CFA. The measurement model of Modified Knowledge Management Enablers Scale contained both observed (measured) variables and latent constructs. In order to achieve model fit, fit statistics tests like traditional chi-square test, the relative chi-square (the chi-square/degree of freedom), Tucker Lewis Index (TLI), Comparative Fit Index (CFI), Goodness of Fit Index (GFI), Adjusted Goodness of Fit Index (AGFI) and Root Mean Square of Error Approximation (RMSEA) and P Close were chosen. The acceptable criterion for traditional square is shown by non-significant result. The relative square (the chi-square/degree of freedom) must be between 2 and 5 in order to achieve the fitness of the model. The TLI, CFI, GFI and AGFI values should be in the range of 0 to 1. However, the RMSEA value should fall below 0.08 to indicate an acceptable fit to the data (Schumacker & Lomax, 2004).
In the first analysis, The CFA results showed the value of fit indices as chi square value= 511.398, df=129 and p-value=0.000, chi Square/df= 3.964, GFI=0.881, AGFI=0.843, TLI=0.918, CFI=0.931, RMSEA=0.081, P Close= 0.000. This analysis indicated poor model fit.
The suggested modifications could be drawn out by using two useful diagnostics i.e. Modification Indices (MI) and Standardized Residual Covariance which was offered by software packages and guide the data that will most probably improve the model fit (Harrington, 2009).
The MI indicates that indicated model fit would improve by freeing paths between the items of high value of MI. However, it is not acceptable to add every modification suggested into the model. It must possess some theoretical background (Simsek, 2007). In this context, this could be argued to be performed usually between items from the same factor when error covariance is added between the observed variable in the model. Moreover, when a modification is suggested there is a great decrease in the chi square value, it usually means a real improvement in the model (Child, 1990). A particular high value of Standardized Residual Covariance between two variables tells us the relationship between those variables is not well accounted for the model and one of them or both should be deleted for a better model fit.
3.3.1 Using the Model Fit Indices to Modify the Model
The AMOS output shows that MI table in which the largest MI is between e4 & e5 and e15 & e18 i.e. 72.255 & 37.337 and par change value is 0.114 & 0.232 respectively. However, e4 & e5 are on the same factor i.e. Mutual Trust and e15 & e18 are on the same factor i.e. Organization Structure that means adding up a two headed arrow between them will not damage the internal consistency of the factors. (See Figure 3.1) Though, second results from CFA shows that chi square value now reduced to 360.497, df=127 and p- value=0.000, chi Square/df=2.839, TLI=0.949, CFI=0.958, GFI=0.919, AGFI= 0.891, RMSEA=0.064 and P Close= 0.002. These results displayed a relatively better model fit when compared to previous analysis.
Collaboration4 variable will improve the model fit. Removal of Collaboration4 variable was more promising.
Table 3.3 shows the third analysis results from CFA that chi square value now reduced to 280.712, df=111 and significant at 0.000, chi Square/df=2.529, TLI=0.960, CFI=0.967, GFI=0.932, AGFI=0.906, RMSEA=0.058 and P Close=0.052 which reflect a close model fit. These values are all in good fit range and reduced model with 17 variables that best defined the model.
Table 3.3: The Results of CFA for Modified Knowledge Management Enablers Scale
Fit Statistics
Chi Square (df)
p
Chi Square/ df
TLI CFI GFI AGFI RMSEA P Close
Value 280.712 (111)
0.000 2.529 0.960 0.967 0.932 0.906 0.058 0.052
Source: Survey Data
As seen in Figure 3.1, the measurement model of Modified Knowledge Management Enablers scale specifies the relationship between observed variables and latent variables. The observed variables and the latent variables are represented by the boxes and the ellipses respectively. All loadings of items on each factor of modified Knowledge Management Enablers Scale were above 0.40 and significant. The double-headed row represents the covariance, which also can be interpreted as correlation.
Source: Survey Data and Generated by Researcher through Software
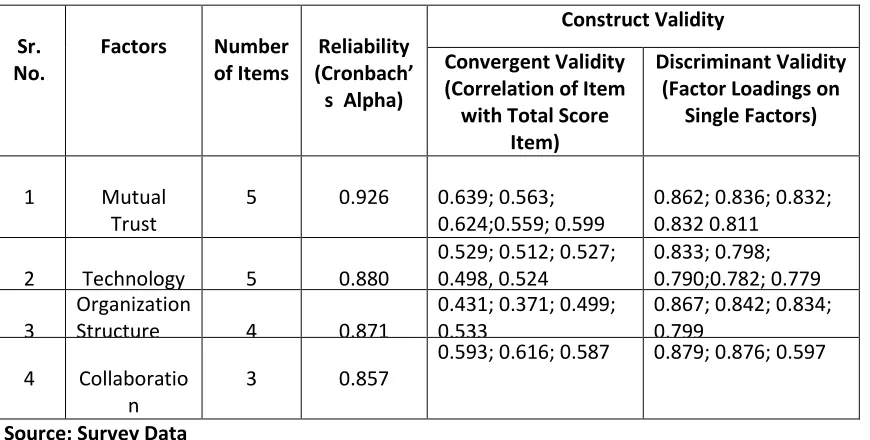
Table 3.4: Statistics for Reliability and Validity Tests for Modified Knowledge Management Enablers Scale
Sr. No.
Factors Number of Items
Reliability (Cronbach’ s Alpha)
Construct Validity
Convergent Validity (Correlation of Item with Total Score
Item)
Discriminant Validity (Factor Loadings on
Single Factors)
1 Mutual
Trust
5 0.926 0.639; 0.563; 0.624;0.559; 0.599
0.862; 0.836; 0.832; 0.832 0.811
2 Technology 5 0.880
0.529; 0.512; 0.527; 0.498, 0.524
0.833; 0.798; 0.790;0.782; 0.779
3
Organization
Structure 4 0.871
0.431; 0.371; 0.499; 0.533
0.867; 0.842; 0.834; 0.799
4 Collaboratio n
3 0.857
0.593; 0.616; 0.587 0.879; 0.876; 0.597
Source: Survey Data
Table 3.4 shows correlation of item with total score item for all the four factors which are greater than 0.40, hence the convergent validity is confirmed. A factor loading of above 0.50 proves the discriminant validity. Table 3.4 also reflects the factor loadings for each of the factors which are greater than 0.50, hence the discriminant validity is confirmed.
4. CONCLUSION
It can be seen that the Modified Knowledge Management Enablers Scale used for this research paper is highly reliable and validate for conducting the study in Indian higher educational institutions. The reliability and validity is analyzed through exploratory factor analysis and confirmatory factor analysis. This research paper is an endeavour to explore the four dimensions of Modified Knowledge Management Enablers Scale namely Mutual Trust, Technology, Organization Structure and Collaboration. The acceptable model fit was achieved since all the chosen fit statistics meet the requirement. Since all the factors have good acceptable reliability and validity value, each factor can be measured individually depending on the nature of the research.
References
1. Ahmad et al. (2009). In: Al-Gharibeh, K. M. (2011). The knowledge enablers of knowledge transfer: An empirical study in telecommunications companies. IBIMA Business Review, IBIMA Publishing. Accessed at http://www.ibimapublishing.com/ journals/IBIMABR/ ibimabr/ on 23 May 2013.
2. Caruana, A., Morris, M. H. & Vella, A. J. (1998). The effect of centralization and formalization on entrepreneurship in export firms. Journal of Small Business Management, 36(1), 16-29.
4. Child, D. (1990). In: Evrekl, E., Inel, D., Balim, A. G. & Kesarcioglu, T. (2010). A confirmatory factor analysis on the attitude scale of constructivist approach for science teachers. Bulgarian Journal of Science and Education Policy (BJSEP), 4(2), 185-201.
5. Davenport, T. et al. (1998). Successful knowledge management projects. Sloan Management Review, 39(2), 43 – 57.
6. Davenport, T. H. & Prusak, L. (1998). Working Knowledge: How Organizations Manage What They Know. Boston: Harvard Business School Press.
7. Gan (2006). In: Yap L. S., Tasmin, R., Rusuli, M. S. C. & Hashim, N. (2010). Factors influencing knowledge management practices among multimedia super corridor (MSC) organizations. IBIMA
Publishing, Communications of the IBIMA. Available at
http://www.ibimapublishing.com/journals/CIBIMA/ cibima.html
8. Gholipour, R., Jandaghi, G. & Hosseinzadeh, S. A. A. (2010). Explanation of knowledge management enabler as a latent variable: A case study of SMEs in Iran. African Journal of Business Management,4(9), 1863-1872.
9. Gliem, J. & Gliem, R. (2003). Calculating, Interpreting and Reporting Cronbach's Alpha Reliability Coefficient for Likert- Type Scales. Refereed paper presented at the Midwest Research-to-Practice Conference in Adult, Continuing and Community Education, Columbus, OH. 82-88. 10. Gold, A. H., Malhotra, A. & Segars, A. H. (2001). Knowledge management: An organizational
capabilities perspective. Journal of Management Information Systems, 18(1), 185-214. 11. Harrington, D. (2009). Confirmatory Factor Analysis. New York: Oxford University Press.
12. Hurley, R. & Hult, T. (1998). Innovation, market orientation and organizational learning: An integration and empirical examination. Journal of Marketing, 62, 42-54.
13. Kim & Lee (2004). In: Yap L. S., Tasmin, R., Rusuli, M. S. C. & Hashim, N. (2010). Factors influencing knowledge management practices among multimedia super corridor (MSC) organizations. IBIMA Publishing, Communications of the IBIMA. Accessed at http://www. ibimapublishing.com/journals/CIBIMA/cibima.html.
14. Kreitner, R. & Kinicki, A. (1992). Organizational Behavior. Homewood, ILL: Irwin.
15. Lee, H. & Choi, B. (2002). Knowledge Management Enablers, Processes, and Organizational Performance: An Integration and Empirical Examination. Ph.D. Thesis,Korea Advanced Institute of Science and Technology, Korea.
16. Lee, H. & Choi, B. (2003). Knowledge management enablers, processes, and organizational performance: An integration and empirical examination. Journal of Management Information Systems, 20, 179-228.
17. McKelvey, W. (1967). In: Saxe, R. & Weitz, B. (1982). The SOCO scale: A measure of the customer orientation of salespeople. Journal of Marketing Research, 19, 343-351.
18. Nahapiet, J. & Ghoshal, S. (1998). Social capital, intellectual capital and the organizational advantage. Academy of Management Review, 23(2), 242-266.
19. Nelson, K. M. & Cooprider, J. G. (1996). The contribution of shared knowledge to is group performance. MIS Quarterly, 20(4), 409-432.
20. Ngoc, P. T. B. (2005). An Empirical Study of Knowledge Transfer within Vietnam’s Information Technology Companies. Accessed at http://diuf.unifer.ch /is/staff/ngoct/files/ internal working paper- 10-6.pdf on 4 June, 2013.
21. Noor, N. M. & Salim, J. (2011). Factors influencing employee knowledge sharing capabilities in electronic government agencies in Malaysia. IJCSI International Journal of Computer Science Issues, 8(4).
23. O'Dell, C. & Grayson, J. (1998). If only we know what we know: Identification and transfer of internal best practices. California Management Review, 40(3), 154–174.
24. Robbin, S. P. (2004). Organizational Behavior. (11th ed). Upper Saddle River, NJ: Prentice-Hall Inc. 25. Schumacker, R. E. & Lomax, R. G. (2004). In: Maat, S. M., Zakaria , E., Nordin, N. M. & Meerah, T. S. M. (2011). Confirmatory factor analysis of the mathematics teachers’ teaching practices instrument. World Applied Science Journal,12(11), 2092-2096.
26. Simsek, O. F. (2007). In: Evrekl, E., Inel, D., Balim, A. G. & Kesarcioglu, T. (2010). A confirmatory factor analysis on the attitude scale of constructivist approach for science teachers. Bulgarian Journal of Science and Education Policy (BJSEP), 4(2), 185-201.
27. Slater, L. (2004). Collaboration: A framework for school improvement. Accessed at http://www.ucalgary.ca/~iejll/volume8/Slater5.html on 20 May, 2013.
28. Szulanski, G. (1996, Winter). Exploring internal stickiness: impediments to the transfer of best practice within the firm. Strategic Management Journal, 17, 27-43.
29. Tata, J. & Prasad, S. (2004). Team self-management, organizational structure and judgments of team effectiveness. Journal of Managerial Issues, 16(2), 248-265.