Confidence Measures in Multiclass Speech
Emotion Recognition using Ensemble Learning to
Catch Blunders
Alan Murphy Sam Redfern
PhD Candidate Lecturer
Department of Information Technology Department of Information Technology National University of Ireland Galway National University of Ireland Galway
Abstract
Although Speech Emotion Recognition (SER) systems have continually been improved with regard to outputting decisions on class membership, it is only very recently that Confidence Measures (CM) have been incorporated into such systems. It is easy to presume that classifiers such as k-Nearest Neighbor, Naïve Bayes or Support Vector Machines that can readily output numeric distributions, can therefore easily produce confidence estimates. However these numeric outputs have proven not to be well correlated with classification confidence. With this in mind the contribution of this paper is threefold, 1) providing the first successful demonstration of confidence extraction in the multiclass problem of SER by using metrics from a k-NN meta-classifier within an ensemble architecture . 2) We also demonstrate how this system has shown improvement on a similar approaches discussed later, and 3) finally we note how confidence measures can be useful as a tool for catching blunderous predictions made in SER problems, which can be very useful in real world deployed systems.
Keywords: Confidence Measures, Emotion Recognition, Ensemble Learning, Multiclass Speech Classification
________________________________________________________________________________________________________
I.
I
NTRODUCTIONPrevious research into confidence in speech classification predictions has been predominantly designed for Automatic Speech Recognition (ASR) applications and not for SER systems. Only one paper in the speech processing community has previously dealt with the latter [1]. These research endeavors utilize components such as acoustic scores and acyclic word lattices or graphs which are not archetypal components of SER systems [2] [3]. The capability to evaluate the reliability and confidence of a classifier‟s decision is a crucial aspect in all machine learning problems. This is evident from the abundance of research in the area that has been exerted into ASR systems. Our research aims to extend this notion of confidence to multiclass SER systems. Before describing our approach, we will take a look at the previous work that has been done in extracting confidence from ASR algorithms.
Jiang et al. (2005) have shown that all methods of computing confidence measures in speech recognition can be assigned into three groups [4]. In the first of these groups the aim is to calculate confidence measures by combining predictor features for better performance i.e. n-best lists, log likelihood ratios, acoustic stability and so on. These features are collected during the decoding procedure and then combined in various ways to generate a single score to indicate correctness of the recognition decision. Combination models include the use of Support Vector Machines [2] [5].
Jiang et al.‟s second group quantifies posterior word probabilities to estimate a degree of confidence in a given utterance. It is known that conventional ASR algorithms are customarily architected as a pattern classification problem, using the “Maximum a Posterior” rule to resolve the most likely word sequence that achieves the maximum posterior probability. Posterior probabilities are typically estimated from speech system acyclic graphs or N-best lists and are conveyed in the works of Kemp et al. (1997) and Wessel et al. (2001) [3] [6].
The final grouping as outlined by Jiang et al. uses utterance verification and Hidden Markov Models. This involves the recognition of keyword strings that belong to a defined model and the rejection of ones that do not. In this architecture, a Confidence Measure (CM) can be extracted through the statistical testing of two hypotheses i.e. the null hypotheses (word belongs to defined model) and the alternative hypothesis (it does not) [4]. Rahim et al. (1997) outline how likelihood ratios can then be used to quantify whether an utterance belongs to a model or not and how these ratios can be used as measures of confidence [7].
Our research deviates from that of Deng et al. (2012) above in three ways 1) by using a unique ensemble architecture designed specifically to extract confidence by fusing probability distributions, 2) by being the first to address the more problematic task of confidence mining in multiclass SER systems, rather than the binary problem of valence and 3) by doing so by using a set of metrics not yet applied to ASR or SER systems. Even though mining for confidence in multiple classes does prove to be a more problematic task than in a binary problem, it does provide a more thorough assessment of the overall confidence in SER systems. This paper provides a description of our architecture and experiments, followed by a comparison of various experimental configurations.
II.
M
ETHODOLOGYDatabases: A.
For this study, we recorded a subset of instances from the ISEAR (International Survey on Emotion Antecedents and Reactions) to perform our initial experimentation; see Scherer et al. (1994) [8]. These data consist of 7,666 sentences and snippets in which 1096 participants from 16 countries across five continents completed a questionnaire, regarding real life experiences and reactions under multiple emotional categories. The resulting dataset consisted of acted audio recorded in a studio at 16 kHz for the following six fundamental emotional categories: anger (160), disgust (160), fear (160), happiness (160), sadness (160) and surprise (130).
As proof of concept we also held back a second dataset from our initial experiments for evaluation purposes in order to assess our system‟s performance on a completely different dataset. For this second dataset we choose eNTERFACE, a widely studied speech database in the speech processing community – also studied by Deng et al. (2012) (Martin et al., 2005) [9]. This corpus consists of recordings from natives of 14 nations that listened to short stories designed to induce a particular emotion. The resulting dataset consists of induced studio recordings at 16 kHz in the emotional categories to be studied: anger (215), disgust (215), fear (215), happiness (207), sadness (210) and surprise (215).
Acoustic Features: B.
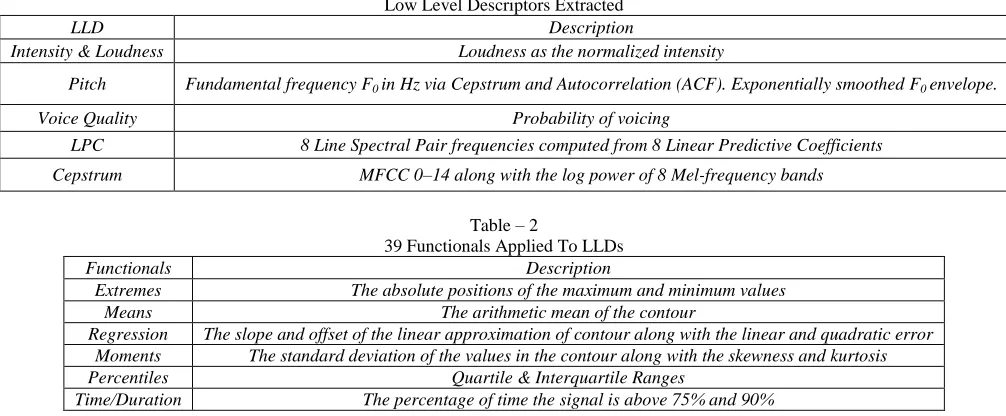
To extract the acoustic features for processing our audio instances we use the extraction engine OpenSMILE pioneered by Eyben et al. (2010) [10]. This engine provides the widely used „emobase2010‟ configuration which includes 34 Low-Level Descriptors (LLDs) along with their corresponding delta coefficients to which functionals are also applied amounting in 1,582 features in total. The LLD‟s and functionals are outlined in the Table 1 and Table 2 below.
Table - 1
Low Level Descriptors Extracted
LLD Description
Intensity & Loudness Loudness as the normalized intensity
Pitch Fundamental frequency F0 in Hz via Cepstrum and Autocorrelation (ACF). Exponentially smoothed F0 envelope.
Voice Quality Probability of voicing
LPC 8 Line Spectral Pair frequencies computed from 8 Linear Predictive Coefficients
Cepstrum MFCC 0–14 along with the log power of 8 Mel-frequency bands
Table – 2
39 Functionals Applied To LLDs
Functionals Description
Extremes The absolute positions of the maximum and minimum values
Means The arithmetic mean of the contour
Regression The slope and offset of the linear approximation of contour along with the linear and quadratic error Moments The standard deviation of the values in the contour along with the skewness and kurtosis
Percentiles Quartile & Interquartile Ranges
Time/Duration The percentage of time the signal is above 75% and 90%
Novel Hybrid Architecture: C.
Our emotion recognition system defined below is the first of its type to offer fine-grained multimodal classification of the six fundamental emotional classes. It employs three modes employing the combined techniques of 1) acoustic parameter processing 2) text processing in the form of keyword spotting and weighting, WordNet lexicons, application of heuristic rules, incorporation of common abbreviations and colloquialisms, and finally 3) text processing in the form of statistical analysis. The statistical classifiers used for both audio and text were variations of Naïve Bayes, Decision Trees and Support Vector Machines (SVMs) using Sequential Minimal Optimization (SMO). The rule based classifications were implemented based on the algorithms of [11].
Since ASR is not the focus of our research, for experimental purposes we feed audio instances along with the corresponding text. We study the output of these separate classifiers in terms of probability distributions. Delany et al. (2005) have shown how numeric outputs from probabilistic classifiers (although providing sense in their decisions) are 'estimated' probabilities and not a measure that articulate confidence [12]. Using probabilities however allows us to interpret classifier outputs, giving us more information than merely choosing the class with highest probability. In our experiments we investigate various methods of fusion to form inputs to a meta-decision level classifier, i.e. maximum probability, mean probability, the median of probabilities for a given class and finally a Bayesian updating method of fusion. It is from this meta-classifier that we extract our confidence metrics.
Confidence Metrics: D.
Delany et al. (2005) propose a number of metrics that can be used with the k-NN classifier that accurately articulate prediction confidence, this is something the standard distance output fails to achieve. These metrics have yet to be applied to SER problems and for this reason we use a k-NN classifier at our decision level and introduce the metrics (sections 2.3.1 through 2.3.4) of Delany et al. to the SER domain.
Average Nearest Unlike Neighbour: 1)
The Average Nearest Unlike Neighbour Index is a measure of how close the first k NUNs are to the target instance t and is given in Equation 1.
k t IndexofNUN k t x AvgNUNInde k i i
1 ()
) ,
( (1)
IndexOfNUNi(t) is the index of the ith Nearest Unlike Neighbour (NUN) of the target instance t. By index we mean the ordinal ranking of the example in the list of neighbours.
Similarity Ratio: 2)
The Similarity Ratio metric computes the ratio of the similarity between the target instance t and its k Nearest Like Neighbours (NLN) to the similarity between the target instance and its k NUNs. It is given in Equation 2.
k i i k i i e t NUN t Sim e t NLN t Sim k t SimRatio 1 1 )) ( , ( )) ( , ( ) ,( (2)
Sim(a, b) in this metric is the calculated similarity between instances a and b. Here e is a smoothing value to account for examples that have no NLNs or NUNs (e = 0.001 was used in all of our calculations)
Similarity Ratio within K: 3)
The Similarity Ratio Within K is similar to the Similarity Ratio as described above except that, it uses only the NLNs and NUNs from the first k neighbours. It is defined in Equation 3.
k
i i tNN t
k
i i t NNt
i i t NNN t Sim e t NNN t Sim k t SimRatioK
1 , ()
1 , ()
) 1 ))( ( , ( )) ( , ( ) , ( (3)
Here Sim(a, b) is the same as above and δab is Kronecker‟s delta where δab = 1 if the class of a is the same as the class of b and 0 otherwise. Again e is a smoothing value to account for situations that may have no NUNs among its k nearest neighbours (e = 0.001).
In extracting confidence information from any classifier both Delany et al. (2005) and Deng et al. (2005) agree that a combination approach is generally best in describing the reliability of a prediction using individual components [7][12]. Both argue that this approach can greatly improve the overall performance of the metrics in measuring confidence. Delany et al. (2005) experimentally show how none of the individual measures are consistently effective at predicting confidence, and they therefore define an accumulation approach [12].
Accumulated Confidence Measure: 4)
Delany et al.‟s Accumulated Confidence Metric (ACM) is determined by assigning confidence to a prediction if any of the three individual measures reveal confidence. In order to achieve this, calculation of the individual thresholds per class must be computed on training data in a pre-classification stage and then the ACM is determined during classification.
III.
E
XPERIMENTATION&
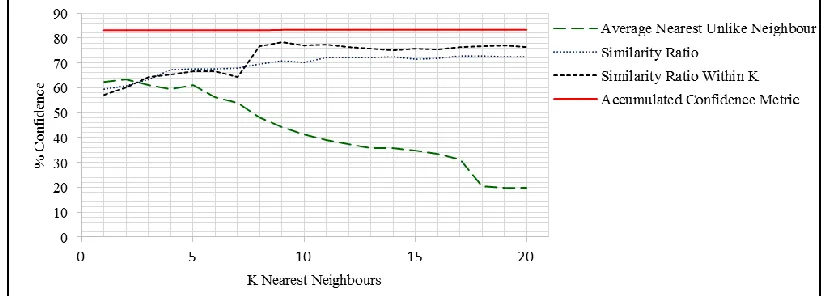
RESULTSOur experiments aim to compare the results of a variety of data fusion techniques in terms of both accuracy and confident results. By fusing the probability distributions of our base classifiers we are creating instances for our k-NN meta-classifier. Working on our training data our thresholds per class are programmatically determined for each k ∉ {1…20} searching for the value of k that maximizes confidence while having zero confident false positives. Once training is complete and the optimum ks and thresholds that maximize confidence are determined, we run our test cases and declare a confident result if any of the three metrics indicate confidence. Figure 1 below illustrates how each metric performs on the ISEAR dataset when we fuse probabilities by their mean. The linear nature of the ACM reveals how confidence is declared if any of the metrics reveal confidence. We can therefore see that for any value of k at least one of the metrics reveal confidence for 83.17% to 83.33% of instances.
Fig. 1: Performance of All Confidence Metrics When We Use a Mean/Average To Fuse Base Classifier Probabilities Table – 3
Joint table comparing results for the ISEAR dataset (top) and the evaluation eNTERFACE dataset (bottom) Fusion Accuracy Blunders Confidence Confidence Accuracy
Mean 93.83% 2.67% 83.33% 97.60%
93.56%
Max 78.66% 4.33% 64.67%
Median 92.00% 2.83% 77.33% 97.63%
Bayesian 92.83% 2.00% 81.33% 98.57%
Fusion Accuracy Blunders Confidence Confidence Accuracy
Mean 91.00% 1.83% 85.83% 98.64%
Max 78.50% 2.83% 65.67% 94.16%
Median 88.83% 2.67% 78.17% 98.72%
Bayesian 90.66% 1.50% 79.67% 99.58%
probabilities showing the highest classification confidence of 85.33%. We also note that the Bayesian fusion method performs as good as the mean approach. Even though the reported confidence is slightly less we can see that the reported confidence error is also less. It is therefore beneficial to take into account classifier accuracy, confidence accuracy and confidence error in selecting an optimum SER architecture.
In order to convey confidence as a single number metric using this setup we propose Equation (4) which scales a given confidence metric x based on the maximum recorded value for that metric and the defined confidence threshold for the predicted class. The T value here refers to the number of confidence metrics used. Using this technique we managed to achieve up to 0.8146 confidence for unseen test instances in the eNTERFACE evaluation set – an improvement on the 0.7950 reported by Deng et al. (2012) in their binary approach using this set.
T i
i i
xi i
x T x T
thres x M
C
A 1
) (min ) .(max ~
(4)
Finally it can be seen in Table 3 above that each of the methods of fusion specifically the mean, median and Bayesian methods have a high confidence accuracy, that is to say any time confidence is assigned to a prediction it is correct on average 97.30% of the time across both datasets studied. This table also shows an average of 2.58% of blunderous predictions across both sets. Given this very high confidence accuracy rate and the very low blunder rate our results did not reveal one blunderous prediction that was assigned confidence. These results therefore indicate that there is credence in using a confidence component to serve as a worthwhile aid in providing further information blunderous predictions in SER systems.
IV.
C
ONCLUSIONSWe have described the first successful demonstration of confidence extraction in the multiclass problem of SER. By treating the problem as multiclass rather than binary we are able to show a more fine grained result and therefore a more detailed understanding of both classification and confidence in SER systems. We have also experimentally optimized this system so that it yields both the best possible accuracy and the best possible confidence in its predictions. Furthermore we have demonstrated how our system has shown improvement on a previous binary approach and finally we note how confidence measures can be useful as a tool to catch blunderous predictions in SER problems. This research achieved the above by adopting metrics which are original to the fields of both ASR and SER and showed how useful these metrics can be, hopefully inspiring the community to apply them elsewhere.
A
CKNOWLEDGEMENTSThe authors would like to acknowledge the advice of both Michael Madden and Colm O Riordan of the Discipline of Information Technology in the National University of Ireland Galway in carrying out this research.
R
EFERENCES[1] Jun. Deng, Wenjing. Han and Björn. Schuller, "Confidence Measures in Speech Emotion Recognition Based on Semi-supervised Learning", In proceeding of INTERSPEECH 2012, pp. 2226–2229, 2012.
[2] R. Zhang and A.I. Rudnicky, "Word level confidence annotation using combinations of features", Proc. of European Conference on Speech Communication Technology, 2001.
[3] T. Kemp and T. Schaaf. Estimating confidence using word lattices. Proc. Eurospeech, 2:827–830, 1997.
[4] H. Jiang, “Confidence measures for speech recognition: a survey,” Speech Communication, vol. 45, no. 4, pp. 455–470, 2005.
[5] R.A. Sukkar, “Rejection for connected digit recognition based on GPD segmental discrimination”, Proc. of International Conference on Acoustics, Speech and Signal Processing, pp. I-393–I-396, 1994
[6] Frank. Wessel, Ralph. Schlueter, Klauss. Macherey and Hermann. Ney, "Confidence measures for large vocabulary continuous speech recognition", IEEE Transactions on Speech and Audio Processing, 9(3), 288 –298, 2001.
[7] M. Rahim, C. Lee, and B. Juang, “Discriminative utterance verification for connected digits recognition,” Speech and Audio Processing, IEEE Transactions on, vol. 5, no. 3, pp. 266–277, 1997.
[8] K. R. Scherer and H.G. Wallbott, "Evidence for universality and cultural variation of differential emotion response patterning", Journal of Personality and Social Psychology, vol. 66, pp. 310-328, 1994.
[9] O. Martin, I. Kotsia, B. Macq and I. Pitas, "The eNTERFACE05 Audio-Visual Emotion Database", IEEE Workshop on Multimedia Database Management, 2005
[10] Florian. Eyben, Martin. Wöllmer, Björn. Schuller: "OpenSMILE - The Munich Versatile and Fast Open-Source Audio Feature Extractor", Proc. ACM Multimedia (MM), ACM, Firenze, Italy, 2010.
[11] U. Krcadinac, P. Pasquier, J. Jovanovic, V. Devedzic, "Synesketch: An Open Source Library for Sentence-Based Emotion Recognition”, IEEE Transactions on Affective Computing, vol.4, no.3, pp.312-325, 2013