Hybrid Energy Optimization Using Cost
Function Evaluation with Bio Gas
Shivakumar Kadakol1, Sujatha B.C2
PG Student [Power and Energy System], Dept. of Electrical Engg, UVCE, Bangalore, Karnataka, India1 Associate Professor, Dept. of Electrical Engg, UVCE, Bangalore, Karnataka, India2
ABSTRACT: This paper is an attempt to develop an optimization method, which would include the Biogas power generation to be integrated with the hybrid power generation system, which includes the wind, (PhotoVoltaic) PV and micro-hydro power generation system. Considering cost function as the objective function, this solution carries out the optimization of the composite system, which comprises the hybrid power generation system. The formulation of the cost function for this hybrid system is developed; the cost function includes the fuel cost, maintenance and operating cost of the hybrid system. While for renewable energy sources the capital recovery cost is considered and obviously fuel cost is not considered. Using both the PI controller and Fuzzy controller, cost optimization is carried out. Matlab /Simulink based hybrid system is developed and optimized for both the methods and is found that the Fuzzy optimization is dominant while considering both the methods for comparison.
KEYWORDS: Hybrid Power Delivery, Power Delivery Optimization, Fuzzy Logic,Biogas Power generation
I.INTRODUCTION
Distributed generation and hybrid energy is the need of the hour and thus an optimization of these hybrid power energy systems is developed for past two decades. The literature [1] discusses about the PV integration and also the active power factor correction using the active power filter. A Fuzzy control is applied in the voltage regulation of the DC link voltage for optimized power supplied to the load. In [2] an off grid house is considered for the hybrid power supply to be supplied to it and in order to replace the fossil fuel based power supply. The economic involved in the hybrid of PV and Biogas based supply is calculated and the extra power is supplied to the grid. In[3]the hybrid energy, which is supplying both the wind and the hydropower, is developed and proves that the voltage stability and load balancing is up to the expectation i.In [4]the hybrid system with wind, hydro and PV is combined and analysed for the harmonic level in the power delivery.The harmonic levels suggest that the hybrid power generation with the renewable energy included would be a alternative to the conventional power generation systems.In[5] India’s perspective the Rajiv Gandhi Gramin Vidyutikaran Yojana is the prime program for the rural electrification in India. The amount of renewable power generation in India is 57.472 GW until June of 2017. In that total power 61% is from wind and 19% from solar and rest of them are from other sources. Thus the usage of the renewable energy is growing every year, the importance of the hybrid power and optimization is a must in the current situation. The optimization would be always in the economics of the power generation, either it is the power losses or the cost of generation.
Vol. 6, Issue 9, September 2017
II. OBJECTIVE FUNCTION FOR POWER DELIVERY OPTIMIZATION
The objective function is the cost function, which is defined in terms of the power generated in each of the power sources. The calculation of the cost is defined by the following formula,
C
=
r
(1
+
r
)
n
(1
+
r
)
n-
1
é
ë
ê
ù
û
ú
P
87.6
k
é
ë
ê
ù
û
ú +
[
o
&
m
]
………. (1)Where,
C
is the cost of energy,n
is the Amortization period (in years),[
o
&
m
]
is the operation and maintenance cost,P
is the power delivered by each generation unit,r
is the fixed annual interest andk
is the annual capacity factor.Considering PI and Fuzzy controller, which is supplying the amount of voltage to the grid, carries out the optimization. The optimized power delivery, which would increase the amount of energy that is fed to the grid, is the criteria for the controllers that control the voltage input to the grid side converter. PI and Fuzzy controller, which controls the voltage level to the grid, is discussed and the results that would define the power delivery from the hybrid system is realized.
III. HYBRID POWER DELIVERY OPTIMIZATION
The voltage regulation at the Voltage Source Converter (VSC) that would control the power delivery to the grid is the heart of the optimization in the hybrid power delivery system. The hybrid power grid is developed by the mathematical modelling of the PV system, Wind Energy Conversion system (WECS),MicroHydropower system and the Bio gas model. The mathematical model of the PV, Wind and the micro hydro systems are defined in literature [4]. The Bio gas model is recently introduced which is defined as the following.
The amount of manure obtained from the livestock is as given by equation(2),
M
=
N
im
in=1
i
å
………...(2) where,M
is the amount of manure gathered in the remote area,N
i is the population of thei
th group livestock producing that particular manure,m
i is the manure produced per head in a year by thei
th group livestock as discussed in [7]. The production of biogas from the manure would be given in the equation (3) as discussed in the literature [8].V
B=
N
in=1
i
å
m
i.
K
Dmi.
K
omi.
V
Bi……… (3) whereK
Dmi is the dry matter content in the manure,K
omi is the organic matter in the manure ,V
B is the biogas volume in terms ofm
3 andV
Bi is the volume of gas, fori
th group livestock.The Energy potential produced formula for the biogas is given below in equation (4).
E
g=
N
in=1
i
å
m
i.
K
Dmi.
K
omi.
V
Bie
bi………..(4) whereE
gis the energy potential in KWh,e
bi is thei
th group specified heat energy content for the biogas from the manure.voltage at the voltage source converter, which connects the grid, carries out the optimization of the power delivered from the hybrid power system.
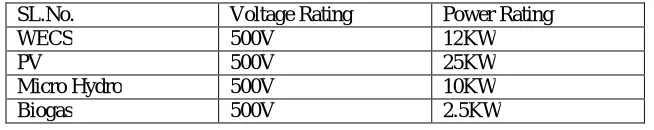
The power delivered by each of the voltage source is used in the equation (1) to get the cost of the hybrid power delivery system. The PI and Fuzzy controller used regulates the voltage by controlling the Pulse Width Modulation (PWM) in the voltage source converter that is connected to the grid. The rating of the power generation systems isgiven in the Table 1 below.
SL.No. Voltage Rating Power Rating WECS 500V 12KW PV 500V 25KW Micro Hydro 500V 10KW Biogas 500V 2.5KW
Table 1. Rating of the Different Power Generation System
The block diagram of the voltage regulation applied for the VSC is as shown in the Figure1. The voltage at the Point of Common Coupling (PCC) is measured and is compared with the reference voltage and the difference is given to the PI controller to generate the reference current from the difference in voltage.
Figure 1. Overall Block Diagram Of Optimization of Hybrid Power Delivery System
The PI controller constants for the optimization is Kp=7 and Ki=800. And while using the Fuzzy controller the fuzzy rules were created for the input error and change in error with seven membership functions for each of the two variables. Forty-nine Fuzzy rules that is generated for the optimization of the power delivery is as given below in Table 2.
Input Error/Change in Error
MF1 MF2 MF3 MF4 MF5 MF6 MF7 MF1 MF1 MF1 MF1 MF4 MF4 MF4 MF4 MF2 MF5 MF1 MF1 MF1 MF1 MF1 MF4 MF3 MF4 MF3 MF1 MF1 MF1 MF1 MF4 MF4 MF4 MF4 MF7 MF2 MF1 MF1 MF4 MF5 MF1 MF1 MF4 MF4 MF7 MF3 MF1 MF6 MF3 MF1 MF4 MF4 MF7 MF3 MF1 MF7 MF4 MF4 MF4 MF4 MF7 MF7 MF7
Table 2. Fuzzy Rules for the Optimization of Power Delivery System Voltage Measured at the
DC link(PCC)
Voltage Reference to be maintained at the PCC.
Difference of the Voltages
PI /Fuzzy Controller
Vol. 6, Issue 9, September 2017
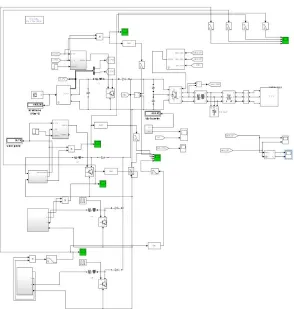
IV.SIMULINK MODEL, RESULT AND DISCUSSION
Fig.2 Simulation of the PV, wind, micro-hydro power plant and bio-gas power system
Case1: Optimization Using PI controller results
Fig.3 PV, Wind, Hydro and Bio-gas generated power Fig.4 PV, Wind, Hydro and Bio-gas power cost in $
Fig.5 Voltage in V and current in A Fig.6 Power in wattage and Reactive Power in var
Case2 :Optimization Using Fuzzy Controller
Fig.7 shows the simulation diagram and fig 8 shows the PV, wind, hydro and bio-gas power generated in wattage. Fig. 10 shows the PV, wind, hydro and bio-gas power generated cost in $, Fig. 9 shows the stable voltage and current at grid side and fig.10 shows the real power and reactive power. It shows the real power of ~44 kw after adding fuzzy controller. Reactive power is zero at average.
Fig.7 PV, Wind, Hydro & Bio-gas generated power Fig.8 PV, Wind, Hydro and Bio-gas generated power cost in $
0 0.5 1 1.5 2 2.5 3
0 2
4x 10
4 PV power in wattage
0 0.5 1 1.5 2 2.5 3
0 1
2x 10
4 Wind power in wattage
0 0.5 1 1.5 2 2.5 3
0 1
2x 10
4 Hydro generator power in wattage
0 0.5 1 1.5 2 2.5 3
0 2000 4000
Time in Sec
P o w e r in w a tt a g
e Bio-Gas power in wattage
0 0.5 1 1.5 2 2.5 3
0 1
2x 10
6 PV cost curve
0 0.5 1 1.5 2 2.5 3
0 1
2x 10
6 Wind Power Cost
0 0.5 1 1.5 2 2.5 3
0 2
4x 10
6 Hydro Power Cost
0 0.5 1 1.5 2 2.5 3
0
5x 10
6
Time in Sec
C o s t in $
BIo-Gas power Cost
1.15 1.2 1.25 1.3 1.35 1.4 1.45 -4
-2 0 2
x 104 Va (V)
0.62 0.64 0.66 0.68 0.7 0.72 0.74 0.76 0.78 0.8 0.82 -6 -4 -2 0 2 4
Time in Sec
V a b c i n V o lt s a n d I a b c i n A Ia (A)
0 0.5 1 1.5 2 2.5 3
-4 -2 0 2x 10
5
X: 0.7066 Y: 4.236e+04
P in watt
0 0.5 1 1.5 2 2.5 3
-4 -2 0 2x 10
5
Time in Sec
P o w e r s e n d t o g ri d ( P a n d Q
) Q in VARS
0 0. 5 1 1. 5 2 2.5 3
0 5 10 15x 10
5
PV cost curve
0 0. 5 1 1. 5 2 2.5 3
0 5 10 15x 10
5
Wind Power Cost
0 0. 5 1 1. 5 2 2.5 3
0 1 2 3x 10
6
Hydro Power Cost
0 0. 5 1 1. 5 2 2.5 3
0 2 4 6x 10
6
Time in Sec
C o s t in $
Vol. 6, Issue 9, September 2017
Fig.9 Voltage in V and current in A Fig.10 Power in wattage and Reactive Power in var
VI.CONCLUSION
The Mat lab implementation for the power delivery optimization is carried out and the results are tabulated and observed for performance improvement. The PI and the Fuzzy controller thus implemented in the hybrid power delivery system has proved that the power delivery due the optimization is increased. And in the two controllers that is used Fuzzy is performing better by delivering around 4% more power as delivered by optimizing using PI controller. The per watt cost of the total hybrid power delivery system would get decreased as there is no change in the capital or operation and maintenance cost increase while there is a increase in the power delivery when thefuzzy controller is used.
REFERENCES
[1] PradeepAnjana et al,”PV Source Integrated Micro-Grid for Power Quality Improvement “Transmission and Distribution Conference and Exposition (T&D), 2016 IEEE/PES
[2] SmrutiRanjanPradhan etal,“Design of Standalone Hybrid Biomass & PV System of an Off- Grid House in a Remote Area”, SmrutiRanjanPradhan et al Int. Journal of Engineering Research and Applications, ISSN : 2248-9622, Vol. 3, Issue 6, Nov-Dec 2013, pp.433-437 [3] Gagari Deb et al, “Hybrid Power Generation System”, International Journal of Computer and Electrical Engineering, Vol.4, No.2, April 2012 [4] G. Lakshmi et al,”Hybrid solar-wind-hydro renewable energy system “Published by World Academic Press, World Academic Union [5] https://en.wikipedia.org/wiki/Renewable_energy_in_India
[6] RadharamanShaha ,”Optimization ofRenewable Energy Sources for Hybrid Power Generation”, Bienniallnternational Conference on Power and Energy Systems:Towards Sustainable Energy (PESTSE) ,2016.
[7] Connected Hybrid PV Wind Energy System." IJEST Vo!.3 NO.5 May 2011 PP: 4296-4323. [8] A.K. Akella.," Sizing and Cost Analysis for lntegrated Renewable Energy System in a Study Area".
0.95 1 1. 05 1.1 1. 15
-2 -1.5 -1 -0.5 0 0.5 1 1.5
x 104 Va (V)
0 0.5 1 1.5 2 2.5 3
-15 -10 -5 0 5 10 15
Time in S ec
V a bc in V o lt s a n d I ab c in A Ia (A)
0 0.5 1 1.5 2 2.5 3
-3.5 -3 -2.5 -2 -1.5 -1 -0.5 0 0.5 1 1.5x 10
5
X: 0.7061 Y : 4.394e+04
P in watt
0 0.5 1 1.5 2 2.5 3
-2.5 -2 -1.5 -1 -0.5 0 0.5 1x 10
5
Time in Sec
Po w e r s e n d t o g ri d ( P a n d Q )