ISSN (Print) : 2320 – 3765
ISSN (Online): 2278 – 8875
I
nternational
J
ournal of
A
dvanced
R
esearch in
E
lectrical,
E
lectronics and
I
nstrumentation
E
ngineering
(An ISO 3297: 2007 Certified Organization)
Vol. 3, Issue 7, July 2014
DOI: 10.15662/ijareeie.2014.0307011
GPS
Interfacing of Banediya Feeder (M.P)
Using MI Power Software
Swati Paliwal1, V.K Tayal2, H.P Singh3
Assistant professor, Department of Electrical & Electronics Engineering, Northern India Engineering College, Delhi, India1
Assistant professor Department of Electrical & Electronics Engineering Amity University U.P , Noida India2, Professor, Department of Electrical & Electronics Engineering Amity University U.P, Noida India3,
ABSTRACT:In the supplying energy chain distribution networks make up the last link . For the transmission systems
which feed through distribution substations usually have larger density as well as complexity. In this paper the traditional load flow studies for the 11 KV Banediya feeder which is situated Madhya Pradesh are employed for existing feeder and future distribution systems through the Mi Power software using GPS interfacing. Under this technical analysis 11 KV high tension line is furnished with 24 transformers of low tension line onto which load flow studies is performed which show that the results of losses are not as per the current norms of distribution system considering line length, capacity/conductor type and loading conditions. By using different improvements like
transformer loading and resizing, change in conductor and Var compensation,for distribution networks the present load
flow approach is formulated as a probabilistic power flow which takes benefit of telemeter variables and the radial nature of distribution circuits.A capital expenditure is also to be considered to make the system techno-economically
feasible after considering improvements in the system.
KEYWORDS:GPS, Banediya feeder, Mi Power software, Var compensation, Rabbit cable, coyote cable.
I.INTRODUCTION
Technical analysis for the 11KV, Banediya feeder in Madhya Pradesh is furnished with 24 transformers altogether with load on low tension side of the transformers having voltage 0.415kv.The geographical digitized diagram of the 11 KV, Banediya feeder along with LT network of 0.415KV line consisting of 24 transformer rated between 25KVA, 63KVA, 100KVA, 200KVA considering 100%, 80%, 50% loading condition together with MVAr compensation is furnished in this paper. The Software is used for technical analysis are Map sourcing for interfacing GPS coordinates and Mi Power for the purpose of Load Flow Studies during different loading conditions and for MVAr compensation.
1.1 INTERFACING OF BANEDIYA FEEDER GPS COORDINATES IN MI POWER SOFTWARE
GPS: The Global Positioning System (GPS) is a space-based satellite navigation system that
provides location and time information in all weather conditions, anywhere on or near the Earth where there is an unobstructed line of sight to four or more GPS satellites.
Steps involved in field survey of 11kV Feeder using GPS instruments
Identification of particular 11kV feeder of substation.
GPS point will be captured of each pole/DTCs of that feeder.
ISSN (Print) : 2320 – 3765
ISSN (Online): 2278 – 8875
I
nternational
J
ournal of
A
dvanced
R
esearch in
E
lectrical,
E
lectronics and
I
nstrumentation
E
ngineering
(An ISO 3297: 2007 Certified Organization)
Vol. 3, Issue 7, July 2014
DOI: 10.15662/ijareeie.2014.0307011
Filling up the given format (which contains asset data of every pole & noting down technical deficiencies).
Exporting the device data to notepad/text files.
Interface the text files into Mi Power Software to generate the network.
Simulate the given network and get the esired outputs,
Improve the network as per the results.
Fig.1 Snapshot of GPS Interfacing in Mi power software
Fig.1.shows the snapshot of GPS interfacing in Mi power through which the GPS interfacing as well as the different parameters has been selected.
II.TECHNICALANALYSISOFBANEDIYAFEEDERLOADFLOWSTUDIES
NEEDFORLOADFLOWANALYSIS
One of the most common computational procedures used in power system analysis is load flow study. The planning, design and operation of power systems requires such calculations to analyse the steady-state performance of the power system under various operating conditions and to study the effects of changes in equipment configuration.
The load flow study, in general determines: 1.Component or circuit loadings
2.Steady-state bus voltages 3.Reactive power flows 4.Transformer tap settings 5.System losses
6.Performance under emergency conditions levels.
ISSN (Print) : 2320 – 3765
ISSN (Online): 2278 – 8875
I
nternational
J
ournal of
A
dvanced
R
esearch in
E
lectrical,
E
lectronics and
I
nstrumentation
E
ngineering
(An ISO 3297: 2007 Certified Organization)
Vol. 3, Issue 7, July 2014
DOI: 10.15662/ijareeie.2014.0307011
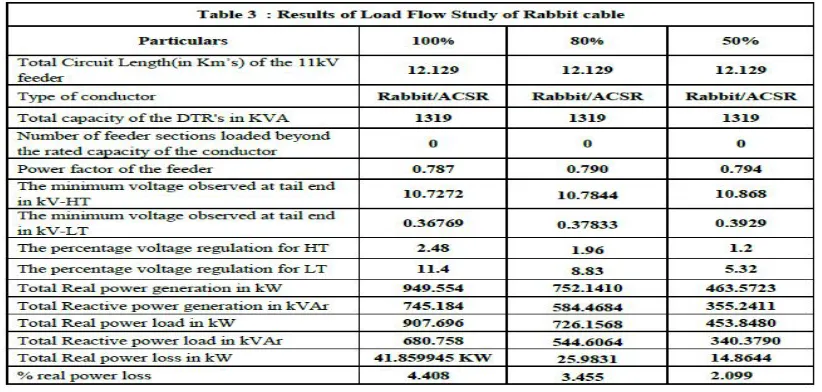
LOAD FLOW ANALYSIS OF THE 11 kV, Banediya FEEDER and LT 0.415KV using Load flow study
Table 3 shows the results of load flow study for a cable which is rabbit in nature which has been selected through Mi power software.
III.RESTRUCTURINGOFTHESIMULATIONMODELTOBRINGIMPROVEMENTSINTHEEXISTING
SYSTEM
In order to restructure the existing Banediya Feeder System we need to achieve the following objectives.
I. Transformer loading and Resizing-As per normal conditions a transformer is not loaded not more than
50%. Transformer will generally have an overloading capacity of 200% (double their rating) but these conditions are avoided by load shedding. As per the latest distribution norms in Madhya Pradesh an agricultural feeder is given a supply of 6 hrs and a domestic consumer is given 24 hrs supply. The reason being that agricultural if they are told to use 10 HP motor, 100 HP motor will be used and to avoid the transformer failures.
II. VAR compensation- As we all aware that reactive power neither consumes nor supplies energy. This
reactive power is a quantity which is measured in volt-ampere reactive or VARs. As the length of a line increases, its inductive reactance increases, and the more capacitive reactive power needed to offset the effect and to maintain adequate voltage.
III. Transformer relocation / restructured- Also known as DTC relocation. In such cases either the transformer
of lower capacity will be replaced by a higher one or might be replaced by the desired one. For instance if the load demand is 60 kW it is feasible to put a100kVA transformer and not 200 kVA because the balance 100 kVA will not be used. More higher rating of the transformer more the heat losses. Similarly for 125 kW a 100 kVA transformer is not feasible so need to change the desired rating.
IV. Changing the conductor size / type of feeder- Changing the feeder effectively reduces the loading on the
ISSN (Print) : 2320 – 3765
ISSN (Online): 2278 – 8875
I
nternational
J
ournal of
A
dvanced
R
esearch in
E
lectrical,
E
lectronics and
I
nstrumentation
E
ngineering
(An ISO 3297: 2007 Certified Organization)
Vol. 3, Issue 7, July 2014
DOI: 10.15662/ijareeie.2014.0307011
IV.IMPROVEMENTS
I. Changing the type of Cable: A rabbit cable can carry a maximum 3.5MVA and coyote cable can carry
up to 6.8 MVA. Hence by using the coyote cable it should be beneficial from the point of improvements. Hence for changing the cable we should first go to Distribution analysis in tools of Mi Power.
Fig 2.Changing in cable Fig 2 shows the improvement in feeder by changing the type of cable
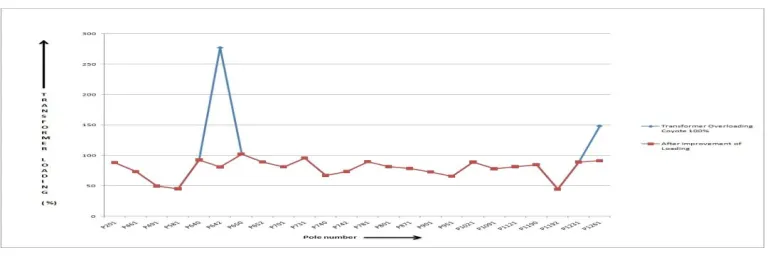
II. Transformer relocation / restructured: As we can see from the current graph that at Pole number 642
and Pole number 1261 there is a condition of overloading and by resizing the transformer the overloading would lead to balance load under normal conditions
Fig 3.Graph of overloading condition
Fig 3 shows the improvement through transformer relocation/restructured through which feeder analysis has been improved.
III. VAR compensation: VAR Compensations are done for improving the voltages at the buses. Now since
ISSN (Print) : 2320 – 3765
ISSN (Online): 2278 – 8875
I
nternational
J
ournal of
A
dvanced
R
esearch in
E
lectrical,
E
lectronics and
I
nstrumentation
E
ngineering
(An ISO 3297: 2007 Certified Organization)
Vol. 3, Issue 7, July 2014
DOI: 10.15662/ijareeie.2014.0307011
Case:1 100% Loading Condition
Fig 4. Comparison in Percentage losses of 100% loading and MVar condition Fig 4.shows a comparison in percentage losses for 100% loading and MVar condition for improvements
Case 2: 80% Loading Condition
Fig 5. Comparison in Percentage losses of 80% loading and MVar condition Fig 5. Shows a Comparison in Percentage losses of 80% loading and MVar conditions for improvements
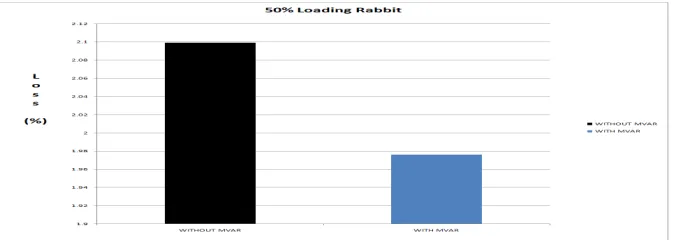
Case 3: 50% Loading Condition
ISSN (Print) : 2320 – 3765
ISSN (Online): 2278 – 8875
I
nternational
J
ournal of
A
dvanced
R
esearch in
E
lectrical,
E
lectronics and
I
nstrumentation
E
ngineering
(An ISO 3297: 2007 Certified Organization)
Vol. 3, Issue 7, July 2014
DOI: 10.15662/ijareeie.2014.0307011 Fig 6.shows a Comparison in Percentage losses of 50% loading and MVar conditions for improvement
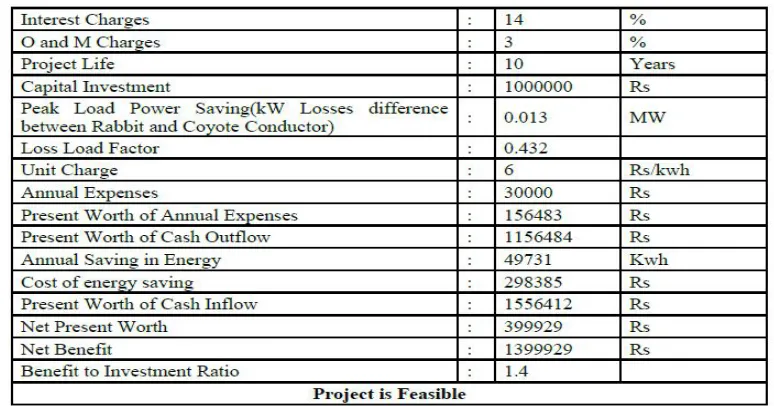
V.CAPITALEXPENDITUREPLAN
Table shows a capital expenditure plan which is required for analysis of feeder analysis
VI.CONCLUSION
With the help of Mi Power software and doing a simulation on the existing network of 11 kv we conclude that losses are not as per the current norms of distribution system considering line length, capacity/conductor type and loading
conditions.Here with the help of transformer loading and resizing we are balancing the overloading conditions at two
different poles location, which happened due to excessive loads and through the change in conductor from rabbit cable to coyote cable we are improving the voltage profile. With the help of VAr compensation we are improving the voltage profile as well as the losses present in the system.
A capital expenditure is also to be considered to make the system techno-economically feasible after considering some
improvements in the system. The most essential difficulty to solve, in order to carry out this last type of study, is to
provide exact values of power consumption where they are not metered. Through capital expenditure analysis we conclude that the coyote cable is more beneficial than rabbit cable as we are saving 13 KW of power.
SINGLE LINE DIAGRAM OF 11kv BANEDIYA FEEDER
ISSN (Print) : 2320 – 3765
ISSN (Online): 2278 – 8875
I
nternational
J
ournal of
A
dvanced
R
esearch in
E
lectrical,
E
lectronics and
I
nstrumentation
E
ngineering
(An ISO 3297: 2007 Certified Organization)
Vol. 3, Issue 7, July 2014
DOI: 10.15662/ijareeie.2014.0307011
REFERENCES
[1] J.Michael Silva,“Use of GPS receivers under power line conductors” ,senior member, IEEE, and Robert G.Olsen Fellow, IEEE.
[2] Michael N.Zeiler, “Integrating GIS and GPS for mapping and analysis of electric distribution circuits” ,Envision utility software corporation 2521 camino entrada santa Fe,NM 87505.USA.
[3] Sangeeta Kamboj and Ratna,” Application of GPS for sag measurement of overhead power Transmission line”, International Journal of Electrical Engineering and informatics ,Volume.3,No.3 2011.
[4] Peter H.Dana, ,”GPS Time Dissemination for Real Time applications”, Department of geography, University of Texas at Austin, Austin TX78712-1098,consultant, Georgetown TX78627.
[5] Kemerer, R.S, “Directly connected static Var compensation in Distribution system application” ,IEEE Transaction volume 35,1999.
[6] Happ,H.H;Wirgau ,KA“Static and Dynamic Var compensation in system planning”,power apparatus and system, IEEE transaction volume,PAS97,Issue 5
[7] Dias,L.G;El Hawary,M.E ,“Effects of active and reactive power modeling in optimal load flow studies” ,Generation. Transmission, Distribution, IEEE proceedings volume 136,1989.
[8] Power Research and Development Consultants Private Limited.”Mi Power version 8.0 “.