KM3NeT Acquisition Control
Cristiano Bozza1,* for the KM3NeT Collaboration
1
Dipartimento di Fisica Università di Salerno and INFN Gruppo Collegato di Salerno, via Giovanni Paolo II 132, Fisciano 84084 Italy
Abstract. The multi-site nature of the KM3NeT neutrino observatory in the Mediterranean Sea has influenced the development and evolution of its acquisition control software. It is flexible and portable. The same programs are used in data-taking shore stations of neutrino telescopes as well as in testing sites for detector components at different stages of the integration. Flexibility is obtained through high modularity and tight integration with the central database system. The software architecture can be defined as "maximally disconnected" to ensure that no "single point of failure" exists. The most recent development is dynamic resource provisioning and failover, to automatically cope with the possible event of a hardware failure of one or more data taking servers or network elements.
1 Introduction
The KM3NeT Collaboration is incrementally building two modular water Cherenkov neutrino detectors [1] in the Mediterranean Sea, with two different research programs: the Astroparticle Research with Cosmics in the Abyss (ARCA) project [2] has its detector located off the Southern Italian shore; the site for the detector of the Oscillation Research with Cosmics in the Abyss (ORCA) project [3] is off the Southern French shore. Neutrinos are detected by recording the Cherenkov light generated by charged particles produced in the neutrino interactions with the sea water or nearby seabed rock. The basic unit of each detector is the Digital Optical Module (DOM), a 39 cm-diameter glass sphere hosting 31 photomultipliers (PMTs), attitude-sensing instruments (compass, tiltmeter), temperature/humidity sensors, hydrophones, a Central Logic Board (CLB) and power electronics. CLBs receive control information and send data through optical fibres that connect to the local network. All data are sent to shore where triggering and postprocessing is performed. 18 DOMs are chained through mechanical and electrical/optical cables in a Detection Unit (DU), which is anchored to the seabed in a predefined site of a regularly spaced grid with a nearly circular footprint and kept stretched by a buoy. A full ARCA detector will consist of two building blocks, each one made of 115 DUs with a horizontal radius of 500 m and a height of about 700 m. A full ORCA detector will consist of one building block, made of 115 DUs with a horizontal radius of 140 m and a total height of about 180 m. In the phased building approach, 24 ARCA DUs and 6 ORCA DUs are funded and scheduled to be deployed during several sea campaigns in a time window of
*
about two years. Phase 2 towards the implementation of the full ARCA and ORCA detectors is partially funded and construction has started. In addition to such off-shore detectors, several test stations are running to set up and qualify DUs before deployment, and these work as real detectors and run the same data acquisition and control software. Hence KM3NeT has about 10 active detectors in several sites. A building block has 2185 CLBs and 64170 PMTs to be controlled to produce data. At the current time, two DUs are operational in the ARCA site and one in the ORCA site.
2 Data flow and control logic
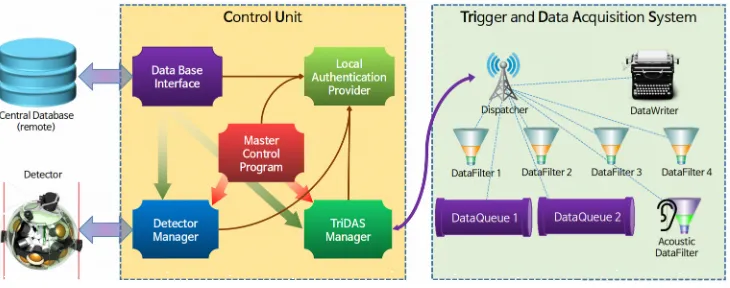
Detectors are defined in detail in the Central Database (DB) [4,5], which tracks and helps managing the integration and testing procedures. It also holds the operational parameters (e.g. supply voltage and signal threshold for each PMT) and stores data from monitoring instruments. Operational parameters are managed in logically consistent and reusable Configuration Groups; an overall Runsetup, which completely defines the operation of the detector at a certain time, is made of several Configuration Groups. The shape of the detector varies due to sea currents and a positioning system reconstructs it continuously from arrival times of acoustic signals emitted by beacons and sensed by the hydrophones. Such reconstructed position information is also stored into the DB. The Trigger and Data Acquisition System (TriDAS) [6], running on a proper number of servers to share the load, continuously processes optical data from PMTs to reconstruct tracks or showers in water and acoustic data from hydrophones to update the detector shape. The TriDAS components to be controlled are the Control/Data Dispatchers, Data Queues, Optical/Acoustic Data Filters and Data Writers. Data Queues receive data from the CLB network and route them to the Data Filters, which process them and send the output to Data Writers for disk storage. The Control Dispatcher routes control commands and Data Dispatchers fan out data samples to monitoring or special handling processes. Figure 1 sketches the various software components and the control data flow.
Figure 1. Control data flow. Instrument and photomultiplier data flows are not shown.
about two years. Phase 2 towards the implementation of the full ARCA and ORCA detectors is partially funded and construction has started. In addition to such off-shore detectors, several test stations are running to set up and qualify DUs before deployment, and these work as real detectors and run the same data acquisition and control software. Hence KM3NeT has about 10 active detectors in several sites. A building block has 2185 CLBs and 64170 PMTs to be controlled to produce data. At the current time, two DUs are operational in the ARCA site and one in the ORCA site.
2 Data flow and control logic
Detectors are defined in detail in the Central Database (DB) [4,5], which tracks and helps managing the integration and testing procedures. It also holds the operational parameters (e.g. supply voltage and signal threshold for each PMT) and stores data from monitoring instruments. Operational parameters are managed in logically consistent and reusable Configuration Groups; an overall Runsetup, which completely defines the operation of the detector at a certain time, is made of several Configuration Groups. The shape of the detector varies due to sea currents and a positioning system reconstructs it continuously from arrival times of acoustic signals emitted by beacons and sensed by the hydrophones. Such reconstructed position information is also stored into the DB. The Trigger and Data Acquisition System (TriDAS) [6], running on a proper number of servers to share the load, continuously processes optical data from PMTs to reconstruct tracks or showers in water and acoustic data from hydrophones to update the detector shape. The TriDAS components to be controlled are the Control/Data Dispatchers, Data Queues, Optical/Acoustic Data Filters and Data Writers. Data Queues receive data from the CLB network and route them to the Data Filters, which process them and send the output to Data Writers for disk storage. The Control Dispatcher routes control commands and Data Dispatchers fan out data samples to monitoring or special handling processes. Figure 1 sketches the various software components and the control data flow.
Figure 1. Control data flow. Instrument and photomultiplier data flows are not shown.
The Control Unit (CU) [7] orchestrates the consistent behaviour of the various hardware (CLBs and PMTs) and software (TriDAS) components and interfaces all of them with the DB and local or remote collaborative users. With the goal of maximising the detector live-time, the CU is itself split into five different services that communicate in a disconnected mode (being able to operate even if other services are temporarily stopped): the Local Authentication Provider (LAP - provides local management of user account credentials and
stores the current CU configuration), the Data Base Interface (DBI - manages a local cache of crucial information such as detector definitions and Runsetups and handles local data upload to the DB over the Internet), the Master Control Program (MCP - local authority that defines the current operational state of the system), the Detector Manager (DM -controls the detector hardware via the CLBs) and the TriDAS Manager (TM - manages TriDAS processes via the Control Dispatcher).
3 The Control Unit
The state of a detector at any time is defined by a physical description (from integration information), the current Runsetup, position1 and timing calibrations (the time to propagate a signal from each PMT to the TriDAS varies with the PMT supply voltage and depends on the effective path in the optical fibres and network switches) and the current operational target, which can be Off (no power on PMTs, no data readout), On (PMTs powered, no optical data, instruments read out) or Run (PMTs powered and read out, instruments read out). Each hardware/software component has a Finite State Machine (SM) that may be in one of the following states: Idle, Stand-by, Ready, Running, Paused. The Idle state is stable and corresponds to the Off target; the On target corresponds to the Ready stable state; and the Run target corresponds to the Running stable state. The Stand-by and Paused states are transient states. In particular, operational parameters are set during the Stand-by/Ready transition.
A Run is a finite time span during which the detector operates with constant Runsetup and calibrations. For practical management of large data sets, every several hours a new Run starts even if all conditions are unchanged. Runs are scheduled in Jobs, each coming with a priority, Runsetup, target and start/finish dates/times. At any time, the Job with highest priority preempts all lower priority Jobs, and a new Run starts every time the current Job changes2. Figure 2 shows the overall interplay of Runs and Jobs and the difference among stable states, transient states and targets.
Figure 2. Left: sketch of Runs and Jobs. Right: targets, stable states and transient states.
Each hardware/software component is controlled in an asynchronous mode. This approach ensures scalability as it allows recovering the operational state of a failing component without having to stop and restart a Run; moreover, no component is left waiting on none other, with the only price of having to log each state transition in the DB (which is nevertheless a negligible load in any condition). When the current state changes, the MCP notifies the DM and TM and they read (if needed) the new Runsetup and
1
Position calibrations do not change during a run: fine tuning by acoustic data is applied offline.
2
calibration information from the DBI. The DM drives each CLB through the states of its SM to apply the new parameters and start the acquisition. The TM does the same with TriDAS processes. Otherwise, DM and TM always make sure that CLBs and TriDAS processes respectively operate as demanded, and stop/restart them in case they go into inconsistent states or crash. While their tasks are similar, the DM and TM have quite different inner structure because of the different information flow they have to handle: the DM receives status updates and monitoring data continuously from all CLBs (0.1-1 Hz depending on the typical variation timescale of each parameter), (re)establishing communications when needed (a computer with 32 cores should be able to run a single DM for two building blocks); the TM instead exchanges status information and control commands only on Run switches and ensures processes are responsive every few seconds. The DBI is an active component itself, because it polls the DB to check the presence of new timing/position calibrations and notifies the MCP when they are ready for the next Run switch. The role of the LAP was originally relatively simple, as it basically stores an encrypted copy of user credentials for local access to the CU graphical user interface and notes which computers are hosting the CU services (local service catalogue). As shown in the next section, it evolved to do much more complex tasks.
4 Dynamic resource provisioning and failover
As a detector increases in size, the TriDAS has to incorporate more servers to meet the growing processing needs. It is estimated that a full building block requires the power of about 100 typical CPU cores at the present status of technology. Over the expected time span of KM3NeT detectors (15 years) it may happen that computers experience hardware failures. This is even more critical if the computer that hosts one or more CU service fails: for example if the MCP service is unavailable the DM and TM will keep running on the same schedule indefinitely, with the drawback of impractically big data files, no updates of timing/position calibrations and no ability to react to alerts (e.g. transient phenomena that require special Runsetups). If instead the DM server is lost, there is no data logging from the CLB and when a new run starts all of their data will be invalid (as they will refer to a closed run), leading to no output data at all. If a failure occurs when no skilled administrator is available, there is a concrete risk that many hours or even days are lost, which is particularly harmful for specific physics programs (e.g. multi-messenger observation of transient astrophysical phenomena).
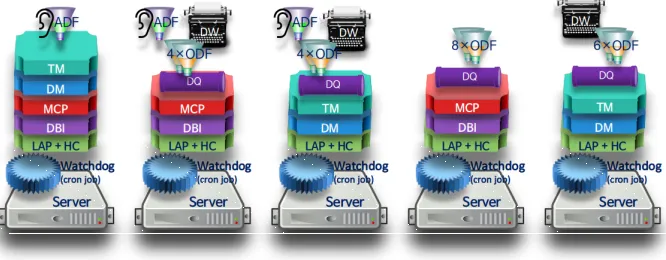
Figure 3. Multiple fault tolerance with the upgraded LAP allowing also Dynamic Provisioning. The meaning of the acronyms can be easily inferred from Figure 1.
In order to mitigate (and in most cases completely eliminate) risks connected to hardware failures, the LAP was recently evolved to implement Dynamic Provisioning Management (DPM) of resources. In this scenario, every computer hosts one LAP that is kept alive with a simple watchdog script. The LAPs continuously synchronize their copies of DPM information, consisting in the list of computers and services allowed to run on each computer. Each LAP regularly runs a self-diagnosis and asks the others to report about their “health status”. A computer that stops responding is marked as failed by others and the services it was supposed to run (including CU and TriDAS processes) are distributed to other computers in a predictable way, based on the network addresses, so no central authority is required to define the service assignments: each LAP can recompute them by itself, obtaining the same results. Finally, depending on the assignment of services to run locally, each LAP starts/stops them as needed. The reaction time can be tuned, but it should not be too short to avoid starting instabilities and oscillating behaviours. 5 seconds to perform a full system reconfiguration upon a hardware failure look safe in preliminary tests. Depending on the available resources and configuration modes, DPM can ensure single, double or multiple fault tolerance (see for example Figure 3).
5 Software notes
In a KM3NeT detector control station, several network protocol coexist for different purposes. Communication towards/from CLBs occurs on UDP. TriDAS services need serial streams, as provided by the Control Host protocol, based on TCP. CU services communicate using Server Application with Web Interface (SAWI), a lightweight remote procedure call protocol with result persistence built on top of HTTP. NFS is used to store/retrieve data to/from disk.
All the code of the CU is written in C# and runs on top of Mono (and depends on no other external library) on several flavours of Linux (Debian 8 and 9 and derivatives, CentOS 6 and 7 and derivatives, SLC 6), Mac OS and Windows (also using .NET). Docker containers with full CU installations have successfully been prepared and tested. All services share a common architecture, with an HTTP interface that provides access to monitoring data in a Virtual Directory fashion and supports a Graphical User Interface (GUI) and SAWI to allow communication among the CU components. Logging and a control console are also provided in a uniform way and the code base is largely reusable for upgrades and possibly other projects.
References
1. S. Adrián-Martínez et al. (KM3NeT Coll.), J. Phys. G. 43 1 (2016)
2. S. Aiello et al. (KM3NeT Coll.), https://arxiv.org/pdf/1810.08499.pdf (2018) 3. S. Adrián-Martínez et al. (KM3NeT Coll.), J. High Energy Phys. 2017 8 (2017)
4. A. Arnauld and C. Bozza, AIP Conf. Proc. 1631 167 (2014) 5. A. Arnauld and C. Bozza, EPJ Web Conf. 116 07004 (2016)
6. T. Chiarusi and C. Pellegrino, EPJ Web Conf. 116 05005 (2016)