ECCD operations in the second experimental
campaign at W7-X
M. Zanini, H.P. Laqua, T. Stange , C. Brandt , M. Hirsch, U. Höfel, N. Marushchenko, U. Neuner, K. Rahbarnia, J. Schilling, H. Thomsen, R.C. Wolf and the W7-X Team
Max-Planck-Institute for Plasma Physics, Wendelsteinstr. 1,17491 Greifswald, Germany
Abstract. In the Wendelstein 7-X stellarator, up to 7MW of power are delivered to the plasma by an electron cyclotron resonance heating system consisting of ten 140 GHz gyrotrons [1]. Due to the flexible front steering mirror of each beam line, the power deposition can be varied over the whole plasma radius and is optionally combinable with additional current drive. This flexibility, together with small toroidal currents in the stellarator, makes W7-X a perfect testbed for electron cyclotron current drive (ECCD) experiments, which have been successfully accomplished during the first two experimental campaigns OP1.1 and OP1.2a.
Long discharges (lasting up to 30s) have been performed in OP1.2a, thus allowing the study of the current drive time evolution and the possibility to compensate the bootstrap current. ECCD efficiency has been studied using different power deposition profiles combined with a variation of the injection angles in relation to the magnetic field.
During ECCD experiments, saw-tooth-like oscillations have been observed. Depending on the driven current density, ECCD can significantly modify the rotational transform (iota) profile, which can locally reach low order rational, thus triggering plasma instabilities.
Different current density profiles have been tested, in order to try to understand the main trigger parameter for the instabilities. In particular, effects caused by current density gradient have been investigated producing both co- and counter-current drive at different radial positions: the total current drive is negligible, but a strong current gradient arises by driving currents in opposite directions.
In this work an overview of ECCD operations in OP1.2a is given and first results, comparing different diagnostics, are presented. An initial 1-D model, coupled with the ray tracer TRAVIS, is developed, in order to have an estimation of current diffusion times and the radial position where a low order rational crosses the disturbed iota profile.
1. Introduction
The superconductive optimized stellarator Wendelstein 7-X (W7-X) [1] generates the rotational transform by means of five-period external coils, therefore toroidal current is not needed to confine the plasma. During the first two operation campaigns (OP1.1 and OP1.2a) plasma start-up and heating have been obtained using Electron Cyclotron Resonance Heating (ECRH), with up to 10 gyrotrons at 140 GHz, able to operate both in O2 and X2 mode, for a maximum delivered power of 7MW [2]. ECRH is a versatile tool to deposit power in the plasma, since the resonance region is extremely localised and it can be varied by steering the launcher mirror. If oblique injection takes place, Electron Cyclotron Current Drive (ECCD) is generated [3]; the generation of ECCD is well localised too and it can be used to locally modify the plasma rotational transform and shear or to compensate bootstrap current. Nevertheless, during ECCD experiments in abovementioned experimental campaigns, fast collapses of electron temperature have been
observed [1] [4] to present strong similarity with well-known saw-tooth- [3] [5]crashes in tokamaks [6].
A short overview of the experimental setup will be presented, and then a remarkable ECCD shot will be introduced, in order to highlight the main issues related to this kind of collapses. In the end, the 1-D model for current evolution, under development, will be presented.
2. Experimental Setup
rotational transform between 0.95 and 1.2. The toroidal magnetic field on the axis is between 2.46T and 2.52T. The effective minor radius of the plasma depends on the magnetic configuration and plasma parameters, but generally, it is between 0.49m and 0.55m. The major radius is 5m, hence the aspect ratio of the stellarator is about 10.
The magnetic field lines have a discrete periodicity in the toroidal direction and the machine can be subdivided into five modules. ECRH launchers are placed on module 1 and module 5, where electromagnetic beams are injected into the plasma on the proximity of bean-shaped planes (ϕ = 0° and ϕ = -72°). Radiative electron temperature is measured by means of 32 Electron Cyclotron Emission (ECE) channels, with a sampling rate of 1 MHz.
Thomson Scattering provided electron temperature and density profiles, with a sampling rate of 10 Hz.
Different Rogowski coils provided toroidal current measurements.
The plasma heating has been provided by ECRH only, which also provided current drive, in both co- and counter-direction, i.e. increasing or decreasing the rotational transform. ECRH power deposition and ECCD are simulated using the ray-tracer code TRAVIS, developed at IPP [5].
3. ECCD-driven temperature
collapses
During ECCD experiments, fast and repetitive crashes of electron temperature in ECE and soft X-rays camera have been detected. Since this phenomenon appeared during ECCD operations only, it has been hypothesised that the rotational transform reached a low order rational value, where an MHD instability was triggered. An overview can be find in [4].
From a comparison between the reference discharge (without ECCD), plotted in Figure 1 and a characteristic shot with current drive (Figure 2), it is possible to notice that temperature collapses (second timetrace in each plot, in magenta) are present in the second discharge only. This consideration leads to the hypothesis there crashes are caused by a modification of the rotational transform profile, caused by localised current drive.
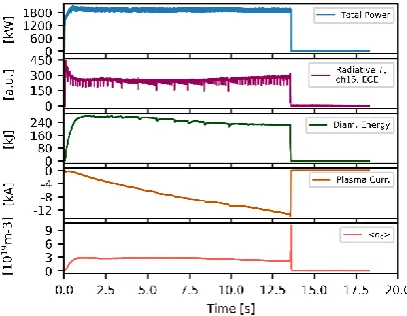
In this work the effort will be focused on a plasma ECCD discharge. An example is provided by discharge 20171206.028 (Figure 2 and Figure 3). This discharge was performed using standard magnetic configuration (axis rotational transform = 0.85) and an inverted magnetic field. In this discharge, three gyrotrons heated the plasma, for a total power of 1800 kW delivered into it. One gyrotron injected power in perpendicular direction, while the other two with oblique injection (ϕ ≈ -11°), thus driving current in co-direction. The discharge is about 13s long and it is possible to notice that the
temporal distance between two adjacent crashes is not constant. Moreover, two different types of crash can be recognized. The first type has higher frequency, but a smaller amplitude with respect to the second one, whose collapse effects have been detected also on the diamagnetic energy. The discharge ended abruptly, with a plasma current of -14kA.
The time interval between strong adjacent crashes changes and increases as the discharge evolves. Total power into the plasma and the density do not change, therefore the other parameter that can influence the time necessary to trigger an instability is the current profile, but since the power deposition is unchanged, one can hypothesise that, after a crash, the current redistributes in such a way to have an accumulation close to the axis. In this way, the rotational transform decreases after each crash and it takes more time for the ECCD to reach a resonance. This hypothesis has still to be proven.
Due to the similarity with saw-tooth crashes, which are related to m=1, n=1 mode, it has been assumed that ι =1 is reached, where a magnetic island is formed and whose collapse modifies, in very short time, the electron temperature inside the affected volume.
Figure 1: Reference discharge without current drive. Temperature and plasma current changes are due to modifications of the total injected power (blue timetrace).
purple). Instability effects are visible also on the diamagnetic energy signal (green).
Figure 3 : Soft X rays (XMCTS) data for the analysed discharge. In figure (a) the time traces are displayed. It reproduces main feature of ECE in Figure 3. Plots (b) and (c) are crash zooms and are similar to ECE in Figure 4.
4. Precursor activity
Most of the ECE channels display precursor activity before crashes.
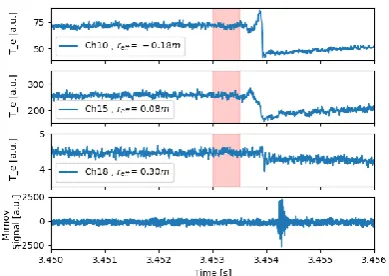
The comparison and correlation between different channels is still not complete yet, but it can be noticed that precursors on channel 10 and 15 have the same frequency (around 6.1 KHz), but opposite phase (180°). The electron temperature detected by these two channels drops abruptly, with a typical time of the order of 10-50 µs. On the other hand, the channel 18 does not display a relevant precursor activity, probably too small to be detected by the actual Fourier analysis routine. A temperature spike can be seen; the temperature increases abruptly and returns to the previous value in the timescale for the temperature collapse of the other two channels. This behaviour is slightly different with respect to saw-tooth in tokamaks, where channels display a symmetric behaviour with respect to centre. In further analyses, the radius shift caused by diamagnetic shift and Shafranov shift will be taken into account. In this work, only the cold resonance position of ECE channels has been considered. After the crash, a strong MHD activity, whose frequency is of about 170 kHz, has been measured by Mirnov coils (in Figure 4 only one Mirnov coil channel has been plotted). The activity starts 0.5 ms after the temperature collapse and it is 0.2 ms long. Since these oscillations are detected after the crash, this could indicate reconnective phenomena that are
taking place after the collapse. A further investigation with all Mirnov coil channels will be performed in order to obtain more information.
Figure 4 : ECE (first three time traces) and Mirnov coil signal (fourth time trace) before a temperature collapse. Strong oscillation are visible in channel 10 and 15 (red box), while weak oscillation are slightly visible on channel 18.
Figure 5 : Three ECE channels and Mirnov coil signal related to a typical crash of Figure 7. Main features are different with respect to Figure 4, especially with respect to precursor activity (comparing red boxes in this figure and Figure 5, it is possible to notice that the strength of precursor activity is different.)
5. Crash evolution in time
Long discharges at W7-X are an excellent tool to study evolution of saw-tooth-like crashes.
the interval from 0s to 3s and the interval from 3s to 6s of ECE channels are respectively plotted. In these plots, normalised ECE time traces are displayed. In the first plot, where the first three seconds of the discharge are displayed, it is possible to notice that, at the same channel, crashes have almost the same amplitude. The central collapse region is included between channel 8 and 16; temperature decreases during the collapse in the central region, while increases in the outer one. An example of crash in this region is given in Figure 4. The crash behaviour slightly changes, since two different types of crash are distinguishable. The weaker one, with higher frequency and a stronger one with smaller frequency. The central region, where the temperature decreases, is slightly expanded in Figure 7 with respect to Figure 6, probably indicating that the inversion radius for this kind of instabilities increases over time. Another feature that is not clear yet is represented by the fact that precursor activity, as shown in Figure 4 is stronger at the beginning of the discharge (such as in the time interval plotted in Figure 6) and becomes weaker (Figure 5) as the discharge develops (interval represented in Figure 7). In fact, in Figure 5 a typical crash for this second time interval is displayed. Precursor activity is not recognisable. A characterization of different crash behaviours is going on, in order to better classify and understand this phenomenon.
Figure 6 : discharge interval from 0s to 3s. ECE signals are normalised with respect to their average value. Cold resonance position of channels is provided. ECE cold resonance radii are represented on the y-axis
Figure 7 : discharge interval from 3s to 6s. ECE signals are normalised with respect to their average value. . Cold resonance position of channels is provided. . ECE cold resonance radii are represented on the y-axis.
6. Discharge termination
Thanks to long discharges conducted in OP1.2a, it has been possible to investigate saw-tooth-like instabilities for rather long shots.
The maximum toroidal current that has been achieved is about -14kA; after this level a global crash takes place and the global confinement is lost.
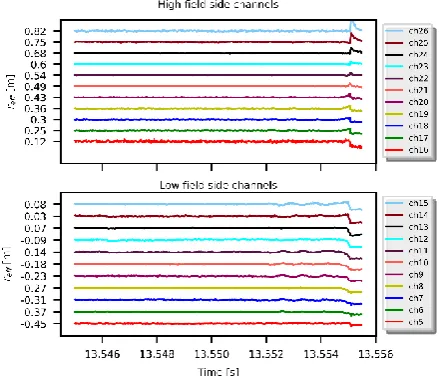
Figure 8 : Time traces zoom on ending part of the discharge. ECE signal are normalised with respect to their average value. LFS channels display temperature decrease, HFS channels display a temperature increase. . ECE cold resonance radii are represented on the y-axis.
On the other hand, HFS channels do not display any precursor, but they experience a temporary temperature increase, before the discharge ending. The first interpretation consists in a global plasma displacement from the LFS to HFS leading to the termination of the discharge. The main reason is not clear yet, but since it has not been possible to reach a current higher than -14kA, this phenomenon limits global plasma performances, so a deep investigation has to be conducted using soft-x-rays and magnetic diagnostics.
7. 1-D current evolution model
Electron cyclotron current drive is well localised along the effective radius, therefore the estimation of the current profile is crucial to understand and model the rotational transform time evolution.
So far, no direct measurements of plasma current profile are available; therefore, toroidal plasma current can be simulated only. In order to evaluate whether the generated ECCD can be responsible of temperature crashing by means of localised rotational transform modifications, the following model has been developed.
When ECCD is generated inside the plasma (for sake of simplicity, we assume the current to be constant along the same flux surface and we assume topological modification of the original magnetic configuration to be negligible), a counter induced current is induced by the plasma itself to compensate the change of magnetic flux (Lenz’s Law). This shielding current will then diffuse, so a net current will rise, modifying the rotational transform. In W7-X the R/L time, the typical time for the current to reach a stationary state is estimated to be around 30s, but toroidal current effects can be perceived on faster timescales. Assuming that the ECCD profile does not change in time and using a cylindrical geometry, since the current drive has toroidal direction only, the shielding current evolution is described by the following equation:
𝜕𝑗(𝑟,𝑡)
𝜕𝑡
=
1 𝑟
𝜕 𝜕𝑟
[𝑟
𝜕
𝜕𝑟
(𝜂(𝑟)𝑗(𝑟, 𝑡))]
1)Where µ0 is the magnetic permeability of vacuum, η is the plasma resistivity, r is the radius of the cylinder and j(r,t) is the counter-induced current density. The rotational transform is then affected by the net current and can be decomposed into two terms. The first term corresponds to the vacuum iota, which is given by external coils only, while the second term is given by the plasma current.
Considering initially a cylindrical geometry, the second term depends on the total current and position. The relation is the following:
𝜄 ∝ 𝐼(𝑟) 𝑟⁄ 2 2)
In order to explain the repetitiveness of these crashes, it is legitimate to suppose that magnetic surfaces are destroyed during a crash, so the current and the temperature redistribute. Since magnetic surfaces are not existing and temperature decreased, ECCD becomes negligible. Then, according to the saw-tooth crash theory, magnetic surfaces are restored, temperature reaches a stationary value again, current drive is newly driven and, again, a counter induced current shields it.
Since the current drive is generally run between 10% and 30% of the effective radius, during low-beta and relatively low density (about 2·1019 m-3), the bootstrap current in this region is not expected to provide a relevant contribution to rotational transform modification, therefore effects of ECCD and of the relative shielding current only will be considered. Data collected by Thomson Scattering are used to estimate the electronic temperature and density, which have to be taken into account for current drive calculations.
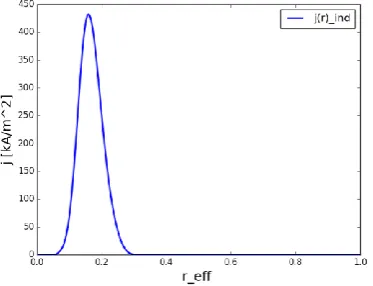
The ECCD is simulated using TRAVIS, as displayed in Figure 9:
Figure 9: ECCD profile, simulated with TRAVIS, as a function of the normalised radius.
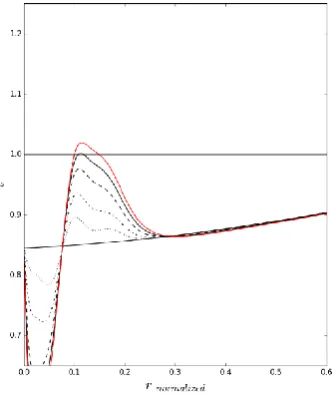
Assuming that, at t=0 s, the ECCD and the shielding current compensate each other. This second component diffuses and a net current arises, as it can be seen on Figure 10, where the evolution of the two components sum is plotted at different time. In this initial version of the code, non-linear changes of the toroidal flux and topology alterations are neglected, even if it is foreseen to take them in account in future developments. The sum of current-free rotational transform and the contribution yielded by the toroidal current in Figure 10 are plotted in Figure 11. The resonant values is reached on a timescale of 100ms or 200ms, which is compatible with the typical time between two crashes.
provided by inner current redistribution after the crash.
Figure 10: Sum of ECCD and shielding current at different time-steps. At t=0s, the two components compensate each other, therefore the resulting current is null. As the time increases, the shielding current diffuses and a net current arises.
Figure 11: Current changes modify rotational transform, which is plotted for different times as a function of the effective radius.
8. Conclusions
In this work, an overview of a relatively long ECCD driven crash, performed during the second experimental campaign of W7-X, has been presented.
This phenomenon has been noticed during electron cyclotron current drive experiments only, which can be related to current driven MHD instabilities.
A preliminary Fourier analysis of ECE signal displays growing oscillations before a crash, whose frequency is between 1 and 10 KHz, while Mirnov coil signals show a strong activity after the crash, which may indicate reconnective phenomena taking place. Temperature crashes display different behaviour over time: a preliminary analysis suggested that the inversion radius increases. The discharge terminated when a maximum current value was reached; further analyses will be carried out to understand whether this is a threshold value for toroidal current in W7-X.
Since a proper mode analysis is still going on, a 1-D model has been developed, in order to understand whether rotational transform changes, induced by localised current, can reach a resonant value.
This work has been carried out within the framework of the EUROfusion Consortium and has received funding from the Euratom research and training programme 2014-2018 under grant agreement number 633053. The views and opinions expressed herein do not necessarily reflect those of the European Commission.
References
[1] R. Wolf and al., "Major results from the first plasma campaign of the Wendelstein 7-X stellarator," Nuclear Fusion 57, 2017.
[2] T. Stange and al., EPJ Web of conferences, vol. 157, no. 02008, 2017.
[3] N. Fisch and A. Boozer, "Creating an asymmetric plasma resistance with waves," Phys. Rev. Lett., vol. 45, 1980.
[4] H. Laqua and al., "Saw tooth like collapses by ECCD at the Wendelstein7-X Stellarator," submitted to Phys. Rev. Lett., 2018.
[5] N. Marushchenko and al., "Ray-tracing code TRAVIS for ECR heating, EC current drive and ECE diagnostic," Computer Physics Communications, vol. 185, 2014.