Running Head: Between the Lines
Between the Lines: documenting the multiple dimensions of computer-supported collaborations.
Rosemary Luckin
Human Centred Technology Group University of Sussex
Correspondence to: Rosemary Luckin
Human Centred Technology Group School of Cognitive & Computing Sciences
University of Sussex Brighton BN1 9QH
Abstract
When we consider the possibilities for the design and evaluation of Computer Supported Collaborative
Learning (CSCL) we probably constrain the CS in CSCL to situations in which learners, or groups of
learners collaborate with each other around a single computer, across a local intranet or via the global
internet. We probably also consider situations in which the computer itself acts as a collaborative partner
giving hints and tips either with or without the addition of an animated pedagogical agent. However,
there are now many possibilities for CSCL applications to be offered to learners through computing
technology that is something other than a desktop computer, such as the TV or a digital toy. In order to
understand how such complex and novel interactions work, we need tools to map out the multiple
dimensions of collaboration using a whole variety of technologies. This paper discusses the evolution of
a documentation technique for collaborative interactions from its roots in a situation where a single
learner is collaborating with a software learning partner, through its second generation: group use of
multimedia, to its current test-bed: young children using digital toys and associated software. We will
explore some of the challenges these different learning situations pose for those involved in the evaluation
of collaborative learning.
Keywords
cooperative/collaborative learning; evaluation methodologies; human-computer interface; interactive
1INTRODUCTION
In this paper we discuss the challenges posed to the CSCL researcher by the changing use of technologies
for collaboration. We discuss three different technological contexts and the evolution of a documentation
technique that we have developed during our empirical investigations of such collaborative learning
situations. It is this documentation technique that forms the focus of this paper, rather than the
technologies involved in the collaborative interactions being recorded. The documentation was originally
used in a traditional, single learner context and further developed for application in CSCL contexts
involving groups and novel technology. We describe each of the three technologies that form the CS in
the CSCL contexts to which we apply our documentation. We then present three short case studies: one
for each of the contexts described. Each case study discusses the empirical evaluation of the particular
CSCL context and gives an example of our documentation of users interacting and collaborating with or
through the technology. The technique discussed is one approach and is offered, along with suggested
adaptations to motivate discussion and further work. Through this paper we suggest that tried and tested
techniques can be adapted and re-used, provided the foci of interactivity are clearly specified and the
appropriate data sources identified. We discuss the benefits of our approach and suggest that as
researchers we the need to constantly evaluate and extend the documentation techniques we adopt as well
as the technologies we use to engendered collaborative learning.
2THREE TYPES OF CSCL CONTEXTS AND TECHNOLOGIES
2.1 The Ecolab Software
The Ecolab is a software environment with an underlying design metaphor of an Ecology Laboratory into
which the child (aged 9 –11 years) can place different organisms and with which she can explore the
relationships that exist between them. The overall motivation that is presented to her is that she should
explore which sort of organisms can live together and form a food web. The software is now in its
The Ecolab operates in two modes: build and run and is controlled by the child's mouse driven
commands. Build mode allows the child to construct her mini world of plants and animals by adding
those of her choice. When switched to run mode she can activate these organisms, for example, the child
can specify that a sparrow hawk will eat a thrush. When these actions are activated their effect can be
observed. If the action specified, is possible it will occur and the changes can be observed. If the action
is not possible the child will be guided towards a possible alteration so that the effects of the selected
action can be observed. When a learner interacts with the Ecolab she does not need to deal with the full
complexity of possible food web inter-relationships. The learning environment provided by the Ecolab
can operate in 4 several phases of relationship complexity (4 in Ecolab I and 3 in Ecolab II). This means
that not all the possible methods of activating the Ecolab are available all the time. In phase one, which
is the simplest, the relationships which can be formed by the Ecolab objects are only those between a
food and a feeder: the eat or eaten by relationship. The later phases allow the formation of food webs
and relationships between all the different members of the web. The system can switch between these
phases from the less to the more complex, or in reverse from the more to the less complex. The activities
available to direct the child's actions are consistent with the phase of complexity at which the Ecolab is
currently operating.
In addition to providing the child with the facilities to build, activate and observe a simulated
ecological community, the Ecolab also provides the child with small activities of different types. The
activities are designed to structure the child's interactions with the system. They provide a goal towards
which the child's actions can be directed and vary in the complexity of the relationships which the child is
required to investigate. There are, for example, exploration activities that challenge the child to examine
the relationships that exist between the organisms she has selected. She might be asked to see how many
links she can add to a food web diagram for example. In addition to these variations, the Ecolab
environment built by the child can be viewed in different ways, each of which emphasises a particular
aspect of the relationships that currently exist within the Ecolab. All views have the common feature of
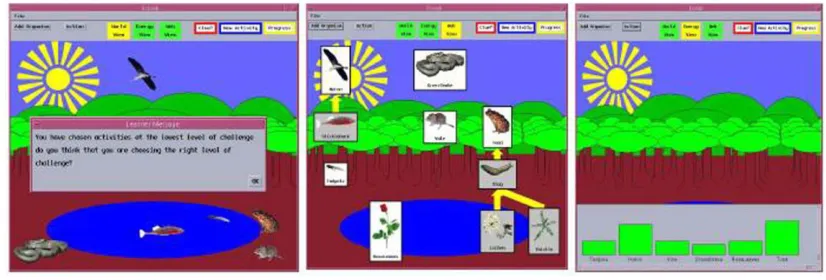
Figure 1: The Ecolab II interface in World, Web and Energy view Views common to both generations of the software are:
World view shows a picture of the organisms that are currently members of the Ecolab environment.
Web view provides a diagrammatic representation of the organisms and the links that exist between
them in a manner similar to the food web diagrams used in text books.
Energy view illustrates each of the live organisms in terms of their current level of energy in a block
graph.
Within each of these views most of the screen objects will provide the child with information when
clicked on with the mouse. For example, clicking on an organism in World view will yield the
organism's name, what it eats and what eats it. Which view a child uses is largely, though not
completely, under her control.
The Ecolab can scaffold the child in several ways. Firstly, it can offer graded help specific to the
particular situation. The higher the level of help the greater the control taken by the system and the less
scope there is for the child to fail (Wood 1978). In addition to offering the child specific hints to ensure
the activity is completed successfully, the difficulty level of the activity itself can be adjusted. This
domain level scaffolding has been extended in the second generation Ecolab II and a metacognitive level
of scaffolding has been added to engender planning and help seeking skill acquisition. Both Ecolab I and
between the system itself and that learner. More information about the Ecolab can be found in (Luckin
and du Boulay 1999; Luckin and Hammerton 2002).
2.2 The Galapagos CD-ROM
The second software example we will consider is the Galapagos CD-ROM, built as a research tool to help
us explore the implications of narrative for the structure of group collaborations with multimedia. The
CD-ROM described Darwin‟s visit to the Galapagos islands and his resultant theory of evolution. It was
composed of 8 sections of content material, each of which deals with a particular aspect of Darwin‟s visit.
Learners were set the task of using the resources provided on the CD-ROM to construct an explanation of
the variations in the wildlife on the islands using an on-line Notepad. The full set of sections is as
follows; the section numbers are used for convenience here to refer to sections, but were not part of the
structure presented to our users:
Introduction
Section 1: About Darwin‟s Visit
Section 2: About Islands
Section 3: Island Formation
Section 4: Island Location
Section 5: Trade Winds
Section 6: Currents
Section 7: About the Birds
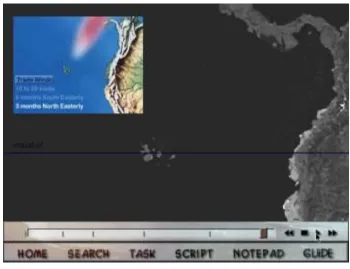
In addition to these sections of content material, learners had access to the following information via
a tool bar at the bottom of the screen, see Figure 2 which illustrates a screen shot of the Guided
Discovery Learning version of Galapagos with a section of content called “Trade Winds” in use.
A reminder about the task they had been asked to complete at the outset of their interactions with
Galapagos.
An editable Notepad in which they could take notes and write their answer.
A Model Answer, which was a sample of an acceptable answer to the task, they had been set and
which could only be accessed when they had written 50 words in the Notepad.
A script window that contained the transcript for all audio material.
For more detail about these features see (Luckin, Taylor et al. 1998)
2.3 Digital Toy technology
The third and final technology we will explore is that of digital toys. There are an increasing number
of digital toys available on the commercial market and many of them make claims about their educational
affordances. It seems reasonable to consider them as possible tools with which to engender collaborative
learning. These toys are varied but are all artefacts with which learners can interact and obtain a
response. These toys provide a new form of interface: one which is not televisual or text-based, does not
use a desktop metaphor and does not rely on a keyboard or mouse input. Instead, they exhibit a range of
interface modalities: they are anthropomorphic (Don 1992), emotional (Strommen and Alexander 1999),
sympathetic (Johnson 1999), manipulative (Resnick 1998) and haptic (Fogg 1999).The toys are
qualitatively different from animated pedagogical agents because they are not screen-based, virtual
objects but things that can be squeezed and cuddled. There is an expanding market for increasingly
communicative digital toys.
These toys all raise many questions about educational value and benefits as well as broader issues.
From the CSCL perspective we can ask for example: How do children interact with and around the toy?
How can we make the best use of these toys to promote CSCL? There are also toys that, in addition to
interacting with children in their own right, can be linked to a standard desktop computer and used in
conjunction with associated software. We can then ask for example: Do the toys and accompanying
software promote collaboration with, through or around the technology? In this paper, we look at how
one might document and analyse young children‟s interactions with these toys.
3THE EVOLUTION OF A MULTI-DIMENSIONAL DOCUMENTATION TECHNIQUE
3.1 One dimensional collaboration: documenting a single user‟s collaboration with a software learning partner.
The method for documenting collaborative interactions described in this section was first developed for
the evaluation of the Ecolab I software and was subsequently used with Ecolab II. In both generations of
learner. The documentation of the collaborations between child and computer took the shape of an
annotated user log that was represented graphically. The learning gains made by children using Ecolab
were also evaluated using a pre- and post-test methodology in order to assess the efficacy of the software,
this work is reported elsewhere (Luckin and du Boulay 1999; Luckin and Hammerton 2002) and is not the
main focus of the current paper. It is the manner in which we can record and analyse the character of the
interactions and collaborations between each child and the system that we focus upon here. Through the
annotated logs of children‟s use of the Ecolab we wanted to investigate how the software had supported
and encouraged various types of interaction and collaboration in order to inform the design of future
systems. An exploratory evaluation of the Ecolab I software offered the first opportunity to trial the
documentation technique that is the focus of this paper. This evaluation was conducted with a class of
children aged 10 and 11 years to investigate the extent to which the software would be able to adjust to
each learner and the ways in which the interactions and collaborations between learners and software
varied. Prior to using the software each child completed a written and a verbal pre-test, the latter of
which was in the form of a structured interview recorded on audio tape. Each child used the Ecolab
software as an individual for a total of 60 minutes over two sessions. In addition, a 20 minute initial
session with a smaller 'demo' version ensured that all children were comfortable with the mouse skills
required and the interface. After the system intervention subjects were given a written and verbal test,
identical to the pre-test, and a short additional extension interview. Of the 30 children who started the
study only 26 completed all sessions between, and including, pre and post-test. The four who did not
complete these sessions had either left the school or been absent during the evaluation period. For each
child who used the software a summary record of their interactions was produced from the detailed logs
maintained during their sessions of system use and this was used to build up a picture of the types of
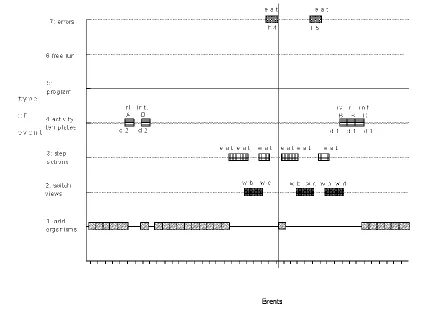
Figure 3 Annotated Log for a child using the Ecolab software
Cognitive or learning styles have been a subject of active interest in recent years (Pask 1976;
Goodyear 1991; Groat and Musson 1995; Riding and Read 1996), for a brief review see (Valley 1997).
The influence that a learner‟s style can have upon the way they interact with technology has also been
recognised (Riding and Rayner 1995). Within this literature there are examples of classification systems
that differentiate learners according to their learning preferences; for example, as serialists or holists. The
analysis of the annotated interaction summaries of children's experiences with the Ecolab software took a
fresh perspective on classification using only the styles of interaction or Profiles which could be found in
the records of each child's system use and emphasized our interest in the nature of Interaction and
Collaboration. Characteristics were identified and children categorised through:
Collaboration Profiles according to the nature of the collaborative support provided by the system
for the child.
For the purposes of this paper we will narrow down our focus further and concentrate upon the
Collaboration profiles and their documentation in the annotated logs. Figure 3 illustrates one child‟s
annotated log for one session with the Ecolab I software. Each line in the chart represents a type of event.
For example, line 1 represents adding organisms to the Ecolab world. Each block on the line represents a
single event. The letters and numbers which annotate the blocks specify further details. For example the
first block on line 4 in the example is annotated with "rl", "A" and "d2". The "rl" indicates that the
activity was of the Rule Definition type, the "A" indicates that it was at the "energy-transfer" area of the
curriculum and the "d2" indicates the level of difficulty used within this activity template. Line 7,
labelled “errors”, indicates the times when the system had to help the child to complete an action
successfully. The annotations on the two blocks on this line in Figure 3 indicate that the action the child
was trying to complete was an “eat” action and that the help offered was initially at level 4 (h4) and then
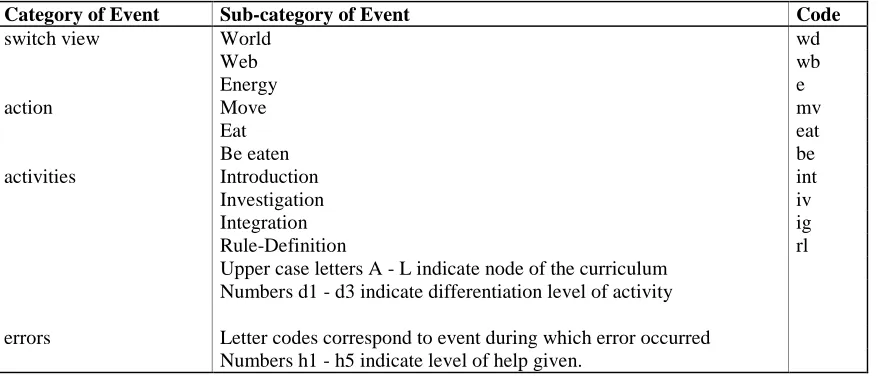
raised to level 5 (h5). Table 1 presents an extract from the coding scheme used for the summary records
produced.
Table 1 an extract from the coding scheme used for the summary records produced
Category of Event Sub-category of Event Code
switch view World wd
Web wb
Energy e
action Move mv
Eat eat
Be eaten be
activities Introduction int
Investigation iv
Integration ig
Rule-Definition rl
Upper case letters A - L indicate node of the curriculum Numbers d1 - d3 indicate differentiation level of activity errors Letter codes correspond to event during which error occurred
For the purposes of constructing collaborative profiles from these annotated logs two pieces of
information were most important. First, the level of difficulty at which the child was tackling an activity
as represented by the dn annotations on the blocks on line 4 of the log chart. Second, the level of help
used as indicated by the hn annotations to the blocks on line 7 of the log charts. From this information
the two characteristics that were found to be the most useful for differentiating collaborative style within
the interactions were extracted. These characteristics were: The Amount of support and the Depth of
support provided by the system for the child.
Amount of support: the average amount of activity differentiation (i.e. the degree to which the
activity is presented in a simpler form) and the average number of help instances for the experimental
group was calculated. An above average amount of either activity differentiation or instances of help was
the criteria necessary for a child to be considered as using 'Lots' of collaborative support.
Depth of support: this characteristic was based upon the level of help and level of differentiation
used. Once again the average levels used within the experimental group were calculated. Help or
differentiation above the average level resulted in a child being considered as using a 'Deep' or higher
level support.
These collaboration characteristics were used to group the children into one of four Collaboration
Profile groups. The first group was the largest and was further divided in accordance with the type of
support which was most prevalent. The distribution of children into these groups is illustrated in Table 2.
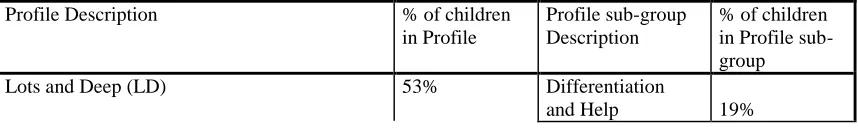
Table 2 Distribution of children within Collaboration Profile groups
Profile Description % of children
in Profile
Profile sub-group Description
% of children in Profile sub-group
Lots and Deep (LD) 53% Differentiation
Differentiation 19%
Help 15%
Lots and Shallow (LND) 12%
Little and Deep (NLD) 16%
Little and Shallow (NLND) 19%
An Example of a Child‟s Collaboration Profile
Jason's use of the available support was typical of the Lots and Deep profile group and of a user of
above average amounts of both help and activity differentiation. He used level 4 help early in his first
session of system use to achieve success in making organisms eat each other. His initial activities were
completed with maximum differentiation of level 3. This was gradually reduced and then increased
again. During his first session of system use he completed a range of activities for three nodes in the first
phase of the curriculum. All instances of successful help were at level 4 or level 5. Fewer activities were
completed during his second session. However, these activities were at a lower level of differentiation
and there were fewer instances of help. This Collaboration Profile group was the largest and was
subdivided to account for the type of support used. Jason was a member of the subgroup which used
above average amounts and levels of both activity differentiation and help.
Benefits gained from the documentation of collaborations with the Ecolab
The results from our analysis of the Ecolab I software using the documentation technique described
above highlighted the benefits that accrue when learners are challenged and intellectually extended. It
also illustrated the difficulty that such young learners have in achieving this intellectual extension without
explicit direction from the system. The findings of this evaluation proved to be consistent with the
findings of Wood (Wood and Wood 1999) and indicated that less able and less knowledgeable learners
were especially ineffective at selecting appropriately challenging tasks and seeking appropriate qualities
and quantities of support and guidance (Luckin and du Boulay 1999; Wood and Wood 1999). The
documentation and analysis of children‟s interactions and collaboration with the Ecolab I software
enabled us to identify the areas for development upon which we wished to focus in our production of the
Ecolab II software. This second generation of the Ecolab explored how software scaffolding at the
needs, at seeking appropriate challenges and appropriate support. Our goal was the production of a system
which could assist a learner to take more control for her own extension, which modelled a learner‟s
developing collaborative skills as well as her developing understanding of the curriculum ( for more
information on Ecolab II see (Luckin and Hammerton 2002))
3.2 Two dimensional collaboration: documenting groups collaborating around and with a multimedia CD-ROM
The documentation technique used with the Ecolab software charted a single dimension for collaborative
activity: a user‟s collaborations with a piece of software. The next step in our development of the
documentation required us to chart a second dimension of collaborative activity. The software in question
was a multimedia CD-ROM designed for use by groups of older learners as they co-constructed a textual
narrative about their understanding of Darwin‟s theory of evolution (Luckin, Taylor et al. 1998). In this
second learning situation, interactions were between learners around the computer as well as between the
computer software and the learners. This was a more complicated situation and the original one
dimensional chart used for interactions between a single learner and software had to be expanded into a
two dimensional chart that could represent the interactions in-between learners as well as those between
learners and the CD-ROM. On this second occasion interactions were captured via two video sources,
one of the computer screen and the other of the learners. The video data was then transcribed and coded.
The categories used for the dialogue between learners as they used the CD-ROM were carefully selected
in order to enable us to differentiate the times when learners were focusing on procedural or operational
issues from the times when they were trying to construct an understanding of the underlying concepts
about evolution (see (Luckin, Plowman et al. 1998; Luckin, Plowman et al. 2001) for more detail about
the methodology). The resultant graphical representation was called the Chronologically Ordered
Dialogue & Features Used (CORDFU) chart and was the development of the original annotated user log
Exa mple CORDFU 0 1 2 3 4 5 6 7 8 9 10 11 12 13 14 15 16 17 18 19 20 21 22 23 24 25 26 27 1
0 = Di al og ue, X = CD-ROM featu re
C D -R O M S e ct io n O R D ia lo g u e C a te g o ry ( se e k ey )
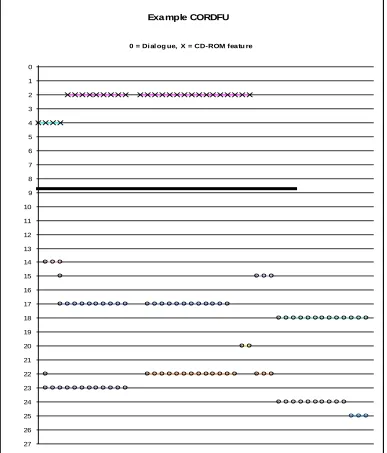
Figure 4 A section from a CORDFU chart
CD-ROM Features Dialogue Categories
2= Introduction 20 = Non-Task
4 = Section 2 About Islands 21 = Task
14 = Search 22 = Content: Sub-goal formation
15 = Guide 23 = Content: Reaction to MM
17 = Notepad 24 = Content: Answer text Construction
In Figure 4, the upper part of the vertical axis (above the bold horizontal line) records the different
features of the CD-ROM: the introductory section, the eight sections containing material about Darwin,
Galapagos and evolution, facilities such as the search engine and tools such as the notepad. The lower
part of the vertical axis (below the horizontal line) records the categories of talk. Only the names of the
features and categories present in the example have been included in Figure 4 to avoid confusion; all
information is present during analysis. The horizontal axis records the amount of attention paid to a
feature or dialogue category. The horizontal unit of measurement is a text unit that comprises up to 24
characters of dialogue text1. An X on one of the upper horizontal lines therefore indicates that one text
unit worth of time has been spent with the CD-ROM feature specified. A O on one of the lower
horizontal lines indicates that the text unit occurring at this point in the dialogue has been coded as
belonging to the category specified. For each X recording a CD-ROM feature there is a O indicating the
type of talk that occurred whilst this feature was in use. So, in the example CORDFU extract in Figure 4
we can see that the group of learners it represents used the notepad in conjunction with the introductory
section whilst discussing their reactions to the multimedia and the practicalities of constructing an answer
to the set task
Example: A group of learners using Galapagos and the associated CORDFU representation
Four groups of three students, aged between 15 and 21 years, used Galapagos. The 36 students were
based in two different institutions and all were studying for a national examination in Biology. A session
using Galapagos and completing the task (to explain the variation in the wildlife on the Galapagos
Islands and write the answer in the Notepad) to their own satisfaction typically took about 45 minutes.
The goal of our analysis was to understand: what was happening at the system interface; what was
happening between individual learners in the group; and what sort of an understanding individual learners
were constructing as a result of these collaborative interactions. In addition to exploring these three
aspects in their own right we also wished to unpack the relations between them; to answer questions such
as: what sort of interactions occurred between learners when they were using feature X? We therefore
investigated the relationship between the content and themes within the learners‟ dialogue and the
structures and features existing within the CD-ROM.
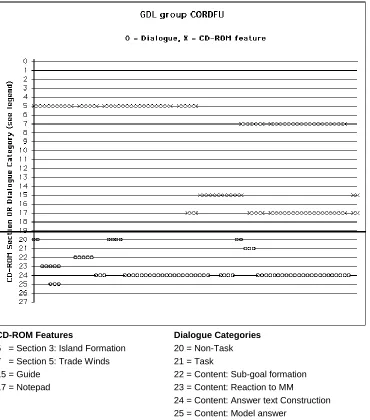
CD-ROM Features Dialogue Categories
5 = Section 3: Island Formation 20 = Non-Task
7 = Section 5: Trade Winds 21 = Task
15 = Guide 22 = Content: Sub-goal formation
17 = Notepad 23 = Content: Reaction to MM
24 = Content: Answer text Construction 25 = Content: Model answer
Figure 5. A section from a User Group CORDFU chart
We present an extract from the results of this study to illustrate how the CORDFU documentation
enabled us to explore how learners used the various system features. To illustrate this we present a
section from a CORDFU representation along with a description of the Galapagos session for the group
of learners whose interactions are represented within that CORDFU. This example is used as a focus for
a discussion of the way in which groups using this system version used the CD-ROM features available to
them. Figure 5 presents a section of the CORDFU for one group learners. In this section the Guide tool
is being used to navigate between two sections of content material: “Island Formation” and “Trade
Winds”. Most talk is content related, both when the information about islands and trade winds is on
screen as well as when these are used in conjunction with the on-line notepad. They talk about the
importance of the Galapagos being an island and how this relates to the task.
Benefits gained from the documentation of collaborations with the Galapagos
The Galapagos study was designed to help us clarify our understanding of how learners use multimedia
and how system design can impact upon learner experience. We have presented one example of users
interacting with the Galapagos CD-ROM. The use of the CORDFU documentation technique allowed us
to elicit a great deal about how learners used the different software features within the CD-ROM. For
example, we were able to ascertain that the software guide helped users make connections and build links
between the task they had been set and the individual elements of content, for example. One of the
outputs from the Galapagos analysis was a set of guidelines for multimedia designers for example:
Guideline
Use narrative guidance features to guide the learners to the internal structure and content of the given
narrative, its supporting arguments and evidence. To achieve this include:
A „Goal‟ to provide a coherent framework for the given narrative;
„Reminders‟ of the goal, to keep the structure of the narrative in focus
A „Guide‟ to sub-goals or essential components or investigations, to help learners relate their
investigations to the structure of the narrative;
A „Model Answer‟ whose content and structure, once revealed, will provide formative feedback on
their own account, which can then guide them towards further investigations.
But the focus of this research was to identify fundamental characteristics of the learning conversation
these contexts and expect to generate a more effective learning experience as a result. A vital component
in the success of this work was the analysis of the collaborative interactions recorded through the
CORDFU documentations technique. The expansion of the original Ecolab methodology to the
Galapagos work necessitated the inclusion of an additional dimension to the collaboration to track what
happened in between individuals in a group of learners as well as between those learners and software.
3.3 Multi dimensional collaboration: documenting children collaborating with multiple interfaces
The final example and the latest stage in the evolution of our approach to the documentation of
collaborative interactions is part of the CACHET research project, which aims to construct an explanatory
framework for the interaction and mediation engendered by digital toys. The electronic toys used in this
project are freestanding soft toys that can move, speak and respond to a child‟s touch. They can also be
„linked‟ to a PC with a special unit that transmits information between the toy and the computer (although
no cables are required). In freestanding mode (they are about 30 cm tall) these toys superficially appear
like traditional soft toys but they have motors to provide limb and head movement and a ROM chip so
they respond to inputs. The toys can gesture, using programmed motion, and speak, using a digitised
vocabulary of more than 4,000 words, so they can play simple games. Interaction operates through
sensors located in parts of the toy‟s body, each of which controls a different function. Combined with
compatible software, this enables further interaction through educational games. The software encourages
basic language and number skills and the toy can comment on the child's interaction, provide feedback
and give support. The software increases the toy‟s vocabulary to 10,000 words and the toys can receive
radio signals more than 3 metres away from the transmitter at the PC. The child is therefore no longer
interacting solely with the computer or solely with the toy, but is also interacting with their toy that, in
turn, interacts directly with the computer and mediates the child‟s actions.
In an initial pilot study children (aged 4 and 5 years) enjoyed interacting with the toys and the
software. Although some of the memory and alphabet games featured in the toy repertoire proved beyond
the interface within a short period of time. However, a number of important individual differences in
interaction style began to emerge. On one hand for example, some children tended to use the toy simply
as a pretend item – using it much as children would use a teddy bear, making it walk and pretending that
it spoke to them, while ignoring the toy‟s interactive repertoire. On the other hand, some children were
very attentive to the vocalised prompts from the toy, and endeavoured to interact with it to the best of
their ability. When interacting with the software, the comparison between the radio controlled toy and the
on-screen icon proved interesting. The pilot studies, then, have confirmed the need to document the
different types of interactions that occur between child, toy and computer. Two of the research questions
that are driving our current work are:
To what extent do children understand the toy interface: do they interact with toy‟s repertoire, or
simply use it as a teddy bear that makes noises?
Where is the interface for communication and collaboration when children interact with the toy and
the computer software?
It is to these questions that the remainder of this case study turns. In particular we consider how we
have developed the CORDFU charts to document the interactions effectively.
Adapting the CORDFU chart for more than 2 dimensions of collaboration
Within our empirical work we have concentrated upon capturing data about the process of the interactions
that occur with digital toys. We have also collected performance based data on individual participants in
order to enrich our understanding of the profiles of the children that engage in particular sorts of
interactions either with the technology or with other children around the technology. The study was
divided into three stages:
Stage 1: Children (individually and in pairs) were introduced to the toys and allowed to play with them for a period of up to 15 minutes. During this time a functionality checklist was used to ensure
Stage 2: Children were divided into two groups. Children in Group A were introduced to the
software without the toy, the character would instead appear as an animated icon on screen. Children
in Group B used the software with the toy activated as an interaction partner. As in Stage 1, the
functionality checklist was used to ensure that all the children participated in a common core set of
interaction types.
Stage 3: Semi-structured interview. Children‟s conception of the toy was assessed by a scripted
interview. All children also completed the WPPSII (Weschler Primary and Preschool Intelligence
Inventory) to assess their verbal and non-verbal ability.
Video was once again our primary data source with all of the sessions in which the children interact
with either the toy an/or the toy software being recorded on digital videotape, as were the post-interaction
interviews. The screen image when the software was in use was also captured on standard analogue
videotape through the use of a scan converter and VCR. The original CORDFU representation of Figure
4 allowed us to integrate information from two dimensions: the first was the path navigated through the
CD-ROM by each group of users, the second was the category of talk that occurred between the learners
when a particular CD-ROM feature was in use. The new version of this representation that we have
created and which will be presented for discussion here required the addition of 2 further dimensions
Dimension 1
Children‟s use of software features and any dialogue between on screen characters within the
software
Dimension 2 Dialogue between children or between researcher & children
Dimension 3
Children‟s use of toy features and „dialogue‟ with the toy (sensor squeezes, cuddling etc.)
We do still need a Chronologically Ordered Record of Dialogue & Features Used (CORDFU). But
in this instance we need to differentiate the locus of the Features Used to specify at which interface they
occur (toy or software), we also need to add the interactions that occur between these two: the toy and the
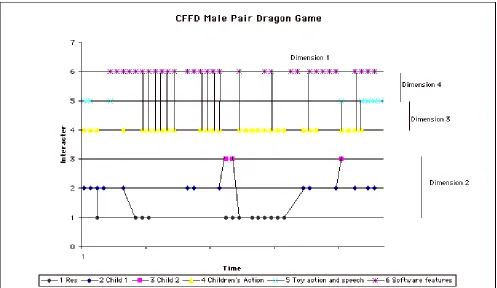
software. The new charts provide a Chronologically ordered record of Features in use, Focus of
interactivity and Dialogue (CFFD). Figure 6 illustrates a small section of a CFFD chart. Each horizontal
line shows one of the categories of speech and action that can be performed by the interactors in this
session: the researcher, the children, the toy and the software. These actions make up the interactions
along the four dimensions identified above. The links between the horizontal lines indicate the
interactions between the participants along these dimensions.
Figure 6. A section from a CFFD chart for two children using the toy and software
As yet it is early days for the CACHET project data analysis and the documentation techniques being
developed are very much work in progress. However, our initial results are positive and lend weight to
the suggestion that new technologies do not necessarily require new forms of documentation. For
as in the example used in Figure 6 than when the toy is not present and the software alone is offering the
functionality. In stage 2 of our study children were divided into two groups: children in Group A are
introduced to the software without the toy, the toy character appears as an animated icon on screen
instead; children in Group B use the software with the toy activated as an interaction partner. The
increased social activity is indicated by greater activity along dimension 2 in the CFFD charts of children
whose interactions include the toy as well as the software.
4CONCLUSIONS
In this paper we have discussed the challenges posed to the CSCL researcher by the changing use of
technologies for collaboration. A technique for the documentation of collaboration, used originally in a
traditional and single learner context has been presented and explained. Its potential for application in
further CSCL contexts involving groups and novel technology has been discussed. It is clear that tried and
tested techniques can be adapted and re-used, provided the foci of interactivity are clearly specified and
the appropriate data sources identified. The technique discussed is one approach and is offered, along
with suggested adaptations to motivate discussion and further work. Of course, it is both reasonable and
pertinent to consider the following question: If it is the collaborative interactions between learners or
between learners and technology that we aim to document and analyse, why should the nature of the
technology make any difference? It is, after all, merely the channel for communication and not the focus
of attention. This question is one that can only really be addressed by actually trying to devise a means of
documentation and it is to this that our work has paid attention.
5ACKNOWLEDGEMENTS
The CACHET project is funded by the joint UK EPSRC/ESRC PACCIT initiative. The work is
conducted in collaboration with Dr Daniel Connolly at Sussex University and with Dr Lydia Plowman
and Sharon Airey at Stirling University. The BETV broadcasting project, and subsequent work on
Broadband Interactive TV is conducted in collaboration with Professor Benedict du Boulay at Sussex
Research Council. We are indebted to the schools, teachers and students who made this research
possible. We are also indebted to the BBC/Open University Production Centre, the Open University
Science Faculty and Matthew Stratfold for the Galapagos Pilot CD-ROM.
6REFERENCES
Don, A. (1992). Anthropomorphism: from Eliza to Terminator 2. Proc. CHI‟92: 67-70.
Fogg, B. J. (1999). Moderator of panel on Is ActiMates Barney Ethical? The Potential Good, Bad and Ugly of Interactive Plush Toys. Proc. CHI‟99, Pittsburgh: 91 - 92.
Goodyear, P., Njoo, M., Hijne, H. and van Berkum, J. J. A. (1991). “Learning processes, learner attributes and simulations.” Education and Computing 6(3/4): 263-304.
Groat, A. and T. Musson (1995). “Learning styles: individualizing computer-based learning environments.” Association for Lerning Technology 3(2): 53-62.
Johnson, M. P. (1999). Sympathetic Interfaces: Using a Plush Toy to Direct Synthetic Characters. Proceedings of CHI‟99, Pittsburgh: 152-158.
Luckin, R. and B. du Boulay (1999). “Ecolab: the Development and Evaluation of a Vygotskian Design Framework.” International Journal of Artificial Intelligence and Education 10(2): 198-220.
Luckin, R. and L. Hammerton (2002). Helping Learners help themselves with Ecolab II. Human Centred Technology Group meeting, University Sussex.
Luckin, R., L. Plowman, et al. (1998). An Evaluator's Toolkit for Tracking Interactivity and Learning. Innovation in the Evaluation of Learning technology. M. Oliver. London, University of North London: 42 - 64.
Luckin, R., L. Plowman, et al. (2001). “Narrative evolution: learning from students' talk about species variation.” International Journal of Artificial Intelligence in Education 12: 100-123.
Luckin, R., J. Taylor, et al. (1998). Galapagos: developing a CD-ROM to explore learners‟ responses to different narrative styles. Intelligent Tutoring Systems, San Antonio, Texas.
Luckin, R. H. (1998). Ecolab: Exploring the construction of a Learning Assistant. Intelligent Tutoring Systems: 4th International Conference, ITS'98. B. P. Goettl, H. M. Halff, C. L. Redfield and V. J. Shute. Berlin, Springer. 1452: 304 - 313.
Pask, G. (1976). “Styles and strategies of learning.” British JOurnal of Educational Psychology 46: 128-148. Resnick, M. (1998). Digital Manipulatives: New Toys to Think With. Proc. CHI „98, Los Angeles.: 281-287. Riding, R. and S. Rayner (1995). “The information superhighway and individualised learning.” Educational Psychology 15(4): 365-378.
Strommen, E. and K. Alexander (1999). Emotional Interfaces for Interactive Aardvarks: Designing Affect into Social Interfaces for Children. Proc. CHI‟99: 528-535.
Valley, K. (1997). “Learning styles and courseware design.” Association for Learning Technologies Journal 5(2): 42-51.
Wood, D. J., Wood, H. A. & Middleton, D. J. (1978). “An experimental evaluation of four face-to-face teaching strategies.” International Journal of Behavioural Development 1: 131-147.