Contact-patch-size distribution and limits of
self-affinity in contacts between randomly rough
surfaces
Martin H. Müser* and Anle Wang
1
2
3
4
5
6
7
8
9
10
11
12
Dept.ofMaterialsScienceandEngineering,UniversitätdesSaarlandes,66123Saarbrücken,Germany * Correspondence:[email protected]
Abstract:Truecontactbetweensolidswithrandomlyroughsurfacestendstooccuratalargenumber of microscopiccontactpatches. Sofar,twoscalingregimeshavebeenidentifiedforthenumber density n(A) of contact-patchsizes A in elastic, non-adhesive, self-affinec ontacts.A ts mall A,
n(A)isapproximatelyconstant,whilen(A)decreasesasapowerlawatlargeA. UsingGreen’s functionmoleculardynamics,weidentifyacharacteristic(maximum)contactarea Acabovewhicha superexponentialdecayof n(A)becomesapparentifthecontactpressureisbelowthepressurepcpat whichcontactpercolates.Wealsofindthat Acincreaseswithloadrelativelyslowlyfarawayfrom contactpercolation.ResultsforAccanbeestimatedfromthestressautocorrelationfunction Gσσ(r) withthefollowingargument:theradiusofcharacteristiccontactpatches, rc,cannotbesolargethat
Gσσ(rc)ismuchlessthanp2c.Ourfindingsprovideapossiblemechanismforthebreakdownofthe proportionalitybetweenfrictionandwearwithloadatlargecontactpressuresand/orforsurfaces withalargeroll-offwavelength.
Keywords:surfaceroughness;contactmechanics;friction;wear;Amontons’law;Archard’slaw 13
1. Introduction 14
As stated in Amontons’ law and Reyes-Archard’s’ law, friction and wear in many mechanical 15
contacts turn out to be approximately proportional to the load but are independent of the apparent 16
contact area, unless normal stresses are very large [1,2]. These two observations can be easily 17
rationalized for randomly rough surfaces [3]: The distribution of contact stresses in macroscopic 18
contacts – when normalized to the true contact area – barely changes with load, unless the relative 19
contact areaar clearly exceeds 10% [4–6]. Thus, increasing the normal load does not mean (much) 20
more extreme local contact stresses but a larger number of contact spots [5,7,8]. Loosely speaking, 21
increasing load leads to more of the same, i.e., doubling the load – at small loads – is expected to 22
induce roughly twice the number of contact patches having a given real contact areaA. Amontons’ and 23
Reyes-Archard’s laws follow unless friction and wear processes are non-local or sliding dynamics [9] 24
or wear [10,11] are strongly effected by the number-density of contact patches. 25
The analysis of the contact-patch-size distributionn(A)supposedly started with an experimental work by Dieterich and Kilgore [12], who found evidence for an algebraic decay with increasing patch areaA– in contacts between quartz, calcite, and glass with acrylic plastic – according to
n(A)∝A−τ. (1)
The value of the exponentτ was found to be between one and three. However, when the fitting
26
range included large domains, a value ofτ . 2 turned out to be most likely. Simple models for
27
contacts produced by cuts through randomly rough, self-affine surfaces [13,14] also found power 28
law distributions, in which the exponentτwas found to obeyτ = 2−H/2, where His the Hurst
29
roughness exponent, which is defined in the method section. This result reproduced the experimental 30
observation of an increasing exponentτwith decreasing H. First contact-mechanics simulations
31
of randomly rough rough surfaces could not confirm this trend [7]. However, in hindsight, these 32
simulations may have suffered from insufficiently fine spatial discretization cells, and perhaps more 33
importantly – given the results of this study – the power law may have been fitted to the branch of 34
then(A)distribution on whichAis too large to obey the power-law scaling. Later, the same group 35
considered larger-scale simulations as well as finer resolution and also included plasticity, which lead 36
them to revise their estimate toτ≈2 [5].
37
Ten years ago, Campaña [8] run even larger-scale simulations of system sizes going up to 4096×
38
4096 discretization points of the elastic solid, allowing him to obtain good resolution of contact at small 39
scales. This proved to be important to identify a new scaling regime at smallA, wheren(A)turned out 40
approximately constant and where individual clusters on that branch obeyed the area-load relation for 41
Hertzian contact, namelyA∝L2/3. For larger-scale clusters, he identified the scaling relation of Eq. (1) 42
to hold. These patches showed a linearA(L)relation on anindividualbasis. Campaña’s data was again 43
consistent with a decrease ofτwithH, however, no clear claim was made, or could be made, if the
44
τ=2−H/2 relation also applied to elastic contacts. Similarly, a recent study by Molinari’s group [15],
45
foundτto be close to but not necessarily identical with the exponent obtained from cuts through
46
Gaussian surfaces. As Campaña superimposed different distributions functionn(A)for different 47
loads, the impression could arise that the predominant effect of doubling the load is an approximate 48
doubling the number of contact patches of a given size. 49
The increasing-load-only-leads-to-more-of-the-same dictum cannot be exact. For any given finite 50
contact, there exists a largest contact patch, the size of which should generally increase with load. 51
Two growth mechanisms exist: A continuous growth process due to contact lines being pushed out 52
further when a patch carries more load – as it happens, for example, in an isolated Hertzian contact – 53
and a discontinuous mechanism, which is due to the merging of two patches into a single one. The 54
latter process requires contact formation at a saddle point, as described in Ref. [16], and as modeled 55
quantitatively in an advanced bearing model, which accounts for the merging of and the elastic 56
interaction between contact patches [17,18]. 57
The existence of a largest patch implies that then(A)∝ A−τcannot extend to arbitrarily large 58
A. In fact, numerical data produced forn(A)with high local resolution reveals a strong reduction 59
ofn(A)for large patch sizes compared to the self-affine scaling regime [8,15,19]. This brings up the 60
question if there is a characteristic patch sizeAcabove which the scaling relation no longer holds even 61
in an infinitely large system, or, if the existence of a largest cluster is merely a finite-size effect, as a 62
prominent theorist suggested in a personal communication to the authors. 63
In this paper, we argue that there is a maximum characteristic patch size, above which then(A)∝ 64
A−τ relation breaks down. The main reason, on which we also base our estimate for characteristic 65
contact areas is related to the following argument: Contact seizes to be connected with a significant 66
probability when the expected (square of the) stress at a distancerfrom a given contact point has fallen 67
below the (square of the) pressurepcp, at which contact percolates macroscopically. By definition, this 68
distance is finite when the mean contact pressurep0is less thanpcpand infinite (in the thermodynamic 69
limit) whenp0>pcp. 70
The remainder of the article is organized as follows: Sect.2introduces our contact model and the 71
methods with which we solve the model; it defines the quantities of interest and also contains our 72
theoretical estimates on the range of validity for the self-affine scaling regime. Results are presented in 73
Sect.3, while conclusions are drawn in Sect.4. 74
2. Model, methods, and theory 75
2.1. Model 76
Our model consists of a rigid, perfectly rough indenter and a perfectly flat, linearly elastic 77
approximation [20], results obtained for the system apply to other cases, in which roughness and 79
compliance are distributed more evenly between the two solids. 80
The indenter is set up as a randomly rough substrate whose height spectrumC(q)≡ h|h˜(q)|2i satisfies
C(q) = C(0)Θ(qs−q)
{1+ (q/qr)2}(1+H)/2
, (2)
where H is the Hurst roughness exponent, qr is the roll-off wavevector, and qs the wavelength associated with the short-wavelength cutoff. This shape of the height spectrum is motivated from experimental observations [21–24]. The Fourier transform of the height profile is drawn according to
˜
h(q) = q
C(q)e2πiv(q), (3)
wherev(q)is a uniform random number on(0, 1). With the such-defined height spectrum, the mean 81
square of the height difference is proportional to∆r2Hwhen the two points, at which the height is taken 82
are a distanceq−s1∆rqr−1apart and it levels off to the mean-square roughness forrqr−1[25]. 83
We chose the valueC(0)such that the root-mean-square (rms) height gradient turns out to be ¯g=1. 84
In this study, we use different ratios for L/λr, λr/λs, and λs/a, where L is the linear
85
dimension of the periodically repeated domain, and athe discretization length. Sensible choices 86
for these dimensionless numbers depend critically on the Hurst exponent, the load, and the type of 87
observable [26]. For example, detecting contact at small pressure and small Hurst exponents requires 88
a much finer discretization than at large pressures and large Hurst exponents. The dimensionless 89
numbers used in this work span 1≤ L/λr <16, 64≤λr/λs≤2048, and 2≤λs/a≤32. The largest
90
simulated systems were 215×215grid points. 91
The areal elastic-energy density of the counterbody is taken to be
Vela =
E∗
4
∑
q q|u˜(q)|2. (4)
The interaction between indenter and counterbody consists of a non-overlap constraint. To reduce 92
finite-size effects, periodic boundary conditions are employed in the interfacialxyplane. 93
Since this paper uses many different variables and abbreviations, table1summarizes the most 94
important definitions. Some of the variables in this table have not yet been introduced up to this point. 95
2.2. Methods and Observables 96
In this paper, we use the Green’s function molecular dynamics (GFMD) method, in which the 97
˜
u(q)are the degrees of freedom propagated in time [27,28]. To speed up convergence, we combine 98
two optimization methods, namely mass-weighted dynamics and the so-called FIRE algorithm [29], as 99
described recently [30]. The main idea of mass-weighting is to assign smaller inertia to the originally 100
slow long-wavelength modes such that the system’s intrinsic frequency collapse as well as possible, 101
while FIRE is an optimization scheme, which is predominantly an on-the-fly adjusted compromise 102
between Newtonian and steepest-descent dynamics. 103
Due to the progress of the GFMD method, all simulations could be run on single cores, though 104
systems exceeding 8k×8k can only be simulated on computers with significant memory. Relaxation 105
of a typical simulation of size 4k×4k andar = 0.1 to six relevant digits in the displacement field 106
necessitates roughly 1 hour on a standard desktop computer, where, however, preequilibration on 107
systems with less fine discretization is needed. Quadrupling the number of grid point to 8k×8k takes 108
Table 1. Definitions of the most important variables and abbreviations.
β exponent in theAc∝aβr relation, valid at low-pressures forH>0.5
γ exponent in theAc∝1/(acp−ar)γrelation, valid for large systems just belowpcp
εc, εf εc=a/λs,εf=λs/λr
κ dimensionless proportionality coefficientar/p∗
λr,λs roll-off wavelength and short-wavelength cutoff
σ stress
τ exponent in then(A)∝Aτrelation
A area of an individual contact patch Ac characteristic contact-patch area
Amin crossover area from Hertz to self-affine scaling
ACF autocorrelation function C(q) height spectrum
E∗ contact modulus Gσσ(r) stress ACF
GFMD Green’s function molecular dynamics H Hurst exponent
L load or normal force
a discretization length used in the simulation acp relative contact area at percolation threshold
ar relative contact area
¯
g rms height gradient ¯
h rms height
h(r), ˜h(q) height in real-space and Fourier representation n(A) number density of contact-patch areas
p0 nominal contact pressure
p∗ dimensionless contact pressurep0/E∗g¯
pcp pressure at contact-percolation transition
q,q wave vector and its magnitude qr,qs qr=2π/λr,qs=2π/λs
r,r in-plane vector and its magnitude rc characteristic patch radius
√
Ac/π
rms root-mean square
There are two central quantities or observables of interest in this paper. First, the contact-patch size distributionn(A)defined in the introduction including quantities that can be derived from it, such as a characteristic cluster size. We define the latter as
Ac≡ R
dA n(A)A2 R
dA n(A)A, (5)
which is also known as the contraharmonic mean. It gives the expectation value of the contact patch 110
size that a randomly picked contact point – not patch (!) – belongs to. Unlike the first moment ofn(A), 111
the measureAcremains invariant when a patch of size zero is added to or removed from the statistics. 112
In order to obtain accurate results for contact areas, a fine discretization is required, or, alternatively well-chosen observables that correct for deviations from the continuum limit. In this respect, it may be worth discussing the suggestion by Yastrebovet al.[31] to estimate the size of contact patches according to
An(0)≈ An(εc)−caLn(εc), (6) wherecis a dimensionless fit parameter,εc ≡ a/λs, An(εc)the contact-patch size of clusternat a 113
given real-space discretization ofεc, andLn(εc)is the length of the contact line. We found that these 114
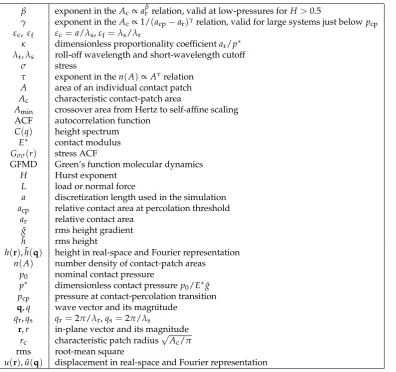
corrections are indeed very useful when applied to thetotalcontact area and thus the ratioκbetween
115
relative contact areaarand reduced pressure p∗0 ≡ p0/(E∗g¯). Unlike Ref. [31], we foundc =1/8, 116
rather thanc=π/8, to work very well, as demonstrated in Fig.1. The origin of this discrepancy is not
117
quite clear to us. 118
0
0.1
0.2
0.3
0.4
0.5
ε
c2.0
2.2
2.4
2.6
2.8
κ
H = 0.3, orginal H = 0.3, corrected H = 0.8, orginal H = 0.8, corrected
Figure 1. The dimensionless coefficientκas a function of the discretization obtained with and without
continuum corrections forH =0.3 andH = 0.8. A value ofc = 1/8 was used in Eq. (6) for the corrected contact area.κ≡ar/p∗0, wherep0∗≡p0/E∗g¯is the reduced pressure. System specification: L/λr=1,λr/λs=256,p∗=0.04.
We note in passing that the values ofκpresented here are not meant as new best possible estimates
119
for howκdepends onH. To improve current standards, disorder averaging as well as extrapolation to
120
large systems(λr/L →0)and to the “fractal limit”εf≡(λs/λr →0)is needed besides continuum 121
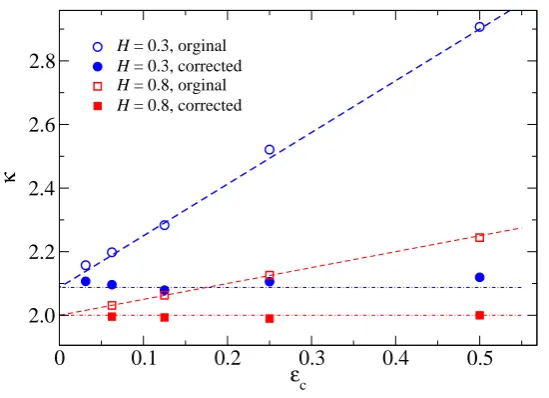
Unfortunately, the determination of the characteristic contact-patch size is adversely affected by 123
the patch-size corrections, which is demonstrated in Fig.2. We rationalize this negative result with 124
the observation that clusters may break up or unite when the accuracy of the calculation is increased 125
by decreasingεc, the latter process happening with a greater probability. These two processes have
126
essentially no effect on the net contact area but can leave significant traces in the determination of 127
Ac, in particular near the percolation threshold and/or in the vicinity of a pressure where two large 128
clusters merge. We nevertheless attempted to ensure that the (deterministic) uncertainties ofAc, which 129
are due toεcbeing finite, are well below 20%. This was done by simulating each individual random 130
realization with at least three values ofεc.
131
10
12
14
16
18
20
A
c/
A
minoriginal corrected
0
0.1
0.2
ε
0.3
0.4
0.5
c
300
350
400
450
500
A
c/
A
minoriginal corrected
H = 0.3
H = 0.8
Figure 2. Characteristic contact area with and without continuum corrections as a function ofεc=a/λs.
System specifications:L/λr=1,λr/λs=512,p∗0=0.04.
The second central observable is the stress autocorrelation function (ACF). Here, we define it as
Gσσ(r)≡
hσ(r0+r)σ(r0)i
ar , (7)
where h. . .idenotes an average over all interfacial pointsr0. In this definition, the stress ACF is 132
normalized to the true contact area to facilitate comparison of results for different pressures, while 133
the text in the abstract assumes no division byar. With the definition in the main text,Gσσ(0)is the 134
second moment of the stress averaged over true contact only andGσσ(r)tends to p02/arforr→∞. 135
In a previous work [25], we had subtractedp2
0from the numerator on the r.h.s. of Eq. (7), in order to 136
makeGσσ(r)go to zero at larger. 137
2.3. Theory 138
In this section, we propose simple arguments for the estimation of the range of values ofA, in 139
the relation for smallAatAminand for largeAatAmax. We note thatAmaxis strongly correlated with 141
– or even close to – the characteristic patch sizeAcif the exponentτsatisfiesτ<2.
142
To set the stage for the discussion, we note that we only consider systems that are homogeneously 143
loaded with normal stress, acting on the elastic solid’s surface opposite to the interface. Likewise, the 144
roll-off domain (L/λr) is assumed to be large enough, in order for finite-size effects [32] to be minor.
145
2.3.1. Rough estimate ofAmin 146
The maximum radius of curvatureRcof a single, one-dimensional sinusoidal height wave satisfies
Rc= D 1 2h002E1/2
, (8)
where the expectation value is taken over an integer multiple of a (half) wavelength. In the following, 147
we assume this relation to also apply to the maxima of randomly rough surfaces. We kept the factor of 148
two in the denominator on the r.h.s. of Eq. (8) for heuristic reasons. The such obtained value ofRcis 149
then used to relate the contact area of typical small Hertzian contact patches with the load they carry 150
via with the well-known equationA(L) =π(3LRc/ 4E∗)2/3. 151
For self-affine patches, the macroscopic relationA= κL/E∗holds with little statistical scatter on an individual basis. The cross-over between the two power laws occurs at the load where both equations predict the same contact area at the same load. This leads to a cross-over area of
Amin= 9π3 32κ2(Rcg¯)
2, (9)
between Hertzian and self-affine scaling ofAn(Ln), which thus constitutes an approximation for the 152
minimum area on the self-affine branch. 153
When the scaling regime of the self-affine roughness extends over many decades, the term(Rcg¯)2 154
can be readily estimated to be 155
(Rcg¯)2 = Rqs
0 dq q q2q
−2−2H
3 16
Rqs
0 dq q q4q−2−2H
(10)
⇒Amin ≈ 3
π(2−H) 16κ2(1−H)λ
2
s. (11)
For a precise determination ofAmin, it might be in place to introduce a scale-dependent radius of 156
curvature. However, we do not see that such a detailed treatment adds much to our rough estimate, 157
which we are interested here and which actually turns out to be quite reasonable. Conversely, the 158
calculation needs to be altered when short-range adhesion is present. In the latter case, small contact 159
patches are no longer stable, which effects the functional form ofn(A)at smallAand the cross-over to 160
the self-affine scaling regime [33]. 161
In the results section, patch sizes are reported in units ofAmin. For this quantity, Eq. (11) is used 162
with the value ofκ=2 and the analytical result for(Rcg¯)2. This choice facilitates the interpretation 163
of the data, even if potentially more accurate guesses could be obtained forAmin, e.g., by taking into 164
account the weakκ(H)dependence and the exact value of(gR¯ c)2. 165
2.3.2. Rough estimate ofAmax 166
dropped below the square of the minimum, macroscopic pressure pcp needed to induce contact percolation. This gives a characteristic patch radiusrcsatisfying
Gσσ(rc).
p2cp
acp (12)
atp0< pcp. 167
For p > pcp, the value ofGσσ(rc) must obviously turn out greater than p2cp/acp, sincercp is 168
divergent (in the thermodynamic limit) and thus the ratio ofGσσ(rc)simply becomesp20/ar. Right at 169
the percolation threshold, the percolating cluster is also infinitely large so that the equalityGσσ(rc) = 170
p2cp/acpmust hold. With increasing distance from the percolation point, e.g., with decreasing pressure, 171
it then appears reasonable thatGσσ(rc)keeps getting smaller. However, it is counterintuitive that it 172
can drop by as much as a factor of ten for realistic values ofεf.
173
Let us estimate the value of p2cp/acp. While subtle differences for thea(p)relation between differentHexist, we use an overall fit [Eq. (15) in Ref. [35]] to numerical data [26], in order to get a first guess for the r.h.s. of Eq. (12). We consider the data of Ref. [26]] to be reliable from no to complete contact, as it actually includes finite-size as well as fractal corrections in addition to continuum corrections. It turns out that the linear relation betweenacandpis reasonable up to the percolation point, partly because the leading-order corrections to the lineara(p)relation are of orderp30. Thus, our first guess for the characteristic patch radius atp< pcreads
Gσσ(rc).0.1(E
∗g¯)2, (13)
due to the well-known ar = κp∗0 approximation, which is valid at a small reduced pressure of
174
p0∗≡p0/(E∗g¯)with a numerical value ofκ≈2 [6,7,26,31,36,37].
175
3. Results 176
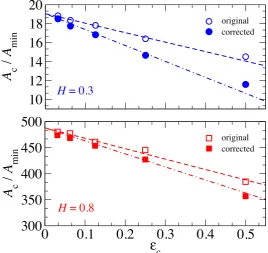
To set the stage for a later discussion, results of a medium-sized contact-mechanics simulation 177
are shown in Fig.3, in which the relative contact area has been obtained toar = 0.02. The figure 178
reveals that the real contact area becomes roughly isotropic for aH=0.8 surface when averaged over 179
apparent contacts clearly exceedingλ2r. It also shows that there are many more small than large contact
180
patches. Yet, most contact points belong to large patches. Moreover, the linear size of the largest cluster 181
shown in the circular call-out box corresponds roughly to twice the value ofr, at whichGσσ(r)has 182
fallen to 0.1(E∗g¯)2, which defines a rough estimate of a characteristic patch radius. 183
We begin our quantitative analysis with a reproduction of the trends published by Campaña 184
on the load-area relation of individual contact patches in Fig.4. An added value with respect to the 185
original data is the realization that the estimate for the contact area at which the HertzianA∝L2/3 186
scaling crosses over to the linearA(L)relation for self-affine patches is quite reasonable. After coarse 187
graining load and area over many patches in an intervalA< A0 < A+∆A, we always found the 188
A(L)running averages to lie within 20% of the running averages, deviations being obviously largest 189
near the transition from the Hertzian to the self-affine branch. 190
Fig.4also gives a clue as to why the dimensionless proportionality coefficientκ=ar/p∗0increases
191
with decreasing H. A smaller value for H clearly leads to more small patches lying above the 192
(extrapolated) lineA=AminL/Lmin, which was drawn in Fig.4both times assuming a value ofκ=2.
193
At the same time, the relative weight of large clusters becomes smaller. It turns out thatAminis not 194
sensitive to the dimensionless numbersL/λrandλr/λsas long as the latter remains sufficiently large 195
in order for the surface to qualify as self-affine. 196
Figure 3. Top left, top right, and bottom right: Visualization of contact stresses in a randomly rough contact at different magnifications. Stresses in the color bar are given in units ofE∗g¯. Lower left: Stress autocorrelation function. System specification:L/λr=8,λr/λs=250,p0=0.01E∗/ ¯g, leading to a
relative contact area ofar≈0.02.
10-4 10-3 10-2 10-1 100 101 102 103
L / Lmin
10-1 100 101 102 103
A
/
Amin
H = 0.3
A = A
min
L / Lmin
A = A min
(L / Lmin
)
2/3
10-4 10-3 10-2 10-1 100 101 102 103
L / Lmin
10-1 100 101 102 103
A
/
Amin
H = 0.8
A = A
min
L / Lmin
A = A min
(L / Lmin
)
2/3
Figure 4. Individual patch sizeAnversus load carried by each patchLn(dots). Left:H=0.3, right
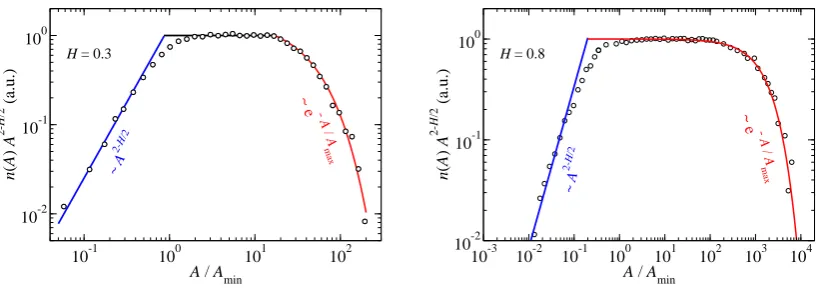
data, i.e., many more data sets than the ones shown in Fig.5, are consistent with the Eq. (1) andτ(H) dependence identified for cuts through Gaussian surfaces
τ=2−H
2 (14)
in a non-negligible range of values forAmin<A< Amax. 197
An exponent in the range 1<τ<2 indicates that the mean contact area is determined by the small patches on the self-affine branch, while the characteristic contact area is determined by the large patches and strongly affected by the valueAmaxabove which power law scaling no longer holds. We also note that the contact area at which then(A)scaling relation changes is within a few 10% of the contact area at which theL(A)relation crosses from Hertzian to linear. In addition, the probability of very large clusters to occur is strongly suppressed compared to the scaling at intermediateA. In fact, forA>Amin, the relation
n(A) =n(Aref)
Aref
A
2−H/2
e−A/Amax, (15)
where Amax is a fitting parameter turning out close to Ac, gives a satisfactory representation of 198
the complete range ofn(A)-data for H = 0.8 and A > Amin, provided the reference area Arefis 199
appropriately chosen. 200
10-1 100 101 102
A / Amin
10-2 10-1 100
n
(A
)
A
2-H
/2 (a.u.)
H = 0.3
λs / a = 8
~ A 2-H /2
~ e -
A / A
max
10-3 10-2 10-1 100 101 102 103 104
A / Amin
10-2 10-1 100
n
(A
)
A
2-H
/2 (a.u.)
H = 0.8
λs / a = 8
~ A 2-H
/2
~ e -
A
/
A
max
Figure 5. Distribution of contact-patch sizesn(A)divided by the scaling lawn(A) ∝ A2−H/2at
a reduced pressure ofp∗0 = 0.04. Left: H = 0.3, rightH = 0.8. System specification: L/λr = 4,
λr/λs=512.
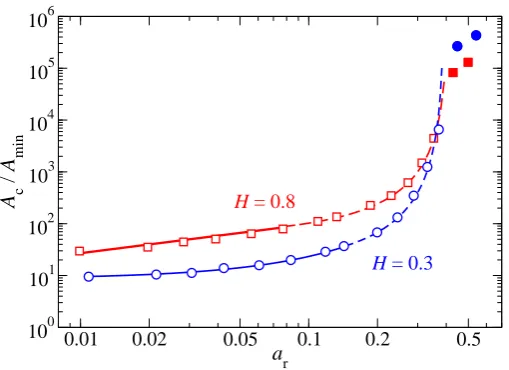
The next question to be tackled is to what degree the characteristic patch size changes 201
with the normal pressure. The increasing-load-only-leads-to-more-of-the-same dictum is certainly 202
counterintuitive as each existing patch, including the largest one, is expected to grow with increasing 203
load. Fig.6reveals thatAcin fact increases with pressure from small to large loads. The pressure 204
dependence ofAcbecomes particularly significant near the percolation transition, above whichAcis 205
macroscopically large, whereas it is finite (even in an infinite system) forp0< pcp. 206
It is interesting to note that near the percolation threshold, theAp(ar)relation for theH=0.3 and 207
theH= 0.8 both appear to satisfy aAp ∝(acp−ar)−γpower law with a value of 2. γ.2.5. At
208
very small pressures, however, the functional form ofAp(ar)– and thus ofAp(p∗)– seems to differ 209
betweenH=0.3 andH=0.8. TheH=0.3 is consistent with a rather weak exponential increase of 210
Apwithar, while the low-pressureH=0.8 data is better described with a power lawAc ∝aβr and 211
β≈0.55.
0.01 0.02 0.05 0.1 0.2 0.5
a r
100
101
102
103
104
105
106
A
c/
A
minH = 0.8
H = 0.3
Figure 6. Characteristic contact-patch sizeAcas a function of load. Closed symbols indicate the cluster
size of percolated patches. Broken lines are based on fits of the formAc∝1/(acp−ar)γ. The exponents
turned out to lie withinγ=2.2±0.2, whileacp(H=0.8) =0.42 andacp(H=0.3) =0.39 were used.
Solid lines represent fits to the small-contact-area domain. For theH=0.3 system, an exponential law of the formAp∝exp(ar/a1)appeared best, whileH=0.8 data was best represented at smallacpwith
a power lawAcp∝arβwithβ=0.55. System specification:L/λr=4 andλr/λs=512.
Before discussing the results in detail, we note that acquiring statistics is a non-trivial undertaking, 213
since a few large clusters dominate the statistics for the value ofAc. Moreover, one disorder realization 214
gives exactly one data point. It is not obvious how to perform a disorder average without increasing 215
L/λr, which is highly demanding computationally. For these reasons, it is currently difficult to
216
determine with certainty if the low-pressureAc(ac)dependence is indeed exponential forH =0.3 217
and a power law forH = 0.8. For similar reasons, it is much more difficult to determine critical 218
exponents near the percolation threshold for elastic contacts than for simple percolation models, such 219
as the random-on/off-bond model defined on lattices. Some aspects pertaining to this issue have been 220
touched upon in the context of the Reynolds flow through the thin gap between a randomly rough 221
substrate and an elastic manifold that is squeezed against it. [34,38] 222
The growth ofAcwith load well below the percolation threshold, i.e., at loads where the stress 223
distribution function is only weakly dependent on load, may affect the likelihood of plastic events. 224
A larger contact patch effectively corresponds to a larger indenter exerting the same mean stress on 225
the deformable body as a smaller indenter. Since plasticity, in contrast to elasticity, is not scale free, 226
plastic events are very likely to be superlinear in load once the pressure is sufficiently large forActo 227
noticeably grow withp. 228
Another dimensionless variable, which affects the patch-size distribution and thus the 229
characteristic patch size quite substantially, is the dimensionless ratioεf≡λs/λr, see Fig.7. This time,
230
a qualitative difference is clearly borne out for the two investigated Hurst exponents. ForH=0.8, 231
a systematic increase ofAcwithλr/λsin form of a Ac ∝ (λr/λs)1.5power law is observed in the 232
investigated range of 64 ≤ λr/λs ≤ 2048. In contrast, the H = 0.3 system shows a rather weak 233
A(εf)dependence at fixed load, which is roughly logarithmic. The difference between the largest and 234
smallest value ofAcfor theH=0.3 system is a factor of two, while it is more than a factor of 200 for 235
10
15
20
25
30
A
c/
A
min10
-3ε
10
-2f
10
110
210
310
4A
c/
A
minH = 0.3
H = 0.8
Figure 7. Characteristic contact-patch size as a function of the ratioεf=λs/λrat a fixed load for a
H=0.3 (top) and for aH=0.8 (bottom) surface. The dashed lines are drawn to guide the eye. For the H=0.8, the dashed line reflects anε−f1.5power law. Note that the ordinate is linear forH=0.3 but
This difference in scaling ofA(εf)can be rationalized as follows: ForH<0.5, the dominant part of 237
the elastic energy needed to conform two surfaces is dominated by the short-wavelength deformations, 238
while the opposite holds forH>0.5. Consequently, aH=0.3 substrate bears many patches of size 239
O(Ac)on a scale λr, since it is not energetically expensive to form contact at distant asperities. In
240
contrast, aH=0.8 substrate only has at best a few dominant mesoscale asperities in contact over an 241
area of orderλ2r. Due to this qualitative difference, we expect that not only the functional form of the
242
Ac(εf)laws differ between Hurst exponents above and belowH=0.5, but also the functional form 243
of the low-pressureAc(ar)dependence, even if the currently available data onAc(ar)by itself is too 244
meager to provide strong support for this latter claim. 245
It still needs to be shown that the radius of a characteristic cluster correlates with the distance at 246
which the stress ACF drops to a value nearp2cp/acp. Towards this end, the stress ACF is shown in Fig.8 247
at different values ofεf. It can be seen that theH=0.3 stress ACF has decayed to a rather small value
248
at a relatively short distance, i.e., to a value well belowp2cp/acpon a distance that is ofO(
√
Amin/π).
249
Subsequently, there is little dependence of the stress ACF forH=0.3. This is different for theH=0.8 250
surface, where stress correlations are much longer ranged than forH=0.3, and moreover, distinctly 251
more sensitive to the ratioλr/λs.
252
10-1 100 101 102 ∆rqs
0.00 0.05 0.10 0.15 0.20 0.25 0.30 Gσσ ( ∆ r) / ( E * g )
2 λr / λs = 2048 λr / λs = 1024 λr / λs = 512 λr / λs = 256 λr / λs = 128 λr / λs = 64
H = 0.3
_
10-1 100 101 102 ∆rqs
0.00 0.05 0.10 0.15 0.20 0.25 0.30 0.35 Gσσ ( ∆ r) / ( E * g )
2 λr / λs = 2048 λr / λs = 1024 λr / λs = 512 λr / λs = 256 λr / λs = 128 λr / λs = 64
H = 0.8
_
Figure 8. Stress ACF as a function of distancerfor various values of the ratioεf=λs/λrat a fixed
load. System specifications:L/λr=1,p∗ =0.04.
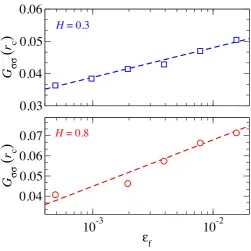
Fig.9tests our hypothesis that contact patch radii defined asrc=
√
Ac/πshould satisfyGσσ(rc). 253
p2
cp/acp ≈ 0.1(E∗g¯)2. Towards this end, we showGσσ(rc)at a fixed load for a variety of ratios of 254
εf=λs/λr. It turns out that the inequality is well obeyed and that the value ofGσσ(rc)only depends 255
weakly, i.e., logarithmically onεf.
256
For completeness, Fig.10shows how the stress ACF changes with dimensionless pressure, when 257
all other (dimensionless) parameters are kept constant. Similar curves (with a slightly different 258
definition of the stress ACF) have been reported before, see, e.g., Figs 7 and 8 in Ref. [25], where we 259
also tested and thereby validated the suitability of Persson theory with respect to the prediction of 260
stress-ACF’s. 261
Curves like those shown in Fig.10are then used to deduce the value ofGσσ(rc), which then enters 262
the test of our hypothesis that the radius of characteristic patches satisfiesGσσ(rc).p2cpatp< ppc. 263
Another such test is shown in Fig.11, which includes percolated contacts. 264
As argued in the theory section,G(rcp)exceeds pcp2 /acpfor p > pcp. Because of the relatively 265
small system system sizes investigated here (the relevant number isL/λr, at least forH=0.8) the
266
standard deviation w.r.t. to the quite accurate literature estimate [34] ofacp≈0.42 is non-negligible. 267
For the two investigated samples (different values of H but identical seeds used for the random 268
0.03
0.04
0.05
0.06
G
σσ(
r
c)
10
-3ε
10
-2f
0.04
0.05
0.06
0.07
G
σσ(
r
c)
H = 0.3
H = 0.8
Figure 9. Value of the stress ACF,Gσσ(rc), at the characteristic contact radiusrc≡
√
Ac/πfor various
values ofεf. System specification:L/λr=1,p∗ =0.04.
10-1 100 101 102
∆rqs 0.00
0.10 0.20 0.30 0.40
Gσσ
(r
) /
(
E
*
g
)
2
p / E*g = 0.2 p / E*g = 0.1 p / E*g = 0.04 p / E*g = 0.01 p / E*g = 0.005
H = 0.3
_ _ _ _ _
_
10-1 100 101 102
∆rqs 0.00
0.10 0.20 0.30 0.40 0.50
Gσσ
(r
) /
(
E
*
g
)
2
p / E*g = 0.2 p / E*g = 0.1 p / E*g = 0.04 p / E*g = 0.01 p / E*g = 0.005
H = 0.8
_
0.005 0.01 0.02 0.05 0.1 0.2
p / E*g
0.05 0.10 0.15
G
σσ(r
c)
H = 0.8
H = 0.3
Figure 11. Value of the stress ACF evaluated at the characteristic patch radiusrc ≡ √
Ac/πas a
function of reduced pressure for two different Hurst exponents. Open and closed symbols refer to data representing non-percolated and percolated contacts, respectively. System specification:L/λr=4,
λr/λs=512.
acp≈0.42, which was obtained using much larger values ofL/λr. The transition between percolated
270
and non-percolated contact occurs, as argued in the theory section, nearGσσ(rc) =0.1(E∗g¯)2. 271
4. Conclusions 272
In this article, we have analyzed and rationalized the distribution of contact patch sizes in contacts 273
between adhesionless, randomly rough, elastic solids. Our simulations revealed that the scaling 274
relation known for the number density of large contact patches, i.e.,n(A) ∝ A−τ, breaks down 275
at a characteristic (maximum) patch sizeAc, where the scaling crosses over to a superexponential 276
decay. Our theoretical considerations allow the range of validity for the scaling relation to be crudely 277
estimated. Likewise, it allows the characteristic contact-patch size to be estimated from any theory that 278
allows a reliable calculation of the stress ACF. So far, Persson’s approach to contact mechanics has been 279
successful in this regard [25,33,39,40], while bearing models that do not incorporate pairwise elastic 280
interactions between asperities are doomed to fail by design [40]. Additional theory is nonetheless 281
required to explain the observed dependence of the exponentτon the Hurst exponent, which we
282
identify asτ=2−H/2. Since the total contact area is readily predicted, as well asAminandAc, this 283
theory would have to explain either the exponentτdirectly or indirectly through the prediction of the
284
prefactor for the number densityn(A). 285
The dependence of the exponentτonHis consistent with results deduced from cuts through
286
Gaussian surfaces [13,14]. This is quite surprising, because the exponents describing the spatial 287
correlation of contact differ quite substantially between those valid for elastic contacts from those 288
obtained from cuts through the surface [19,40]. It yet seems as if changes to the model can alter the 289
precise value of the model. For example, the problem assigned in the contact-mechanics challenge [19] 290
included moderate adhesion (large enough to increaseκby 50%, but too small to induce substantial
291
stickiness) reduced the value for aH = 0.8 surface fromτ = 1.6 toτ ≈ 1.45. This result can be
292
rationalized with the argument that adhesion favors the existence of large patches, because a small 293
separation between two clusters become energetically unfavorable, whereby small contact patches are 294
Our simulations demonstrated that the increasing-load-only-leads-to-more-of-the-same 296
(ILOL2MOTS) dictum – which is approximately valid for the contact mechanics of self-affine, randomly 297
surfaces at small stresses – starts to be a poor approximation well below the percolation pressure. As 298
proposed in the introduction, this observation providesapossible explanation for why Amontons’ law 299
or Ryes-Archard law break down at large loads, even if the pressure is sufficiently small for the stress 300
distribution (within the contact) to remain essentially unchanged whenp0is multiplied or divided 301
by a factor of two. We certainly do not mean to claim that it is the only possible explanation and 302
perhaps not even a very common one. After all, in many practical applications, the generation of 303
debris and the subsequent third-body distribution – as discussed, for example, by Blau in the context 304
of running-in [41] – may be more critical than surface topography and contact mechanics. 305
When considering debris particles, whose presence leads to more wear and thus to more debris 306
particles and higher friction, it is clear that the ILOL2MOTS dictum may not even hold at low 307
pressures. Also, elastic coupling between asperities can affect the friction-load [9] or the wear-load [11] 308
dependence under certain circumstances However, when these mechanisms are irrelevant, our findings 309
suggest that the dictum may still break down at a lower pressure than would be expected based on 310
the study of the stress distribution function alone. The latter can look essentially indistinguishable 311
for a system with, say, 0.05% and 10% relative contact area. However, since the way, in which stress 312
is spatially distributed differs between the two – characteristic patch sizes are distinctly smaller at 313
0.05% than at 10% contact area – it is clear that any size dependence of plasticity can be revealed before 314
(predicted, elastic) contact stresses start to raise. Thoughts along these lines might also matter for 315
adhesive surfaces, for which the existence of a critical contact-patch size has been proposed, below 316
which plastic deformation within the bulk prevails and above which surfaces yield through adhesive 317
wear [10,15]. 318
Let us conclude this work with an answer to the question how muchAcgrows – at small stresses 319
for aH = 0.8 surface – when the roughness, i.e., the root-mean-square (rms) height ¯his doubled. 320
The doubling can be achieved, for example, by leavingεf,L/λr as well as the load Lunchanged, 321
while the height spectrumC(q)is replaced with 4·C(q). Dimensional analysis reveals that – within 322
linear elasticity and the small-slope approximation – the effect on contact mechanics is the same as 323
if the load were doubled or the apparent contact were halved and all geometric surface parameters 324
kept unchanged [26]. Under such a transformation,Acwould roughly increase by a factor 2β, which 325
amounts to an increase of approximately 50% forAcof a genericH=0.8 surface. 326
The doubling of the rms-height can also be achieved by leaving the prefactor ofC(q)as well as 327
the pressure constant, while increasing the ratioλr/λs. For sufficiently smallεf, this means that also
328
the reduced pressurep∗remains unchanged. It is readily found that ¯hscales withλrH, so that doubling
329
the roughness necessitates an increase of 21/0.8for ourH=0.8 surface. This in turn means an increase 330
ofAcby approximately 21.5/0.8≈3.7. 331
An increase ofAcby a factor of 3.7 (induced by the doubling of the rms-height through a pertinent 332
change ofλr/λs) might not sound much more dramatic than an increase by 1.5 (induced by scaling all
333
heights at a given in-plane position with a factor of 2). However, if ¯his changed by a factor of say 100 334
(the difference between two surfaces being polished to either 1µm or 0.1 mm), these numbers change
335
to 3.5 and 5,500, respectively. Since polishing supposedly does not significantly affect the roughness at 336
very small scales, i.e., the value ofC(q)at large values ofq, we argue that the main beneficial effect of 337
polishing is the reduction ofλr/λs. (Any reader or referee is invited to suggest references.) Our take is
338
that at very small scales, ¯g≈1 should be an OK assumption, unless solids are layered. Thus, while 339
polishing should not lead to (much) reduced local stresses, it reduces the size of the patches that carry 340
the load. This in turn should substantially reduce plastic events and wear. 341
Author Contributions:MHM conceived the simulation. AW and MHM performed the simulations and analyzed 342
the data. MHM wrote the manuscript. 343
Acknowledgments:MHM acknowledges ten-year old but still inspiring discussions with Carlos Campaña. 345
Conflicts of Interest:The authors declare no conflict of interest. 346
References 347
1. Dowson, D.History of Tribology; John Wiley & Sons, Inc.: New York, 1998. 348
2. Bowden, F.P.; Tabor, D.Friction and Lubrication; Wiley: New York, 1956. 349
3. Persson, B.N.J.; Sivebaek, I.M.; Samoilov, V.N.; Zhao, K.; Volokitin, A.I.; Zhang, Z. On 350
the origin of Amonton’s friction law. Journal of Physics: Condensed Matter 2008, 20, 395006. 351
doi:10.1088/0953-8984/20/39/395006. 352
4. Persson, B.N.J. Theory of rubber friction and contact mechanics. The Journal of Chemical Physics2001, 353
115, 3840. doi:10.1063/1.1388626. 354
5. Pei, L.; Hyun, S.; Molinari, J.; Robbins, M.O. Finite element modeling of elasto-plastic contact 355
between rough surfaces. Journal of the Mechanics and Physics of Solids 2005, 53, 2385–2409. 356
doi:10.1016/j.jmps.2005.06.008. 357
6. Campañá, C.; Müser, M.H. Contact mechanics of real vs. randomly rough surfaces: A Green’s function 358
molecular dynamics study.Europhysics Letters (EPL)2007,77, 38005. doi:10.1209/0295-5075/77/38005. 359
7. Hyun, S.; Pei, L.; Molinari, J.F.; Robbins, M.O. Finite-element analysis of contact between elastic self-affine 360
surfaces.Physical Review E2004,70, 026117. doi:10.1103/physreve.70.026117. 361
8. Campañá, C. Using Green’s function molecular dynamics to rationalize the success of asperity 362
models when describing the contact between self-affine surfaces. Physical Review E2008,78, 026110. 363
doi:10.1103/physreve.78.026110. 364
9. Braun, O.; Miyashita, N.; Fujii, H.; Persson, B. On the load dependence of friction: Role of the long-range 365
elastic coupling. Tribology International2018,123, 209–215. doi:10.1016/j.triboint.2018.01.018. 366
10. Aghababaei, R.; Warner, D.H.; Molinari, J.F. Critical length scale controls adhesive wear mechanisms. 367
Nature Communications2016,7, 11816. doi:10.1038/ncomms11816. 368
11. Aghababaei, R.; Brink, T.; Molinari, J.F. Asperity-Level Origins of Transition from Mild to Severe Wear. 369
Physical Review Letters2018,120. doi:10.1103/physrevlett.120.186105. 370
12. Dieterich, J.H.; Kilgore, B.D. Direct observation of frictional contacts: New insights for state-dependent 371
properties.Pure and Applied Geophysics PAGEOPH1994,143, 283–302. doi:10.1007/bf00874332. 372
13. Kondev, J.; Henley, C.L. Geometrical Exponents of Contour Loops on Random Gaussian Surfaces. Physical 373
Review Letters1995,74, 4580–4583. doi:10.1103/physrevlett.74.4580. 374
14. Rak, M. Fractals, Scaling and Growth Far from Equilibrium, Paul Meakin, Cambridge Non-linear Science 375
Series 5, Cambridge University Press, Cambridge, 1998, ISBN 0-521-45253-8, pp. 674, £75 (hardback). 376
International Journal of Numerical Modelling: Electronic Networks, Devices and Fields 1999, 12, 493–494. 377
doi:10.1002/(sici)1099-1204(199911/12)12:6<493::aid-jnm346>3.0.co;2-7. 378
15. Frérot, L.; Aghababaei, R.; Molinari, J.F. A mechanistic understanding of the wear coefficient: From 379
single to multiple asperities contact. Journal of the Mechanics and Physics of Solids2018,114, 172–184. 380
doi:10.1016/j.jmps.2018.02.015. 381
16. Dapp, W.B.; Müser, M.H. Contact mechanics of and Reynolds flow through saddle points: On the 382
coalescence of contact patches and the leakage rate through near-critical constrictions. EPL (Europhysics 383
Letters)2015,109, 44001. doi:10.1209/0295-5075/109/44001. 384
17. Afferrante, L.; Carbone, G.; Demelio, G. Interacting and coalescing Hertzian asperities: A new multiasperity 385
contact model. Wear2012,278-279, 28–33. doi:10.1016/j.wear.2011.12.013. 386
18. Afferrante, L.; Bottiglione, F.; Putignano, C.; Persson, B.N.J.; Carbone, G. Elastic Contact Mechanics of 387
Randomly Rough Surfaces: An Assessment of Advanced Asperity Models and Persson’s Theory. Tribology 388
Letters2018,66. doi:10.1007/s11249-018-1026-x. 389
19. Müser, M.H.; Dapp, W.B.; Bugnicourt, R.; Sainsot, P.; Lesaffre, N.; Lubrecht, T.A.; Persson, B.N.J.; Harris, K.; 390
Bennett, A.; Schulze, K.; Rohde, S.; Ifju, P.; Sawyer, W.G.; Angelini, T.; Esfahani, H.A.; Kadkhodaei, M.; 391
Akbarzadeh, S.; Wu, J.J.; Vorlaufer, G.; Vernes, A.; Solhjoo, S.; Vakis, A.I.; Jackson, R.L.; Xu, Y.; Streator, 392
J.; Rostami, A.; Dini, D.; Medina, S.; Carbone, G.; Bottiglione, F.; Afferrante, L.; Monti, J.; Pastewka, L.; 393
Robbins, M.O.; Greenwood, J.A. Meeting the Contact-Mechanics Challenge. Tribology Letters2017,65. 394
20. Johnson, K.L.Contact mechanics; Cambridge University Press: Cambridge, UK, 1985. 396
21. Majumdar, A.; Tien, C.L. Fractal characterization and simulation of rough surfaces.Wear1990,136, 313–327. 397
doi:10.1016/0043-1648(90)90154-3. 398
22. Palasantzas, G. Roughness spectrum and surface width of self-affine fractal surfaces via the K-correlation 399
model. Physical Review B1993,48, 14472–14478. doi:10.1103/physrevb.48.14472. 400
23. Persson, B.N.J. On the Fractal Dimension of Rough Surfaces. Tribology Letters 2014, 54, 99–106. 401
doi:10.1007/s11249-014-0313-4. 402
24. Jacobs, T.D.B.; Junge, T.; Pastewka, L. Quantitative characterization of surface topography using spectral 403
analysis. Surface Topography: Metrology and Properties2017,5, 013001. doi:10.1088/2051-672x/aa51f8. 404
25. Wang, A.; Müser, M.H. On the usefulness of the height-difference-autocorrelation function for contact 405
mechanics.Tribol. Int.2018,123. doi:10.1016/j.triboint.2018.02.002. 406
26. Prodanov, N.; Dapp, W.B.; Müser, M.H. On the Contact Area and Mean Gap of Rough, Elastic Contacts: 407
Dimensional Analysis, Numerical Corrections, and Reference Data. Tribology Letters2014,53, 433–448. 408
doi:10.1007/s11249-013-0282-z. 409
27. Karpov, E.; Wagner, G.; Liu, W.K. A Green’s function approach to deriving non-reflecting boundary 410
conditions in molecular dynamics simulations. International Journal for Numerical Methods in Engineering 411
2005,62, 1250–1262. 412
28. Campañá, C.; Müser, M.H. Practical Green’s function approach to the simulation of elastic semi-infinite 413
solids. Phys. Rev. B2006,74, 075420. doi:10.1103/physrevb.74.075420. 414
29. Bitzek, E.; Koskinen, P.; Gähler, F.; Moseler, M.; Gumbsch, P. Structural relaxation made simple. Physical 415
Review Letters2006,97, 170201. 416
30. Zhou, Y.; Moseler, M.; Müser, M.H. Setting boundary-element methods on FIRE. (submitted). 417
31. Yastrebov, V.A.; Anciaux, G.; Molinari, J.F. From infinitesimal to full contact between rough 418
surfaces: Evolution of the contact area. International Journal of Solids and Structures2015, 52, 83–102. 419
doi:10.1016/j.ijsolstr.2014.09.019. 420
32. Pastewka, L.; Prodanov, N.; Lorenz, B.; Müser, M.H.; Robbins, M.O.; Persson, B.N.J. Finite-size 421
scaling in the interfacial stiffness of rough elastic contacts. Physical Review E 2013, 87, 062809. 422
doi:10.1103/physreve.87.062809. 423
33. Wang, A.; Müser, M.H. Gauging Persson theory on adhesion. Tribol. Lett. 2017, 65. 424
doi:10.1007/s11249-017-0886-9. 425
34. Dapp, W.B.; Lücke, A.; Persson, B.N.J.; Müser, M.H. Self-Affine Elastic Contacts: Percolation and Leakage. 426
Phys. Rev. Lett.2012,108, 244301. doi:10.1103/physrevlett.108.244301. 427
35. Dapp, W.B.; Prodanov, N.; Müser, M.H. Systematic analysis of Persson’s contact mechanics 428
theory of randomly rough elastic surfaces. Journal of Physics: Condensed Matter 2014, 26, 355002. 429
doi:10.1088/0953-8984/26/35/355002. 430
36. Akarapu, S.; Sharp, T.; Robbins, M.O. Stiffness of Contacts between Rough Surfaces.Physical Review Letters 431
2011,106. doi:10.1103/physrevlett.106.204301. 432
37. Putignano, C.; Afferrante, L.; Carbone, G.; Demelio, G. A new efficient numerical method for 433
contact mechanics of rough surfaces. International Journal of Solids and Structures 2012, 49, 338–343. 434
doi:10.1016/j.ijsolstr.2011.10.009. 435
38. Dapp, W.B.; Müser, M.H. Fluid leakage near the percolation threshold. Scientific Reports2016,6, 19513. 436
doi:10.1038/srep19513. 437
39. Persson, B.N.J. On the elastic energy and stress correlation in the contact between elastic 438
solids with randomly rough surfaces. Journal of Physics: Condensed Matter 2008, 20, 312001. 439
doi:10.1088/0953-8984/20/31/312001. 440
40. Campañá, C.; Müser, M.H.; Robbins, M.O. Elastic contact between self-affine surfaces: comparison of 441
numerical stress and contact correlation functions with analytic predictions. Journal of Physics: Condensed 442
Matter2008,20, 354013. doi:10.1088/0953-8984/20/35/354013. 443
41. Blau, P.J. On the nature of running-in. Tribology International 2005, 38, 1007–1012. 444