Weed Detection and Reduction of
Herbicides by Agronomic Image Processing
Roja.k1, Sivaranjani.S2, Santhiya.C3, Selvi.R4, K.Shanthalakshmi5
U.G Student, Department of ECE, Adhiyamaan College of Engineering, Hosur, Tamilnadu, India 1,2,3,4
Assistant Professor, Department of ECE, Adhiyamaan College of Engineering, Hosur, Tamilnadu, India5
ABSTRACT: Agriculture is the backbone of human sustenance in this world. Now a days with growing population we need the productivity of the agriculture to be increased. So, the usage of deadly poisonous as herbicides has increased to a drastic level. Our aim is to increase the productivity but we have forgot about the damage done to the environment. In this project we deal with the reduction of herbicides by spraying them apart from the weed areas present. This weed areas detection in the fields is done by applying GLCM approach. Feature Extraction is a method of capturing visual content of images for indexing & retrieval. Primitive or low level image features can be either general features, such as extraction of colour, texture and shape or domain specific features. This paper presents an application of gray level co-occurrence matrix (GLCM) to extract second order statistical texture features for motion estimation of images. The Four features namely, Angular Second Moment, Correlation, Inverse Difference Moment, and Entropy are computed using Xilinx FPGA. The results show that these texture features have high discrimination accuracy, efficiently used for real time Pattern recognition applications.
KEYWORDS: Simulated images, Texture, gobber filter, Pattern recognition, Features, Frames.
I.INTRODUCTION
For site-specific weed management, many online systems using different optical sensors have been developed to enable spraying specifically the weed-infested areas.we propose an application of this modelling dedicated to images without perspective and assess the effectiveness of two crop/inter-row weed detection algorithms based on Gabor filtering or Hough transform. Then, for images with perspective effects, a crop/weed discrimination algorithm based on the Hough transform was analysed and tested on real images.it will take a very long time for either a manual segmentation of the image or a manual counting of weed plants in the field. Very few articles have reported on the evaluation of the robustness of crop/weed discrimination algorithms which have actually been validated from real images with natural weed patterns taken from a camera under natural outdoor lighting conditions (Andreasen et al. 1997; Tang et al. 1999; Onyango and Marchant2005). Some algorithms have been developed in our lab and have been tested on real data and in real in-field conditions but assessing and comparing them appeared difficult and uncertain .
correlation, inverse difference moment, and entropy are computed. These four measures provide high discrimination accuracy required for motion picture estimation. These features are calculated and implemented using Xilinx ISE 13.4.
The main application of this model is Environmental assessment and monitoring, Imaging techniques with different spectrum such as infrared, hyper spectral imaging, X-ray were useful in vegetation indices, canopy measurements ,irrigated land mapping etc with greater accuracies, Fruit& food grading, because of increased expectations in quality food and safety standards.
II.HOUGH TRANSFORM
Hough transformation is a technique which can be used to isolate features of a particular shape within an image. The crop/weed discrimination algorithm is firstly based on crop row detection from the vanishing point (Hough Transform) and secondly based on crop/weed segmentation (region-based segmentation) for crop/weed pixel classification. In this case, we can’t get a very high degree (up to 90%) of accuracy for this algorithm. In order to overcome this we go for GLCM method.
III.EXTRACTION OF GLCM
In statistical texture analysis, texture features are computed from the statistical distribution of observed combinations of intensities at specified positions relative to each other in the image. According to the number of intensity points (pixels) in each combination, statistics are classified into first-order, second-order and higher-order statistics. The Gray Level Concurrence Matrix (GLCM) method is a way of extracting second higher-order statistical texture features.
The approach has been used in a number of applications, Third and higher order textures consider the relationships among three or more pixels. These are theoretically possible but not commonly implemented due to calculation time and interpretation difficulty.
A GLCM is a matrix where the number of rows and columns is equal to the number of gray levels, G, in the
image. The matrix element P (i, j | Δx, Δy) is the relative frequency with which two pixels, separated by a pixel distance (Δx, Δy), occur within a given neighborhood, one with intensity ‘i’ and the other with intensity ‘j’. The matrix element P (i, j | d, ө) contains the second order statistical probability values for changes between gray levels ‘i’ and ‘j’ at a particular displacement distance d and at a particular angle (ө). Using a large number of intensity levels G implies storing a lot of temporary data, i.e. a G × G matrix for each combination of (Δx, Δy)
The MATLAB code used for the GLCM is q1 = imread ('Jerry.jpg');
w1 = rgb2gray (q1);
e1 = imresize (w1, [128 128]); r1 = graycomatrix (e1); disp (r1);
t1 = imhist (e1);
figure, imshow (e1), title ('transformed gray Jerry .jpg in gray'); The output will be an 8*8matrix which is a GLCM of input image.
A.K-MEANS SEGMENTATION
The k-means algorithm is an evolutionary algorithm that gains its name from its method of operation. The algorithm clusters observations into k groups, where k is provided as an input parameter. It then assigns each observation to clusters based upon the observation’s proximity to the mean of the cluster. The cluster’s mean is then recomputed and the process begins again. Here’s how the algorithm works:
Step 1: The algorithm arbitrarily selects k points as the initial cluster centers (“means”).
Step2: Each point in the dataset is assigned to the closed cluster, based upon the Euclidean distance between each point and each cluster center.
Step 3: Each cluster center is recomputed as the average of the points in that cluster.
Step 4: Step 2 and 3 repeat until the clusters converge. Convergence may be defined differently depending upon the implementation.
Description
K, K’ depends on the balance of clustering quality and time). In general, bigger K’ can expand searching area of solution space, and reduce the situation that there are not any initial values near some extremum. Subsequently, re-clustering the dataset through Kmeans with the chosen initial conditions would produce K’ mediods, then merging K’ clusters (which are nearest clusters) until the number of clusters reduced to k.
B.FEATURE EXTRACTION USING GLCM Color Feature
The Color feature is the most general feature extracted from an image. The color images are having the standard Color model known as RGB. Color histogram is a commonly used method for the extraction of color information in CBIR system. Feature refers to the attribute of an object. Feature extraction results in reducing the dimensionality of an object, that form the significant part in image processing.
Gabor filters (wavelet)
For a given image I(x, y) with size P×Q, its discrete Gabor wavelet transform is given by a convolution:
where, s and t are the filter mask size variables, and * ψ mn is the complex conjugate of ψmn which is
a class of self-similar functions generated from dilation and rotation of the following mother wavelet:
Where W is called the modulation frequency. The self-similar Gabor wavelets are obtained through the generating function:
Where m and n specify the scale and orientation of the wavelet respectively, with m = 0, 1, …M-1, n = 0, 1, …, N-1, and
Texture representation
After applying Gabor filters on the image with different orientation at different scale, we obtain an array of magnitudes:
m = 0, 1, …, M-1; n = 0, 1, …, N-1 These magnitudes represent the energy content at different scale and orientation of the image. The main purpose of texture-based retrieval is to find images or regions with similar texture. It is assumed that we are interested in images or regions that have homogenous texture, therefore the
following mean µmn and standard deviation σmn of the magnitude of the transformed coefficients are used to
represent the homogenous texture feature of the region:
A feature vector f (texture representation) is created using µmn and σmn as the feature components [5, 10]. Five
scales and 6 orientations are used in common implementation and the feature vector is given by:
In statistical texture analysis, texture features are computed from the statistical distribution of observed combinations of intensities at specified positions relative to each other in the image. According to the number of intensity points (pixels) in each combination, statistics are classified into first-order, second order and higher-order statistics. The Gray Level Coocurrence Matrix (GLCM) method is a way of extracting second higher-order statistical texture features. The approach has been used in a number of applications, Third and higher order textures consider the relationships among three or more pixels. These are theoretically possible but not commonly implemented due to calculation time and interpretation difficulty.
C. CLASSIFICATION USING FEED FORWARD NEURAL NETWORK Neural Network Characteristics
The word network in Neural Network refers to the interconnection between neurons present in various layers of a system. Every system is basically a 3 layered system, which are Input layer, Hidden Layer and Output Layer. The input layer has input neurons which transfer data via synapses to the hidden layer, and similarly the hidden layer transfers this data to the output layer via more synapses.
Neural Network (NN) can be represented using a directed graph G, an ordered 2-tuple (V, E) consisting of a set V of vertices and E of edges with vertices V={1, 2, n} and arcs A= {|i>=1,j <=n } ,having the following restrictions:
V is partitioned into a set of input nodes VI, hidden nodes, VH, and output Nodes VO.
The vertices are also partitioned into layers.
Any arc must have node i in layer h-1 and node j in layer h.
Arc is labeled with a numeric value wij.
Node i is labeled with a function fi.
(input\output) and the edges, the synaptic links. The edges are labeled by the weights attached to the synaptic links.
Neural networks essentially comprise three pieces: the architecture or model; the learning algorithm; and the activation functions. Neural networks are programmed or “trained” to “. . . store, recognize, and associatively retrieve patterns or database entries; to solve combinatorial optimization problems; to filter noise from measurement data; to control ill-defined problems; in summary, to estimate sampled functions when we do not know the form of the functions.” It is precisely these two abilities (pattern recognition and function estimation) which make artificial neural networks (ANN) so prevalent a utility in data mining. As data sets grow to massive sizes, the need for automated processing becomes clear. With their “model-free” estimators and their dual nature, neural networks serve data mining in a myriad of ways.
IV.RESULT
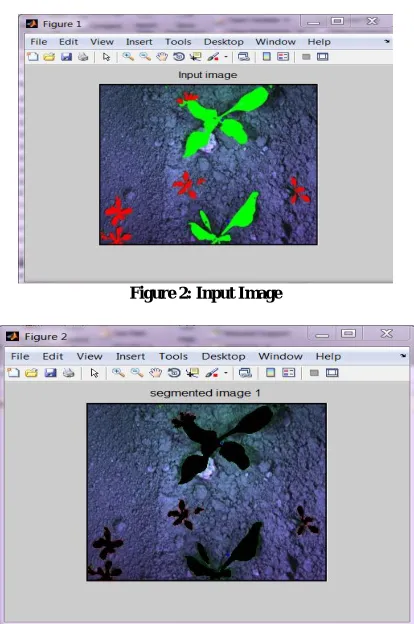
A. INPUT
Figure 2: Input Image
B.SEGMENTATION
Figure 4: Segmented Image 2
Figure 5: Segmented Image 3
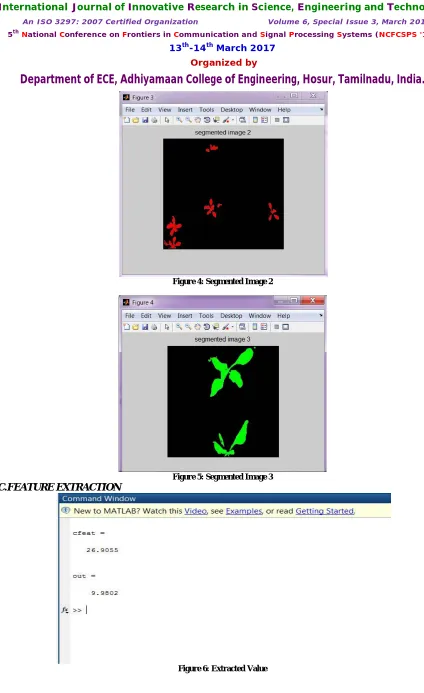
C.FEATURE EXTRACTION
D. CLASSIFICATION USING FEED FORWARD NEURAL NETWORK
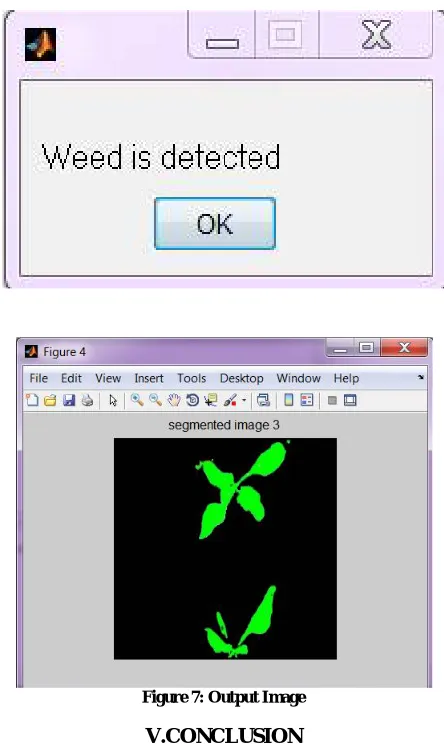
E.OUTPUT
Figure 7: Output Image
V.CONCLUSION
The Gray Level Co-ocurrence Matrix (GLCM) method is used for extracting four Statistical Texture Parameters i.e., Entropy, Inverse Difference Moment, Angular Second Moment and Correlation. By extracting the features of an image by GLCM approach, the image compression time can be greatly reduced in the process of converting RGB to Gray level image when compared to other DWT Techniques, but however DWT is versatile method of compressing video as a whole. These features are useful in motion estimation of videos and in real time pattern recognition applications like Military & Medical Applications.
REFERENCES
[1] M.J. Aitkenhead, I.A. Dalgetty, C.E. Mullins, A.J.S. McDonald, and N.J.C. Strachan. Weed and crop discrimination using image analysis and artificial intelligence methods. Computers and electronics in Agriculture, 39(3):157–171, 2003.
[2] T. Borregaard, H. Nielsen, L. Norgaard, and H. Have. Crop-weed discrimination by line imaging spectroscopy. J. Agric. Eng. Res.,72(4):389–400, 2000. [3] L. Breiman. Random forests. Machine Learning, 45(1):5–32, 2001.
[4] T.F. Burks, S.A. Shearer, R.S. Gates, and K.D. Donohue. Backpropagation neural network design and evaluation for classifying weed species using color image texture. Transactions of the American Society of Agricultural Engineers, 43(4):1029–1037, 2000.
[5] G. Cerutti, L. Tougne, J. Mille, A. Vacavant, and D. Coquin. A modelbased approach for compound leaves understanding and identification. In IEEE Intl. Conf. on Image Processing, pages 1471–1475, 2013.