Mathematical Model and Simulation for
Nutrient-Plant Interaction Analysis
Abstract— Differential equation models to understand interaction between plant and nutrient solution are presented. The root cells selectively emit H+ ions with active transport consuming ATPs to establish electrical gradient along the cell membrane. It establishes electrical field with Nernst potential to make positively charged ions outside the cell membrane flow into the root cell. Anion influx is also modulated by H+ ion concentration because plant root cell absorbs negatively charged particles with symport. If an anion collides with H+ cell to make net charge as neutral, at symport channel, it can flow through. In this paper, mathematical models for cation and anion absorption are introduced. Cation absorption model was induced from Ohm’s law combined with Goldman’s equation. Anion absorption model is similar to chemical reaction rate model. Both models have physiological terms influenced by gene expression pattern, species or phenotypes. Cation model also includes terms for ion’s kinetic and electrical properties, growth of plant and interaction between the root and the surroundings. Simulation for 20 different sets of coefficients showed that the physiology-related coefficient has important role on nutrition absorption tendencies of plants.
Keywords—Systems Biology, Horticulture, Computational Biology, Complex System, Fertilization, System Modeling
I. INTRODUCTION
Recently, ODE network simulation is applied on nutrient solution system to understand the black-boxed behavior of complex chemical system. [1] The network-model based approach describes sedimentation and complex bidirected interactions among chemical compounds which the nutrient solution contains. It provided time-series simulations to investigate nutrient solution system with high accuracy. This method is based on ordinary differential equation (ODE) expression of chemical reactions. For example, ionization of NaCl(aq) is described as equation (1-3), where k1 is forward reaction rate and k2 is backward reaction rate.
With reliable reaction rate coefficients, the equations can describe the concentration change of chemical components along time scale. Combination of those reactions enables simulation of complex chemical system’s behavior.
𝑑[𝑁𝑎+]
𝑑𝑡 = 𝑘1[𝑁𝑎𝐶𝑙] − 𝑘2[𝑁𝑎
+][𝐶𝑙−] (1)
𝑑[𝐶𝑙−]
𝑑𝑡 = 𝑘1[𝑁𝑎𝐶𝑙] − 𝑘2[𝑁𝑎
+][𝐶𝑙−] (2)
𝑑[NaCl]
𝑑𝑡 = −𝑘1[𝑁𝑎𝐶𝑙] + 𝑘2[𝑁𝑎+][𝐶𝑙−] (3)
This approach helps researchers to understand the state transition of nutrient solution system because ion selective electrodes does not work appropriate on nutrient solution because of ion interference effect. [2-3]. A computational method is necessary to fully trace the ion rate change.
However, appropriate modeling method to match ODE scaled ion rate expression with plant’s ion uptake is necessary to apply those complex-system simulation approach on prediction of plant’s ion uptake. Although the influx of ions into roots are widely studied [4-7], their methods are not applicable to timescale simulation. They considered influx and efflux of ion as irreversible process so needed to prepare 2 separate models for each ion. And they did not distinguish flux of cation and anion. Cation influx is based on secondary transport, while plant absorbs anion with symport with H+ ion.
M. Silberbush and J.H. Lieth (2004) presented nitrate and potassium uptake prediction model [8] but it is regression-based model to predict individual ion so does not consider the reaction of nitrate or potassium with other compounds to form plant-unabsorbable state.
An empirical model for macronutrient uptake is presented by A. Pardossi et al (2005) but they acquired data once a week. [9] So this model is not applicable to short-time interval simulation. Daniele Massa et al. (2008) presented an empirical model for sodium absorption simulation [10] but this model ignores interference of ionic components; for example, both association of sodium ion with Cl- and with FeEDTA- reduces the level of sodium ion but the model could not illustrate such phenomenon.
This work was supported by Agriculture, Food and Rural Affairs Convergence Technologies Program for Educating Creative Global Leader funded by the Ministry of Agriculture, Food and Rural Affairs (MAFRA, Korea). [Project Number 1545020852].
Byunghyun Ban
Future Farming Team Imagination Garden Inc. Andong Si, Republic of KoreaPreprints (www.preprints.org) | NOT PEER-REVIEWED | Posted: 9 June 2020 doi:10.20944/preprints201909.0219.v2
Therefore, I present a continuous time scale model which describes secondary transportation of cation. This model is combined with ODE network model of nutrient solution system [1] to figure out whether the model provides different results on different plant models.
II. METHOD A. Cation Absorption Model
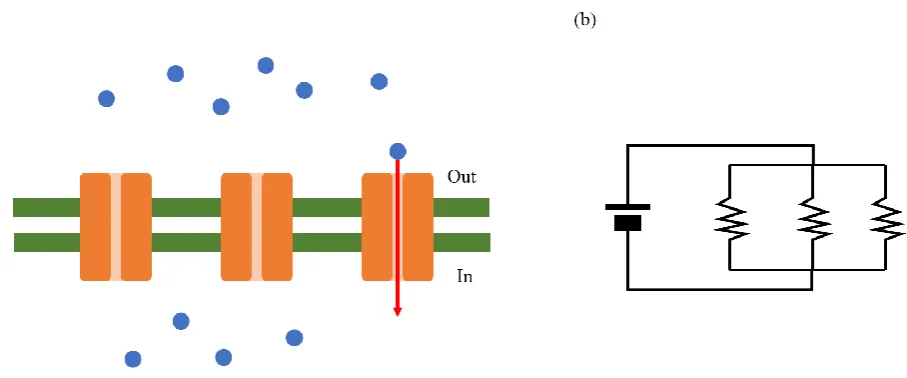
I first considered the ion channels for cation absorption as electrical register, and the other region of cell membrane as insulator. Then the group of a random ion channels becomes a parallel register system. This concept is described on the Figure 1. A root cell continuously emits H+ ion with active transport to build a concentration gradient across the membrane. The difference of positively charged ions, especially H+, induces Nernst potential. The electrical potential outside the membrane becomes greater than inside, inducing an electrical field, to push cations inside the cell.
Therefore, influx of cation through the membrane is an electrical current. Equation (4) is application of Ohm’s law to describe the secondary transport, where Iion is electric current of ion influx, Vm is the membrane potential induced by target ion gradient is the voltage and Rion is combined resistance value of ion channels.
Iion= 1
Rion𝑉𝑚 (4)
Electric current is described as equation (5). S is surface area where the charged particle passes through, 𝑣̅ is the average velocity of charged particle, k is the number of electrons which the selected ion lost, e is the charge of an electron and n is the number of particles per unit volume. The equation has negative value because the flux of positively
charged particle is opposite to the definition of electric current, which is induced by negatively charged electrons.
Iion= −S𝑣̅𝑘𝑒𝑛 (5)
n = −Iion 𝑆𝑣̅𝑘𝑒 (6)
As n is the number of particles in 1L volume, dividing both side of equation (6) with Avogadro’s number describes equation of molarity (equation 7). 𝑁𝐹is Faraday’s number which is multiplication of NA and e. [ion] is the ion concentration inside the root because the electric current was defined as influx.
n
NA= [𝑖𝑜𝑛] = − 1 𝑁𝐹∙
Iion 𝑆𝑣̅𝑘 (7)
Differentiation on equation (7) with time variable t expresses the differential equation of ion concentration change on time, which has same dimension with equation (1-3). Now the model shows a hint that it can be applied with ODE network model for nutrient solution [1].
𝑑[𝑖𝑜𝑛] dt = −
1 𝑁𝐹∙
1 𝑆𝑣̅𝑘
𝑑
𝑑𝑡𝐼𝑖𝑜𝑛 (8)
Derivation on equation (4) becomes equation (9), which has derivation of current term. Applying it on equation (8) leads to equation (10).
𝑑 𝑑𝑡Iion=
1 Rion
𝑑 𝑑𝑡𝑉𝑚 (9)
𝑑[𝑖𝑜𝑛] dt = −
1 𝑁𝐹∙
1 𝑆𝑣̅𝑘
𝑑
𝑑𝑡𝐼𝑖𝑜𝑛= − 1 𝑁𝐹∙
1 𝑆𝑣̅𝑘∙
1 Rion
𝑑
𝑑𝑡𝑉𝑚 (10)
The force on a particle inside the electrical field is described as equation (11), where E is the electrical field, q is Figure 1. Ion channels are considered as electrical resistances
the charge of particle, 𝜃 is the thickness of membrane and m is the mass of ion. The acceleration of the particle is described as equation (12), where m is the mass of single ion particle.
F = Eq =V𝑚
𝜃 q = ma (11)
a =dv 𝑑𝑡=
𝑉𝑚𝑘𝑒 𝑚𝜃 (12)
With the supposition that the force on cation during passing through the ion channel is uniform, and the initial velocity of ion is zero, the average velocity of the ion during transport is described as equation (13).
𝑣̅ = √𝑎𝜃 2 = √
𝑉𝑚𝑘𝑒𝜃 2𝑚𝜃 = √
𝑉𝑚𝑘𝑒 2𝑚 (13)
Now applying equation (13) on equation (10) leads to equation (14).
𝑑[𝑖𝑜𝑛] dt = −
1 𝑁𝐹∙ 1 𝑆𝑘∙ √ 2𝑚 𝑉𝑚𝑘𝑒∙ 1 Rion 𝑑
𝑑𝑡𝑉𝑚 (14)
Equation (15) describes the relationship between the resistance and permeability of ion channel. Pion is the permeability of the ion at channels defined in derivation of Goldman’s equation (Pion=𝐷𝐴
𝜃), DA is diffusion constant and 𝜃 is the thickness of the membrane. 𝜅 is a constant coefficient.
Rion=1𝜅𝑃1 𝑖𝑜𝑛=
1 𝜅
𝜃 𝐷𝐴 (15)
The mass of an ion is defined as equation (16), where M is molar weight.
m = 1 1000
M 𝑁𝐴 (16)
By applying equation (15, 16) on equation (14), equation (17) is derived.
𝑑[𝑖𝑜𝑛] dt = −
1 𝑁𝐹 ∙ 1 𝑆𝑘∙ √ 2𝑚 𝑉𝑚𝑘𝑒 ∙ 1 Rion 𝑑 𝑑𝑡𝑉𝑚
= − 1 𝑁𝐹∙
1 𝑆𝑘∙ √
2𝑚 𝑉𝑚𝑘𝑒∙ 𝜅Pion
𝑑 𝑑𝑡𝑉𝑚
= − 1 𝑁𝐹∙ 1 𝑆𝑘∙ √ 2𝑚 𝑉𝑚𝑘𝑒∙ 𝜅 𝐷𝐴 𝜃 𝑑 𝑑𝑡𝑉𝑚
= − 1 𝑁𝐹∙
1 𝑆𝑘∙ √
2𝑀 1000𝑉𝑚𝑘𝑒𝑁𝐴∙ 𝜅
𝐷𝐴 𝜃
𝑑 𝑑𝑡𝑉𝑚
= − 1 10√5∙ 1 𝑆∙ 1 𝑘𝑁𝐹 ∙ √ 𝑀 𝑉𝑚𝑘𝑁𝐹 ∙ 𝜅𝐷𝐴 𝜃 𝑑 𝑑𝑡𝑉𝑚
= − 1 10√5∙
1 𝑆∙
1 (𝑘𝑁𝐹)1.5 ∙ √
𝑀 𝑉𝑚∙ 𝜅 𝐷𝐴 𝜃 𝑑 𝑑𝑡𝑉𝑚 = − 𝜅 10√5𝜃∙ 1 𝑆∙ 𝐷𝐴√𝑀 (𝑘𝑁𝐹)1.5 ∙
1 √𝑉𝑚
𝑑
𝑑𝑡𝑉𝑚 (17)
I defined the constant ℬ term as equation (18) to eliminate the coefficient 𝜅 and other numbers. Θ is also considered as a constant number because the phospholipid bilayers have typical thickness.
𝜅
10√5𝜃= ℬ (18)
Then the equation (17) is simplified into equation (19).
𝑑[𝑖𝑜𝑛] dt = −
ℬ 𝑆∙
𝐷𝐴√𝑀 (𝑘𝑁𝐹)1.5 ∙
1 √𝑉𝑚
𝑑
𝑑𝑡𝑉𝑚 (19)
Vm is calculated with Goldman’s equation, which has the concentration of ions inside and outside the root as the only independent variable. Therefore, this model describes the variance of ion concentration on time with respect to the ion concentration only.
The constant ℬ describes the physiology of the plant species, phenotype or growth stages. It varies along the cell species because it is only affected by the membrane thickness, the diffusion constant of ion and combined resistance of ion channel. Membrane thickness of plant cells are not so different along the species and the diffusion constant is ion-related value. Therefore, ℬ is only affected by the physiological factor such as density and kind of ion channel.
S is the surface area where ion flows. It is defined as the inner area of ion channel multiplied with the number of ion channels. It is most influenced by the growth of plant’s root.
𝐷𝐴√𝑀 describes the physical property of the ion, while (𝑘𝑁𝐹)1.5 describes the electrical property.
1 √𝑉𝑚
𝑑
𝑑𝑡𝑉𝑚 can be derived with Goldman’s equation. It depends on the environment (nutrient solution) and describes the interaction between the root cell and the surrounding.
B. Anion Absorption Model
Anion is absorbed as symport at the root. As it requires an ion to collide with H+ ion at the channel, I described it like
equations (1-3). Let w as the number of electrons which an ion acquired. Then the ODE model for anion influx is described as equation (20) where τ is a coefficient related to anion absorption.
𝑑[𝑖𝑜𝑛]
𝑑𝑡 = −τ[ion][𝐻
+]𝑘 (20)
C. ODE Network Simulation
I combined the ODE network simulation on nutrient solution system [1] with plant’s ion absorption behavior. Detailed interactions, equations and coefficients are provided at my GitHub repository, with the simulator.
https://github.com/needleworm/nutrient_solution
III. EXPERIMENT
The experiment has one supposition that the membrane gradient is mainly induced by H+ only because permeability coefficients are required to describe multiple ion interactions.
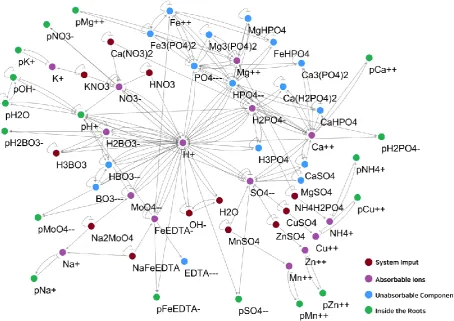
The topology of the ODE complex system network model for interactions between nutrient solution and plant is
described on the Figure 1, which was drawn with Cytoscape. [11] Total 20 different conditions were applied to perform the simulation. Same set of reaction rate coefficients and coefficient for H+ ion pumping rate were applied to all simulation. But different values of cation absorption coefficient ℬ and anion absorption coefficient τ were applied on each simulation to verify that only change on ℬ and τ can lead to different ion-absorption tendencies.
The initial states of the nutrient solution systems were fixed as Yamazaki’s nutrient solution for lettuce [12], and the initial states of plants were considered as an 1L bag of H2O, containing no other nutrient inside. Coefficient sets with ODE network models are presented on the Supplementary Data 1, at my ResearchGate repository.
https://www.researchgate.net/publication/341997283
The simulations were conducted until mean square error values between each temporal-distance gradient descent update reach 1e-20. But trial 18 and 19 converged too fast so tighter MSE threshold was applied: 1e-21 and 1e-22 each.
The template is used to format your paper and style text. All margins, column widths, line spaces, and text fonts are Figure 2. The network topology of plant and nutrient solution interaction model
prescribed; please do not alter them. You may note peculiarities. For example, the head margin in this template measures proportionately more than is customary. This measurement and others are deliberate, using specifications that anticipate your paper as one part of the entire proceedings, and not as an independent document. Please do not revise any of the current designations.
IV. RESULTS
Summarized Results are presented on Figure 3-5. Detailed information on the convergence states from the experiments are provided as Supplementary Data 2, at my ResearchGate Repository.
https://www.researchgate.net/publication/341997426
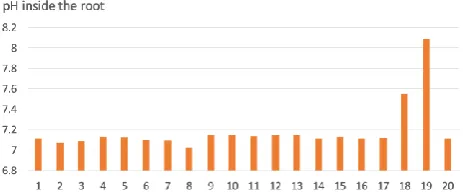
A. pH
Figure 3 shows the pH values inside the root at the convergence state. The initial values of all experiments were set to 7.0 but all results showed increase because of active transport of H+ ion. The root cells continuously try to emit H+ ion to build a gradient along the cell membrane, which is the key mechanism of nutrient absorption. Also, increase of pH inside the root indicates the decrease of pH of nutrient solution; just same as commonly-known phenomenon.
The experiment samples showed that different sets of cation and anion absorption coefficient lead to different absorption results. Sample 18 and 19 showed higher result than other conditions. They had smaller anion absorption coefficient values.
B. TDS
TDS values at the convergence states are described in figure 4. Most sample absorbed more than 50% nutrients from the nutrient solution, except trial 4, 5, 10, 18 and 19. The result shows that the absorption efficiency is defined with two coefficients ℬ and τ. Note that the values are measured at the convergence state. The values change very little, although more time is allowed.
C. NPK Rate
Figure 5 describes the rate of N, P and K absorbed by the root in mass scale. Some samples such as trial 6, 17, 18 and 19 seem to fail to absorb balanced nutrition. Figure 5 simply shows the coefficients ℬ and τ influences on the ion absorption tendencies.
V. DISCUSSION
Only equation (19) was applied to describe the secondary transport of cations and it showed that suggested model for cation absorbance performed well combined with previous technology. [1] The experiment showed that different coefficient variation on cation absorption coefficient ℬ and anion absorption coefficient τ for same network topology can lead to different nutrition absorbance tendencies.
As ℬ is description of ion channel and membrane thickness, I consider it as physiological term resulting from the gene expressions. Therefore, I suppose that each plant species has different ℬ values, leading to different recipe for fertilization. For example, the nutrient solution recipe for lettuce is different with the recipe for basil because their gene expression patterns are different, leading to different ℬ and τ values.
Inappropriate sets of coefficients leaded to failure of nutrient absorption. I think it is possible to predict the coefficient heuristically, repeating simulation for comparison between simulation result with actual ion absorption data. Figure 3. pH inside the root at the convergence state
Every sample showed that pH inside the root increases at the convergence state.
Figure 4. Total dissolved mass (TDS) of nutrient solution at the root
The amount of nutrients remaining in the nutrient solution is indicated as orange. Ions absorbed by plant is indicated as yellow.
Figure 5. Mass rate of N, P and K inside the root at the convergence state.
Nutrient uptake rate at the convergence state differs.
VI. CONCLUSION
I suggested an ordinary differential equation model to investigate ion absorption of plant. The equation for cation absorption contains parameters for plant physiology, growth, kinetic properties of ion and electrical properties of ion. It describes the amount of absorbed ion per time, with respect to the derivative of membrane potential induced by ion particles. Anion absorption model simply had a parameter to describe absorption rate, which is similar to reaction rate coefficient. Anion absorption rate is influenced by the collision rate of anion and H+ ions. Both cation absorption rate coefficient ℬ and anion absorption rate τ values are influenced by the properties of ion channels, such as density or activities. Therefore, individual nutritional ion absorption rate is influenced by gene expressions or phenotypes of the plant. This model is compatible with ODE network model for nutrient solution system. Simulation result showed that different values of cation absorption rate coefficient ℬ and anion absorption rate τ lead to different nutrition uptake tendency. If the coefficients of a plant species are discovered with experiment or simulation, the model would provide in-silico predictions of root-nutrient interaction of real plant.
ACKNOWLEDGMENT (Heading 5)
This work was supported by Agriculture, Food and Rural Affairs Convergence Technologies Program for Educating Creative Global Leader funded by the Ministry of Agriculture, Food and Rural Affairs (MAFRA, Korea). [Project Number 1545020852].
REFERENCES
[1] Ban, Byunghyun, Minwoo Lee, and Donghun Ryu. "ODE Network Model for Nonlinear and Complex Agricultural Nutrient Solution System." 2019 International Conference on Information and Communication Technology Convergence (ICTC). IEEE, 2019. (doi: 10.1109/ICTC46691.2019.8939946)
[2] Ban, Byunghyun, Donghun Ryu, and Minwoo Lee. "Machine Learning Approach to Remove Ion Interference Effect in Agricultural Nutrient Solutions." 2019 International Conference on Information and Communication Technology Convergence (ICTC). IEEE, 2019.
(doi: 10.1109/ICTC46691.2019.8939812)
[3] Ban, Byunghyun. "Pan-artifact Removing with Deep Learning, on ISEs." arXiv preprint arXiv:2005.13400 (2020).
(doi: 10.20944/preprints202005.0381.v1)
[4] Buysse, J., Smolders, E., Merckx, R., 1996. Modelling the uptake of nitrate by a growing plant with an adjustable root nitrate uptake capacity: I. Model description. Plant Soil 181, 19–23. [5] Claassen, N., Barber, S.A., 1974. A method for characterizing the relation between nutrient concentration and flux into roots of intact plants. Plant Physiol. 54, 564–568.
[6] Cram, W.J., 1983. Chloride accumulation as a homeostatic system: set points and perturbations. The physiological significance of influx isotherms, temperature effects and the influence of plant growth substances. J. Exp. Bot. 34, 1484–1502.
[7] Siddiqi, M.Y., Glass, A.D.M., 1986. A model for the regulation of Kq influx, and tissue potassium concentrations by negative feedback effects upon plasmalemma influx. Plant Physiol. 81, 1–7. [8] Silberbush, M., & Lieth, J. H. (2004). Nitrate and potassium uptake by greenhouse roses (Rosa hybrida) along successive flower-cut cycles: a model and its calibration. Scientia horticulturae, 101(1-2), 127-141.
[9] Pardossi, A., Falossi, F., Malorgio, F., Incrocci, L., & Bellocchi, G. (2005). Empirical models of macronutrient uptake in melon plants grown in recirculating nutrient solution culture. Journal of plant nutrition, 27(7), 1261-1280.
[10] Massa, D., Mattson, N. S., & Lieth, H. (2008). An empirical model to simulate sodium absorption in roses growing in a hydroponic system. Scientia horticulturae, 118(3), 228-235. [11] Shannon, P., Markiel, A., Ozier, O., Baliga, N. S., Wang, J. T., Ramage, D., ... & Ideker, T. (2003). Cytoscape: a software environment for integrated models of biomolecular interaction networks. Genome research, 13(11), 2498-2504.