The dynamics of regional economic integration in ASEAN + 3 countries
Riki Amir Kusnadi and Romora Edward Sitorus
Sampoerna School of Business, Universitas Siswa Bangsa Internasional, Indonesia
Abstract
This study reveals the level of overall, individual and pairwise integration among Association of Southeast Asian Nations (ASEAN), China, Japan and Korea (+3 countries) based on the real and financial aspects. The findings are as follows: First, ASEAN +3 countries experience a declining integration during 2008 financial crisis. Two years after the crisis, however, ASEAN +3 countries follow a positive integration trend. Second, Malaysia, China and Korea are the most integrated countries in ASEAN +3. Conversely, the least integrated (segmented) countries in ASEAN +3 are Japan and Singapore. Finally, the most integrated pair countries in ASEAN +3 are Malaysia and Singapore, Philippines and Thailand, as well as Indonesia and Philippines. In contrast, the most segmented pairs in ASEAN +3 are Japan and Philippines, Singapore and Thailand, and Indonesia and Malaysia. The result of this study is important for ASEAN policy makers to monitor and improve the level of integration in the region.
Keywords: Financial integration, real integration, ASEAN countries
Introduction
1ASEAN has recently formed the blueprint of ASEAN Economic Community (AEC) for 2015. Before AEC was initiated, South East Asian countries have formed an economic and cultural “alliance” called ASEAN. ASEAN was founded on 8 August 1967. Since its establishment, ASEAN is initiated to create various cooperation in several aspects such as economic, social, technical and educational aspects. The founding fathers of ASEAN expect that each ASEAN member countries live peacefully based on principles of the United Nations Charter (Secretariate, 2013).
During recent decades, Association of South East Asia Nations (ASEAN) has been an important region for foreign investors to put their real and portfolio investments. Because ASEAN markets are strongly guided by the principle of open market economy and rule-based system, ASEAN has risen to a friendlier trading and investment environment over time. According to Umutlu et al. (2010), the increasing initiatives regarding market liberalization all over the world, particularly in ASEAN. The positive benefit of liberalization has been supported by several studies that
Asian Journal of Empirical Research
The progress of economic integration is critical to transform emerging country in ASEAN into a well-developed country. Eatwell et al. (1987) argues that economic integration is “a process and as a state of affairs”. In case of ASEAN, financial integration could mean less restricted cross-border transactions. Hence, financial integration improves the function of local financial system by intensifying the competition in financial services (Levine, 2001), Klein & Olivei (2000), which will be shadowed by positive growth possessions. In similar vein, financial integration could also enable risk-sharing, production specialization, and capital allocation (Obstfeld, 1994).
Similarly, Bekaert et al. (2013) also reveals a membership in the economic community can significantly lower interest rate differentials among countries (financial integration) and reduce the expected earnings growth rate differentials (economic integration). Besides, increasing degree of ASEAN regional economic integration initiatives (more market liberalization) may have large impact for economic stability. According to Yu et al. (2010), financial integration between economies may strengthen countries capacity to withstand shocks and improve financial development. However, higher integration may also increase the risk of financial contagion across countries, because the country member becomes more interdependent (Beine et al., 2010).
From the perspective of individual investors, regional economic integration may reduce the possibilities of diversification. This fact has attracted previous studies to explore the integration of ASEAN stock markets. For instance, Ng (2000) demonstrated that stock market returns of Indonesia, Philippines, Singapore, and Thailand are closely linked to each other in the period 1993-1997, even though there is no evidence of co-integration relationship between those markets before 1990. Further evidence by Yang et al. (2003) also concluded that, correlation among Asian emerging markets is getting stronger after Asian financial crisis. In contrast, Click and Plummer, (2005), argued that the integration of ASEAN-5 (Indonesia, Malaysia, the Philippines, Singapore, and Thailand) is far beyond complete.
Furthermore, Yu et al. (2010) shows that ASEAN leaders have launched several important regional initiatives after Asian financial crisis of 1997-1998, include Chiang Mai Initiatives (CMI), and the Asian Bond Markets Initiative. Especially for Chiang Mai Initiative, it drive a creation on a bilateral swap arrangements among ASEAN+3 countries (ASEAN with China, Japan, and South Korea) to solve the issues of short-term liquidity. Additionally, ASEAN also introduces two other capital market initiatives, such as: Asian Bond Market Initiatives (ABMI), which develops efficient and liquid bond market in Asia and Asian Bond Fund (ABF), which promoting product innovation and improves bond market infrastructures.
Apart of the initiatives above, ASEAN also committed to increase their cross-border trade and economic activities. At the 2003 ASEAN Summit in Bali, ASEAN leaders have agreed to creat ASEAN Economic Community (AEC) by 2020. The Community is supposed to be a single consumption and production base with free flow of goods, services, investment, capital and skilled labor (Hew & Soesastro, 2003). The AEC is followed by several initiatives, including: a) Fast-track integration of eleven priority sectors, b) Faster customs clearance, c) Reduced barriers to trade, d) accelerated mutual recognition arrangements (MRAs), and harmonization of standards and technical regulations.
integration. b) Quantity-based measures which measures capital mobility. For example, Feldsten and Horioka (1980) and Isakkson (2001) which consider the savings-investment correlation as a measure of capital mobility.
The initiation of AEC has not been followed by formal measurement of regional economic integration itself. According to Cavoli (2012), there are no measurements of real and financial integration that can conceal all of the significant characteristics, which can elucidate certain individual aspects of integration or drive the overall aspect which it is involved among East and Southeast Asia economics. This study attempts to fill the gap by providing an indicator to monitor, assess and evaluate the regional economic integration particularly in ASEAN +3. Furthermore, this study intends to measure the degree of economics integration by combining real and financial integration by extending the work of Cavoli (2012). This study proposes the correlation of Macro Index, an index that combines the information of various macroeconomic variables, as a measure of the degree of economic integrations. Following Cavoli (2012), Macro Index consists of 6 Variables that contain real and financial aspect such as GDP growth rate, Exchange Rate, Trade Intensity, Inflation, Interbank Interest rate and stock market return.
The differences between this study and previous literatures are as follows: First, this study introduces a simple measure that can utilize relatively easy-to-access data. Second, this paper is able to capture a dynamics of regional integration from time to time. Third, using principal component analysis, this study aggregated several macro variables with different weighting. Each weight is calculated to ensure the important variable consider the most. This paper, however, is not designed to capture non-linear dependent structure between countries in ASEAN.
The problem in this paper can be defined as follows: First, which is the most integrated with other ASEAN + 3 countries? Second, which are the least integrated country with other ASEAN + 3 countries? Finally, what is the progress of overall integration and each individual country? Thus, he objective of this study is to help stakeholder of ASEAN (Government, investor, researcher and academics) to determine which the most integrated and the least integrated country in ASEAN and understand the current state and development of integration in ASEAN region.
The remainder of this study is organized as follows. In section 2, we discuss the data and methodology used to quantify integration in various markets. Section 3 presents the result and the pattern of integration. Finally Section 4 concludes.
Data and research methodology
Data and sample selection
This research uses annual panel data between 2000 and 2012 from Thompson – Reuters Data Stream, World Bank and Asian Development Bank as shown in Table 1.
Table 1: Data sources
Variable Source
GDP Growth World Bank
Gross Domestic Product Growth rate (Business cycle): GDP growth is related with fluctuations in Gross Domestic Product (GDP). It is more synchronized between financially integrated economies. It shows that GDP growth patterns are more correlated between financially integrated economies. Thus there is a tendency of financially integrated economies display high correlations in GDP growth, (Imbs, 2006). The equation is used to calculate GDP growth is:
𝐺𝐷𝑃 𝐺𝑟𝑜𝑤𝑡ℎ = 𝐺𝐷𝑃𝑡− 𝐺𝐷𝑃𝑡−1 𝐺𝐷𝑃𝑡−1
Trade Intensity: High trade intensity would drive to high economics integration. Otherwise, low trade intensity would drive the opposite. (Tesar, 1993) Moreover, traded goods also affected on financial market integration (Imbs, 2006). The equation is used to calculate trade intensity is:
𝑇𝑟𝑎𝑑𝑒 𝐼𝑛𝑡𝑒𝑛𝑠𝑖𝑡𝑦 = 𝐸𝑡+ 𝐼𝑡 𝐺𝐷𝑃𝑡
where Et is Exports and It is Imports
Inflation: Inflation is also became an important element for economic integration since the expansionary effects of a country can be lower and decreased due to rising inflation pressure in other country. The equation is used to calculate inflation is
𝐼𝑛𝑓𝑙𝑎𝑡𝑖𝑜𝑛 = 𝐶𝑃𝐼𝑡− 𝐶𝑃𝐼𝑡−1 𝐶𝑃𝐼𝑡−1 × 100
where CPI equals to Consumer Price Index
Exchange Rate: Integration of economic can be resulted from exchange rate because there are an association between exchange rate and economic development.
Interbank Interest Rate: Interbank market integration makes borrowing easier and loan rates lower. (Ongena & Popov, 2011).
Stock Market Return2: Studies from Alexakis & Vasila (2013) documents that, Stock market return is important since more integrated and liquid equity markets would drive to less risky and easier of access. The equation is used to stock market return is
𝑆𝑡𝑜𝑐𝑘 𝑟𝑒𝑡𝑢𝑟𝑛 = 𝑃𝑡− 𝑃𝑡−1 𝑃𝑡−1
Where Pt stands for stock price index at year t
Research methodology
The method of analysis that is used in this research is principal component analysis (PCA). PCA is a non-parametric statistical tools that could extract essential information from large data. PCA helps to minimize a large data set into a smaller dimension and thus simplify the dynamics of the data. Our study implements PCA because it has an aptitude to compress the information from the data and reduce the number of dimension without much loss of essence of the information itself.
Following Donadelli and Paradiso (2014), we calculate integration among ASEAN equity markets by utilizing PCA. PCA is used to show the main characteristics of the data. If T is a vector of n variables t,t1,t2,...tp. Then, we can create a compilation of the variables as the following:
𝛨 = 𝛺 . 𝑡 (1)
Where the first row in Eq. (1) have the form h1 =Ω1t=w11t1+ w12t1+...+ w1ptp. The coefficients t11, t12, ....,t1p are the loadings, and Ω is the loading matrix. Furthermore, this study extracts the covariance and correlation matrix from PCA to calculate the principal components.
Empirical results
Descriptive statistics
Table 2: Descriptive statistics of overall ASEAN +3 regions
GDP Trade intensity Exchange rate Inflation Interbank Stock market return
Mean 0.0479 0.9781 1328.6446 0.0308 0.0760 0.1127
Standard Error 0.0052 0.0293 22.4125 0.0034 0.0087 0.0785
Median 0.0487 1.0094 1302.2869 0.0286 0.0691 0.1395
Standard Deviation 0.0189 0.1058 80.8094 0.0124 0.0312 0.2831
Sample Variance 0.0004 0.0112 6530.1559 0.0002 0.0010 0.0801
Kurtosis 1.2862 -1.2647 0.0745 1.8918 0.7137 0.5267
Skewness -0.3888 -0.5641 0.8152 0.9212 1.1341 -0.2073
Range 0.0758 0.3147 266.0572 0.0494 0.1005 1.0969
Minimum 0.0067 0.7892 1217.6994 0.0113 0.0442 -0.4597
Maximum 0.0825 1.1039 1483.7566 0.0608 0.1447 0.6372
Sum 0.6227 12.7155 17272.3801 0.4008 0.9874 1.4654
Count 13.0000 13.0000 13.0000 13.0000 13.0000 13.0000
Table 3: Descriptive statistics of ASEAN +3 by individual countries
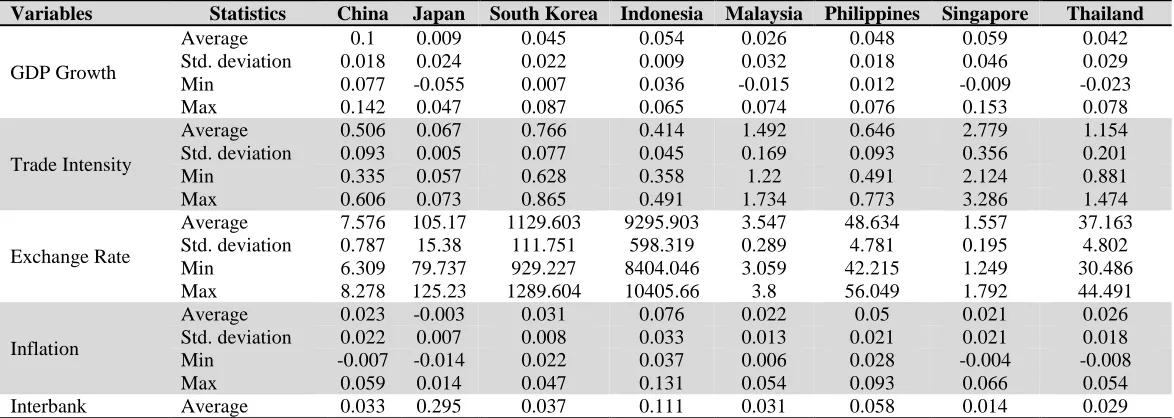
Variables Statistics China Japan South Korea Indonesia Malaysia Philippines Singapore Thailand
GDP Growth
Average 0.1 0.009 0.045 0.054 0.026 0.048 0.059 0.042
Std. deviation 0.018 0.024 0.022 0.009 0.032 0.018 0.046 0.029
Min 0.077 -0.055 0.007 0.036 -0.015 0.012 -0.009 -0.023
Max 0.142 0.047 0.087 0.065 0.074 0.076 0.153 0.078
Trade Intensity
Average 0.506 0.067 0.766 0.414 1.492 0.646 2.779 1.154
Std. deviation 0.093 0.005 0.077 0.045 0.169 0.093 0.356 0.201
Min 0.335 0.057 0.628 0.358 1.22 0.491 2.124 0.881
Max 0.606 0.073 0.865 0.491 1.734 0.773 3.286 1.474
Exchange Rate
Average 7.576 105.17 1129.603 9295.903 3.547 48.634 1.557 37.163 Std. deviation 0.787 15.38 111.751 598.319 0.289 4.781 0.195 4.802
Min 6.309 79.737 929.227 8404.046 3.059 42.215 1.249 30.486
Max 8.278 125.23 1289.604 10405.66 3.8 56.049 1.792 44.491
Inflation
Average 0.023 -0.003 0.031 0.076 0.022 0.05 0.021 0.026
Std. deviation 0.022 0.007 0.008 0.033 0.013 0.021 0.021 0.018
Min -0.007 -0.014 0.022 0.037 0.006 0.028 -0.004 -0.008
Max 0.059 0.014 0.047 0.131 0.054 0.093 0.066 0.054
Std. deviation 0.012 0.266 0.008 0.045 0.005 0.022 0.01 0.01
Min 0.014 0.075 0.024 0.07 0.021 0.029 0.003 0.014
Max 0.065 0.844 0.054 0.206 0.04 0.091 0.033 0.054
Stock Market Return
Average 0.186 -0.029 0.101 0.23 0.084 0.124 0.063 0.144
Std. deviation 0.745 0.208 0.26 0.386 0.198 0.304 0.256 0.32
Min -0.661 -0.461 -0.401 -0.462 -0.33 -0.435 -0.477 -0.453
Macro indexes
To measure the degree of integration, this study creates a macro as a component for the correlations. Thus, in order to get a normalize data, this research conduct the following steps:
First, calculate a 4 times moving average from 3 consecutive years before the current year. For instance, 2005, 2004, 2003, and 2002 data should be averaged, in order to get 2005 4 times moving average data.
Second, multiply those data by 2 times with averaging 2 sequence data of the year. For example, a 2 x 4 times moving average on year of 2003 is contained average of 2 of 4 times moving average data which are 4 times moving average of 2003 and 4 times moving average of 2002 while 4 times moving average of 2003 is contained an average of 2003, 2002, 2001 and 2000 data and it is also applied on 4 times moving average of 2002 which contained an average of 2002, 2001, 2000 and 1999 data.
Third, determine the de-trend factor by dividing the actual data with 2 x 4 moving average data. For instance, to determine de-trend factor for year of 2006 data, we should divided 2006 of actual data with 2 X 4 moving average data that is contained several moving average on previous explanation.
Fourth, after de-trend factor is found, then multiply it with actual data.
Fifth, find the average of the de-trended data and subtracted the de-trended data with the average (X- 𝑋̅ ) in order to obtain a normalize data.
Table 4: Eigen value and Eigen vectors of ASEAN +3
Eigen Vector China Japan South Korea Indonesia Malaysia Philippines Singapore Thailand
Exchange rate -0.061 -0.347 -0.713 -0.026 -0.306 0.7 -0.329 0.572
GDP Growth 0.029 -0.033 -0.009 0.027 0.142 0.027 0.022 0.067
Inflation 0.022 -0.001 -0.019 -0.13 0.05 0.017 0.04 -0.023
Interbank Interest rate -0.001 0.9 0.015 0.985 0.01 0.109 0.003 -0.012
Stock Market Return 0.988 -0.261 0.652 -0.099 0.215 0.073 0.104 0.372
Trade Intensity 0.138 0 0.256 0.032 0.915 0.702 0.938 -0.728
Proportion 0.925 0.913 0.668 0.799 0.797 0.68 0.917 0.852
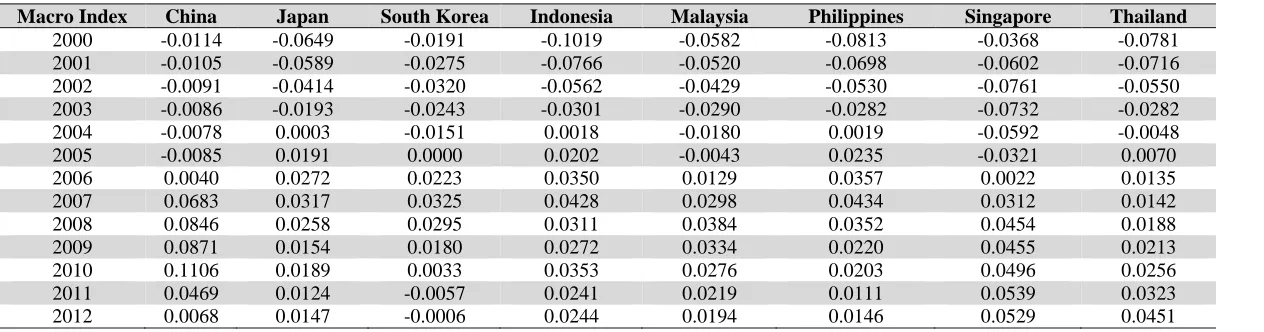
Table 5: Macro index of ASEAN + 3 countries
Macro Index China Japan South Korea Indonesia Malaysia Philippines Singapore Thailand
2000 -0.0114 -0.0649 -0.0191 -0.1019 -0.0582 -0.0813 -0.0368 -0.0781
2001 -0.0105 -0.0589 -0.0275 -0.0766 -0.0520 -0.0698 -0.0602 -0.0716
2002 -0.0091 -0.0414 -0.0320 -0.0562 -0.0429 -0.0530 -0.0761 -0.0550
2003 -0.0086 -0.0193 -0.0243 -0.0301 -0.0290 -0.0282 -0.0732 -0.0282
2004 -0.0078 0.0003 -0.0151 0.0018 -0.0180 0.0019 -0.0592 -0.0048
2005 -0.0085 0.0191 0.0000 0.0202 -0.0043 0.0235 -0.0321 0.0070
2006 0.0040 0.0272 0.0223 0.0350 0.0129 0.0357 0.0022 0.0135
2007 0.0683 0.0317 0.0325 0.0428 0.0298 0.0434 0.0312 0.0142
2008 0.0846 0.0258 0.0295 0.0311 0.0384 0.0352 0.0454 0.0188
2009 0.0871 0.0154 0.0180 0.0272 0.0334 0.0220 0.0455 0.0213
2010 0.1106 0.0189 0.0033 0.0353 0.0276 0.0203 0.0496 0.0256
2011 0.0469 0.0124 -0.0057 0.0241 0.0219 0.0111 0.0539 0.0323
Correlation analysis
Following Volosovych (2011), Goetzman et al. (2005), Obstfeld and Taylor (2004), this paper forms a measure of integration based on time series correlations of macro index across countries over period of time. This paper argues that a higher correlation of macro index (a combination of price and quantity criteria) among markets could be an evidence of integration. This paper also have the same principle from Rodgers and Nicewander (1988) studies, which document that, correlation can measure of linear association between variables, can be understood as share of variance in one variable accounted for by differences in the other, and can be expressed as the middling of cross-product of the standardized variables.
To provide a comprehensive measure of integration. This study employ correlation analysis that are comprised of 3 steps as follows: First, Clustered correlation, calculated by averaging 3, 4, and 5 year rolling correlation for each clustered of countries (ASEAN, ASEAN +3, and +3 Countries). Second, Individual average correlations, measured by averaging of pairwise 3,4, and 5 year rolling correlation for each member of ASEAN +3. Third, Individual pairwise correlation, conducted by calculating pairwise correlation for each countries with the other countries.
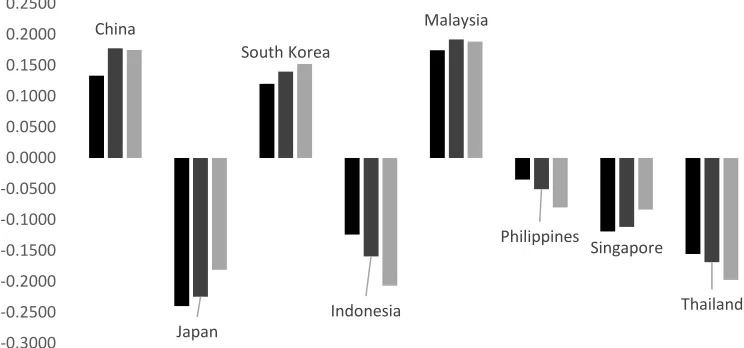
Moreover, this study performs some tests on correlations consistency based on average of correlations among ASEAN +3 countries. Based on average correlations, it can be shown from figure 1 that the most correlated country in ASEAN +3 is Malaysia, followed by China and Korea. The 3, 4, and 5 rolling correlation of Malaysia is as much as 0.1743, 0.1920, 0.1884 value. This result is followed by 3, 4, and 5 years rolling correlation of China (0.1333, 0.1775, and 0.1748) and Korea (0.1199, 0.1400, and 0.1522). This result is aligned with Cavoli (2012) which find that China, and Japan are highly integrated with global capital markets.
Figure 1: Rolling correlation consistency of ASEAN +3 countries for 3, 4, and 5 year
In sum, it can be seen that the rolling correlations based on 3,4 and 5 years rolling correlations are positive for China, South Korea and Malaysia. The remaining countries shows negative correlations.
Clustered correlation analysis
Figure 2 gives an overview of the output of the rolling correlation for the ASEAN +3 countries historically from 2006 until 2012. The level of integration is measured by the degree of
correlation, the closer the correlation value to one, the higher the integration. Similar to that, the closer correlation values to minus one, the lower the integration.
Figure 2: Historical clustered of integration use 3 year rolling correlation
From figure 2, this study shows that the level of integration pre and post-global financial crisis period using 3 year rolling correlation. Since 2006, ASEAN +3 countries shows positive trend until 2008. The trend reversed as the integration falls after the financial crisis. In 2010, ASEAN +3 countries, start to show improvement in the level of integration, from 0.0332 (2011) to 0.1558 correlation in 2012.
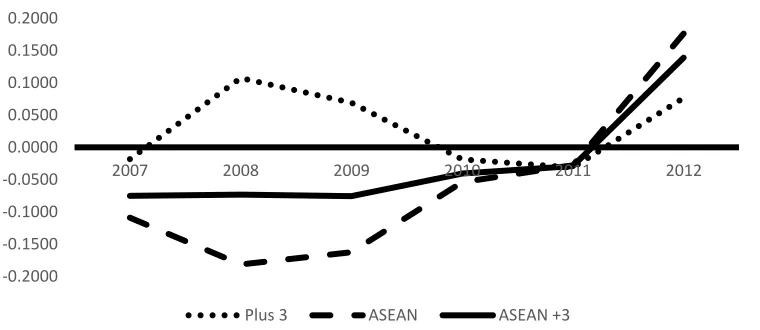
Figure 3: Historical clustered of integration use 4 years rolling correlation
From figure 3, by using 4 years of rolling correlation, this study reveals that since 2007, ASEAN +3 countries shows positive trend until 2009. The trend changes as the integration drops after the financial crisis. In 2010, ASEAN +3 countries, start to show a significant different in the level of
-0.3000 -0.2000 -0.1000 0.0000 0.1000 0.2000 0.3000
2006 2007 2008 2009 2010 2011 2012
Plus 3 ASEAN ASEAN +3
-0.2000 -0.1500 -0.1000 -0.0500 0.0000 0.0500 0.1000 0.1500 0.2000
2007 2008 2009 2010 2011 2012
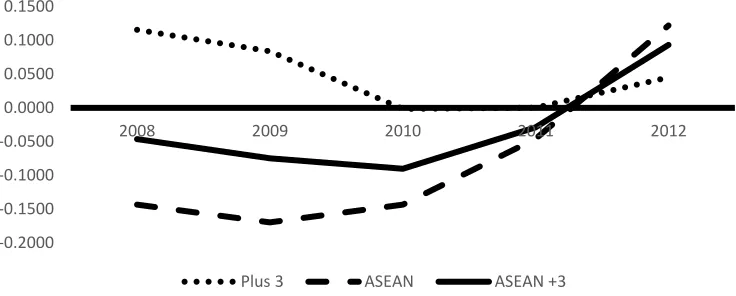
Figure 4: Historical clustered of integration use 5 years rolling correlation
Furthermore, using 5 years of rolling correlation, figure 4 documents that since 2008, ASEAN +3 countries shows negative trend until 2009. The trend inverted as the integration decrease after two years the financial crisis. In 2011, ASEAN +3 countries, begin to show a significant different in the level of integration, from -0.0287 (2011) to 0.0932 correlation in 2012.
From figure 4, this study reveals that, ASEAN countries are not really integrated as well as China, Japan and Korea. Used an average of correlation, China, Japan and Korea is more integrated with ASEAN +3 with indicating 0.0486 average of correlation, compare to -0.0293 which ASEAN countries have. However, when global financial crisis is happen at year 2008, one year afterwards, ASEAN indicating an opposite movement with China, Japan and Korea, compare to their degree of integration that is jump off from 0.838 to -0.015 correlation. ASEAN countries correlation rise from -0.1697 to -0.1434
Individual average correlation analysis
Further, this research reveals the progress of economic integration in ASEAN +3 as well as investigate lurking fact that on economic integration of ASEAN +3, in the interval of 2006 to 2012 with an analysis of individual countries degree of integration.
-0.2000 -0.1500 -0.1000 -0.0500 0.0000 0.0500 0.1000 0.1500
2008 2009 2010 2011 2012
Asian Journal of Empirical Research, 4(9)2014: 439-454
Furthermore, Figure 5 also presents the latest average pairwise 3, 4, and 5 rolling correlation in year 2012, it can be seen that, on average, Singapore is the least integrated/segmented country in ASEAN +3 on that particular time (average correlation equal to -0.5797). As for the member of +3 Countries, on average Japan is the most segmented country in year of 2012 (average correlation equal to -0.5386). From Figure 5 it can be documented that global financial crisis has significant impact to ASEAN +3 level of integration.
Some countries (i.e. : China, Malaysia and Korea) show U-shaped pattern, the integration decline during crisis but bounces back soon after crisis. Other countries (i.e. : Indonesia, Philippines and Thailand) show increasing pattern, the integration is low before crisis but gradually increased after crisis. Some countries (i.e. : Singapore and Japan) show declining pattern, the integration was high before crisis but slowly declining over time
Pairwise correlation analysis
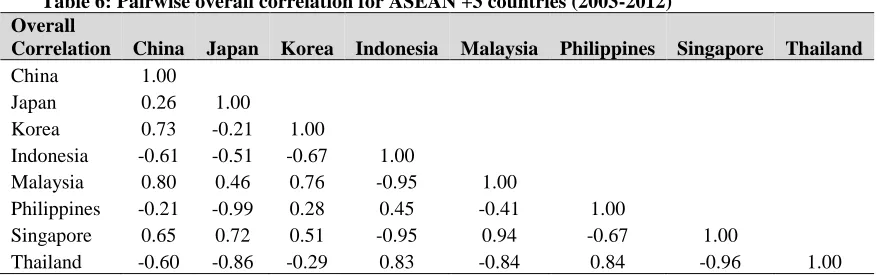
Table 6 below shows pairwise degree of integration using overall correlation between 2003 and 2012. The highest pairwise correlation is between Malaysia and Singapore with positive 0.94 values. Then, the second highest pairwise correlation among Philippines and Thailand is as much as positive 0.84. Following that, the third highest pairwise correlation is between Indonesia and Thailand with the value of positive 0.83.
Table 6: Pairwise overall correlation for ASEAN +3 countries (2003-2012) Overall
Correlation China Japan Korea Indonesia Malaysia Philippines Singapore Thailand
China 1.00
Japan 0.26 1.00
Korea 0.73 -0.21 1.00
Indonesia -0.61 -0.51 -0.67 1.00
Malaysia 0.80 0.46 0.76 -0.95 1.00
Philippines -0.21 -0.99 0.28 0.45 -0.41 1.00
Singapore 0.65 0.72 0.51 -0.95 0.94 -0.67 1.00
Thailand -0.60 -0.86 -0.29 0.83 -0.84 0.84 -0.96 1.00
Table 6 also documents the least integrated pair countries is between Japan and Philippine and is negative 0.99 correlation. This result is followed by pairwise integration between Singapore and Thailand, as well as Indonesia and Malaysia, for the value of negative 0.96 correlations and negative 0.95 correlations, respectively.
Moreover, Malaysia become the most integrated countries in ASEAN +3 because it has positive correlation with overall ASEAN +3 economies. In Malaysia, inflation is low with the average of 2.2% and it is not far from the average of inflation on ASEAN +3 in 3.08% .Their financial system is also on a stronger with average of composite stock market return in 8.35% from the average of ASEAN +3 stock market return of 11.27%.
The reason that Japan becomes the least integrated countries in ASEAN +3 is because it has negative correlation with overall ASEAN +3 economies. Studies from Kim and Wha-Lee (2008) concluded that real exchange rate against Japan is weaken against almost all countries.
Conclusions
based on clustered correlation analysis, this paper shows that ASEAN +3 countries experience a declining integration during 2008 financial crisis period. Two years after the crisis, however, ASEAN +3 countries seem to have positive integration trend. The declining integration during the crisis is likely happen as a result of the divergence of each individual country’s economic policies in amelioriating the impact of the financial crisis (Tang et al., 2013).
Second, by conducting individual average correlations analysis, this paper documents that Malaysia, China and Korea are the most integrated countries in ASEAN +3. On the other hand, the least integrated (segmented) countries in ASEAN +3 are Japan and Singapore. This finding is supported by the result of Cavoli (2012) that shows Malaysia and Korea as the most integrated countries in the region.
Third, using pairwise correlation analysis, this study concludes that the most integrated pair countries in ASEAN +3 are Malaysia and Singapore, Philippines and Thailand, as well as Indonesia and Philippines. In contrast, the most segmented pair in ASEAN +3 is Japan and Philippines, Singapore and Thailand, as well as Indonesia and Malaysia.
Although this paper has utilized new index measurement of economic integration by combining several real and financial variables, each of these variables may not fully explain the dynamics of economic condition. Thus, the findings of this study need to be interpreted cautiously. Moreover, further studies that attempt to build economic integration index need to include more, if any, other relevant macro variables.
References
Alexakis, P., & Vasila, A. (2013). On the integration of European capital markets. Managerial Finance, 39(9), 825-836.
Bae, K. H., Chan, K., & Ng, A. (2004). Investibility and return volatility. Journal of Financial Economics, 71(2), 239-263.
Beine, M., Cosma, A., & Vermuelen, R. (2010). The dark side of global integration: increasing tail dependence. Journal of Banking and Finance, 34(1), 184-192.
Bekaert, G., & Harvey, C. R. (2000). Foreign speculators and emerging equity markets. The Journal of Finance, 55(2), 565-614.
Bekaert, G., Harvey, C. R., & Lundband, C. (2005). Does financial liberalization spur growth? Journal of Financial Economics, 77(1), 3-55.
Bekaert, G., Harvey, C. R., Lundblad, C. T., & Siegel, S. (2013). The european union, the euro, and equity market integration. Journal of Financial Economics, 109(3), 583-603.
Cavoli, T. (2012). Exploring dimensions of regional economic integration in East Asia: More than the sum of its parts? Journal of Asian Economics, 23(6), 643-653.
Cheung, Y.-W., Chinn, M. D., & Fujii, E. (2007). The economic integration of greater China: real and financial linkages and the prospect for currency union. Hongkong: Hongkong University Press.
Chinn, M. D., & Frankel, A. J. (1994). Financial barrier in the pacific Basin. Journal of Economic Integration, 9(1), 62-79.
Eatwell, J., Milgate M., & Newman, P. (1987). The new palgrave: A dictionary of economics. Palgrave Macmillan.
Feldsten, M., & Horioka, C. (1980). Domestic savings and international capital flows. Economic Journal, 90, 314-329.
Goetzman, W. N., Li, L., & Rouwenshorst, K. G. (2005). Long term global market correlation. Journal of Business, 78(1), 1-37.
Henry, P. B. (2000). Stock market liberalization, economic reform, and emerging market equity prices. The Journal of Finance, 55(2), 529-564.
Hew, D., & Soesastro, H. (2003). Realizing the ASEAN economic community by 2020: ISEAS and ASEAN-ISIS approaches. ASEAN Economic Bulletin, 20(3), 292-296.
Imbs, J. (2006). The real effects of financial integration. Journal of International Economics, 68(2), 296-324.
Isakkson, A. (2001). Financial liberalization, Foreign aid, and capital mobility: Evidence from 90 developing countries. Journal of International Financial Markets, Institution, and Money, 11(3), 309-338.
Kim, S., & Wha-Lee, J. (2008). Real and financial integration in East Asia. Asian development bank working paper on regional economic integration No. 17.
Klein, M. W., & Olivei, G. P. (2000). Capital account liberalization, Financial depth, and economic growth. Journal of International Money and Finance, 27(6), 861-875.
Levine, R. (2001). International financial liberalization and economic growth. Review of International Economics, 9(4), 688–702.
Moshirian, F. (2008). Globalisation, growth and institutions. Journal of Banking and Finance, 32(4), 472-479.
Ng, A. (2000). Volatility spillover effects from Japan and the US to the Pacific-Basin. Journal of International Monetary and Finance, 19(2), 207-233.
Obstfeld, M. (1994). Risk-taking, global diversification, and growth. The American Economic Review, 84(5), 1310–1329.
Obstfeld, M., & Taylor, A. M. (2004). Global capital markets: Integration, crisis, and growth. New York: Cambridge University Press.
Ongena, S., & Popov, A. (2011). Interbank market integration, loan rates, and firm leverage. Journal of Banking and Finance, 35(3), 544-560.
Phillipapatos, G. C., Christofi, A., & Christofi, P. (1983). The inter-temporal stability of international stock market relationships: Another view. Financial Management, 12(4), 63-69.
Rodgers, J. L., & Nicewander, W. A. (1988). Thirteen ways to look at the correlation coefficient. The American Statistician, 42(1), 59-66.
Secretariate, A. (2007). ASEAN Economic Community Blueprint. Jakarta: ASEAN Secretariate. Stockman, A., & Tesar, L. (1995). Tastes and technology in a two-country model of the business
cycle: Explaining international co-movements. The American Economic Review, 85(1), 168-185.
Tang, H. C., Liu, P., & Cheung, E. C. (2013). Changing impact of fiscal policy on selected ASEAN countries. Journal of Asian Economics, 24, 103-116.
Tesar, L. (1993). International Risk Sharing and Non-Traded Goods. Journal of International Economics, 35(1), 69-89.
Umutlu, M., Akdeniz, L., & Altay-Salih, A. (2010). The degree of financial liberalization and aggregated stock-return volatility in emerging markets. Journal of Banking and Finance, 34(3), 509-521.
Volosovych, V. (2011). Measuring financial market integration over the long run: Is there a U-shape? Journal of International Money and Finance, 30(7), 1535-1561.
Yang, J., Kolari, J. W., & Min, L. (2003). Stock market integration and financial crisis: The case of Asia. Applied Financial Economics, 13(7), 477-486.