Article
1
Preparation, characterization, and sludge
2
conditioning of cationic polyacrylamide synthesized
3
by a novel UV-initiated system
4
5
Qingqing Guan1,*, Guocheng Zhu 2, Yi Liao c, Jin Xu 1, Xiaoxu Sun 1, Fang Tian 1, Jiaxing Xu 1
6
and Minghan Luo 1
7
1 Department of the Environmental Engineering, Nanjing Institute of Technology, 1 Hongjing Avenue,
8
Nanjing 211167, People’s Republic of China; [email protected] (Q.G.); [email protected](J.X.);
9
[email protected](X.S.); [email protected](F.T.); [email protected](J.X.); [email protected](M.L.)
10
2 College of Civil Engineering, Hunan University of Science & Technology, Xiangtan, 411201, People’s
11
Republic of China; [email protected](G.Z.)
12
3 Department of Civil Engineering, Sichuan University of Science and Engineering, Zigong, Sichuan 643000,
13
People’s Republic of China; [email protected](Y.L.)
14
* Correspondence: [email protected] ; Tel.: +86 25 86118973
15
16
Abstract: Controlling the concentration of free radicals in polymerization systems is advantageous
17
for preparing cationic polyacrylamide (CPAM) with high molecular weight and acceptable
18
dissolvability. In this study, a novel ultraviolet (UV)-initiated system characterized with adjustable
19
light intensity and redox-azo complex initiator was used to synthesize a CPAM flocculant named
20
NP. Comparatively, another CPAM flocculant named SP with stable UV light intensity and single
21
initiator was prepared. The chemical structure, morphology, and thermal stability were analyzed
22
through instrumental analysis. Proton nuclear magnetic resonance indicated that NP was
23
successfully prepared, and a small fraction of cationic homopolymer was mixed in the product.
24
Polymerization conditions were optimized, and polymerization mechanism was determined by
25
investigating the effects of various parameters on intrinsic viscosity, conversion, and dissolvability.
26
Results showed that the best performance was obtained at indexes of 0.45 wt‰ redox initiator
27
concentration, 0.2 wt‰ azo initiator concentration, 40.0 wt% of cationic monomer, first- and
second-28
stage light intensities of 8.5 and 13 mW/cm2, respectively, and 3 wt% urea. Sludge conditioning
29
performances of NP and SP were comparatively evaluated, and the mechanism was determined by
30
investigating the sedimentation behavior and floc size distribution. High intrinsic viscosity, porous
31
morphology structure, and the mixed cationic homopolymer of NP resulted in better sludge
32
conditioning performance.
33
Keywords: polymer; characterization; sludge conditioning; UV; flocculant
34
35
1. Introduction
36
Considering that activated sludge process is an important treatment technology for a wide range
37
of wastewaters, the high annual increase in excess sludge, representing 1% or 2% of treated
38
wastewater and containing 50% to 80% of pollution, should be disposed. Sludge is difficult to dewater
39
because small negatively charged particles are consistently distributed in the form of a stable colloidal
40
suspension. Sludge conditioning prior to mechanical dewatering should be conducted to destabilize
41
particulate systems[1-3].
42
In recent years, cationic polyacrylamide (CPAM) has been widely used for sludge conditioning
43
because it can neutralize the surface charge of solid and bridge particles through its long polymer
44
chain to form large flocs that can reduce specific resistance and cake compressibility of sludge [4-6].
45
The molecular weight (MW) of CPAM, which can be characterized by intrinsic viscosity, is closely
46
related to bridging mechanism. With increasing polymer chain length, higher intrinsic viscosity leads
47
to higher bridging performance, with numerous particles becoming involved [7]. Zheng et al.
48
reported that a low filter cake moisture content (FCMC) was achieved with high-MW polymers under
49
the same dosage of flocculants[5,6,8]. Zhu et al. determined that the best sludge dewatering
50
performance is achieved by CPAM with the highest MW[4]. Zhou et al. indicated that the optimum
51
dosage of CPAM is negatively correlated with its MW if the MW of CPAM reaches above 5 million[9].
52
Thus, studies focusing on the preparation technology of CPAM constantly optimize the MW
53
synthesis conditions[10,11]. However, the dissolving time cannot be ignored although high-MW
54
CPAM contributes to sludge dewatering. The dissolving time for existing CPAM products can reach
55
several hours, a period considered long in practical applications[4]. Thus, MW and dissolving time
56
of CPAM should be considered at the same time.
57
Dissolving time highly depends on molecular configuration. Commonly, CPAM will be nearly
58
insoluble if molecular chains are cross-linked, whereas it will dissolve easily when the chain is
59
linear[12]. The molecular configuration of CPAM is closely related to its polymerization. Radical
60
concentration is a valuable tool to control organic polyelectrolyte chemical structure and achieve
61
varying intrinsic viscosity and dissolving time. The concentration of free radicals at appropriate levels
62
should be conducted appropriately as molecular chains will cross-link if the free radical concentration
63
is high, whereas polymerization reaction cannot proceed at low levels. High-MW CPAM should be
64
prepared to control the amounts of free radicals in polymerization systems. Agarwal et al. [13]
65
investigated the graft copolymerization of guar-g-(acrylamide (AM)-co-diallyl dimethylammonium
66
chloride) with cerous sulfate and potassium persulfate as complex initiators. The grafting ratio of
67
grafted copolymer was higher than those of similar studies, as shown in reactions (1) and (2) (GG
68
stands for guar gum):
69
C + → + ﹒,(1)
70
+ 2 → 2 + 2 .(2)
71
A certain concentration of Ce4+ with initiating activity can be maintained in the polymerization
72
system with the above reactions. Polymerization can be completely conducted; therefore, grafting
73
ratio increases. Zhao et al. [14] prepared high-MW CPAM using redox materials and azo salt as
74
complex initiators and controlled it to a low temperature for specific times; then, the prepared
75
material was subjected to increasing temperature. The decomposition activation energy of redox
76
initiators approximate 40 kJ/mol, whereas that of azo initiators reaches more than 100 kJ/mol[15,16].
77
Free radicals generated from redox initiator reaction under low temperature go copolymerization,
78
whereas azo salt produces free radicals under high temperature when the redox initiator is
79
exhausted. Therefore, high-MW CPAM polymerizes. However, polymerization and the effects of
80
complex initiation on flocculant dissolvability have not been elaborated. The polymerization
81
mechanism and control on radical concentration should be investigated. The aforementioned studies
82
were initiated by heating, which is time consuming, energy consuming, and difficult to control[17].
83
Our previous research indicated that ultraviolet (UV) initiation features low reaction temperature,
84
short polymerization time, high polymer MW, and environmental friendliness. UV light intensity can
85
be altered immediately and easy to control[10,18]. In the present study, a novel UV initiating system
86
characterized with adjustable light intensity and redox-azo complex initiators was established and
87
used to prepare CPAM flocculant (NP) by maintaining a certain concentration of free radicals.
88
Polymerization characteristics and mechanism of this novel complex UV initiation system were
89
comprehensively determined by investigating the effects of various parameters on intrinsic viscosity,
90
conversion, and dissolvability.
91
The primary objectives of this study are as follows: (1) to prepare NP with high intrinsic viscosity
92
and acceptable dissolvability with this novel UV initiation system using AM and
93
acryloxyethyltrimethyl ammonium chloride (DAC) as monomers; (2) to reveal the chemical
94
structures, morphology, and thermal stability using Fourier transform infrared spectrometer (FT-IR),
95
proton nuclear magnetic resonance spectrometer (1H NMR), thermogravimetry–differential
96
scanning calorimetry (TG-DSC), and scanning electron microscopy (SEM); (3) to determine the
97
polymerization mechanism and optimum preparation conditions by investigating the key aspects of
98
initiating conditions, such as redox initiator concentration, azo initiator concentration, mass ratio
99
viscosity, and dissolving time; (4) to evaluate NP sludge dewatering performance and mechanism by
101
investigating dosage dependence, sedimentation behavior, and floc distribution.
102
2. Materials and Methods
103
2.1 Materials
104
The monomer AM (98.5%, w/w) was obtained from Lanjie Tap Water Co., Ltd (Chongqing,
105
China). The cationic monomer DAC(80% in water) was supplied by Luyue Chemical Co., Ltd (Taian,
106
China).The photo initiator 2,2’-azobis(2-methylpropionamide)dihydrochloride (V50) was obtained
107
from Ruihong Biological Technology (Shanghai, China). AM, DAC and V50 were of industrial grade.
108
The other reagents used in the experiments, including ammonium persulfate, sodium bisulfate
109
ethanol, urea [CO(NH2)2], hydrochloric acid (HCl), and sodium hydroxide (NaOH), were of
110
analytical grade. The purity of nitrogen gas was higher than 99.9%. All reagents were used directly
111
without any further purification.
112
Table 1 Waste Sludge Characteristics
113
Moisture
content(%) Mass density(ml/g) pH Zeta potential(mV)
Conductivity( mS/cm)
98.9±0.15 0.989 7.38±0.14 -21.6±0.6 2.1±0.4
Raw waste sludge from the thickener of Jiangning Development Zone Drainage Co., Ltd.
114
(Nanjing, China) was used for this study. The samples after collection were stored in a refrigerator
115
maintained at 4 centigrade to minimize the microbial activity and analyzed within 3 days. The
116
characteristics of the sludge are listed in Table 1.
117
2.2 Preparation method
118
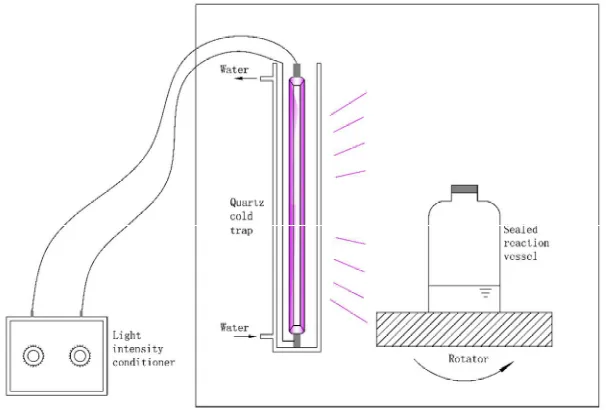
The preparation device scheme is shown in Figure 1. The preparation of NP was performed as
119
follows: AM, DAC, deionized water, and urea which acted as the cosolvent was first added to a
120
reaction vessel made of silicate glass. Initiator V50, ammonium persulfate and sodium bisulfate
121
were added during the purging of nitrogen gas for 30 min prior to UV activation. Through UV
122
(main radiation wavelength between 300 and 400 nm, 365 nm) light intensity was controlled for a
123
specific period and then turned to another intensity for a specific period, the flocculant was
124
produced, and the aqueous solution was changed into a translucent colloid. The copolymers were
125
purified with acetone and ethanol, followed by the process, of drying and grounding into powder.
126
acryloxyethyltrimethyl ammonium chloride) PDAC are referred to references[6,19].
128
129
Figure 1. The preparation device scheme
130
2.3 Characterization of the Copolymer
131
The FTIR of the copolymer and monomers were conducted using a 550 Series II infrared
132
spectrometer (Mettler-Toledo, Greifensee, Switzerland). The interval of the measured wave
133
numbers was from 500 to 4000 cm−1.
134
The 1H NMR spectra of the flocculant were recorded on Bruker AVANCE-500 spectrometer
135
(Bruker Company, Karlsruhe, Germany) in D2O solvent.
136
TG-DSC was carried out at a heating rate of 10 °C/min, a nitrogen flow rate of 20 mL/min, and
137
a temperature range of 20−600 °C on a DTG-60H synchronal thermal analyzer (Shimadzu, Kyoto,
138
Japan).
139
Electron samples were prepared by shattering, planishing, and spraying. Then, the samples
140
were dried, and SEM images were recorded on a VEGA II LMU instrument (TESCAN Company,
141
Brno, Czech Republic).
142
The conversion and the intrinsic viscosity of NP or SP were determined by the gravimetric and
143
one point method, respectively[11].The intrinsic viscosity was expressed in deciliter per gram(dL/g)
144
and measured in 1.0 mol/L NaCl solution with an Ubbelohde capillary viscometer (Shanghai Shenyi
145
Glass Instrument Co., Ltd., China) at 30 oC ± 0.05 oC.
146
The dissolving time was conducted as follows. About 0.04±0.002 g of the NP was added to a
147
200-mL beaker as the reaction vessel. Then, 100mL of distilled water was added into the reaction
148
vessel, which was placed in an oscillator. The temperature of the oscillator was controlled at 30
149
centigrade while the electrode of conductivity meter was inserted into the beaker to determine
150
whether the products completely dissolved or not. If conductance value did not change in 3 min,
151
the sample was considered completely dissolved. Finally, the time required for complete dissolving
152
the sample was recorded.
153
In this study,Buchner funnel test was applied to examine the conditioning ability of the
155
polymers[20]. The waste sludge was mixed by rapidly stirring at 200 rpm with paddle blade for 30 s
156
in the presence of a certain dosage of copolymer solution (0.2%, wt). After 10 min settling period,
157
residual turbidity (RT) sample was collected at 1 cm below the supernatant surface (Sinsche
TB-158
2000, China). Zeta potential measurement (Zetasizer Nano ZS90, Britain) was referred to
159
reference[20]. And the sludge floc size distribution was measured simultaneously (BT-9300H laser
160
particle size distribution analyzer, Dandong Bettersize Instruments Ltd., China). The conditioned
161
sludge was poured into a Buchner funnel to filter under a vacuum pressure of 0.05MPa for 30 min
162
or until the vacuum could not be maintained (in <30 min). The filterability of the sludge is
163
measured by Equation (3):
164
=
(3)165
where SRF is the specific resistance of the sludge (m/kg); P is the filtration pressure (N/m2); A is the
166
filter area (m2); μ is the viscosity of the filtrate (Ns/m2);ω is the weight of cake solids per unit
167
volume of filtrate (kg/m3, ω=(1/Ci)/((100Ci-Cf)/100Cf); Ci is the initial moisture content(%); Cf is the
168
final moisture content (%);b is the slope of filtrate discharge curve (t/V versus V) (s/m6), where t is
169
the filtration time (s) and V is the volume of the filtrate.
170
Filter cake moisture content (FCMC, %) of the conditioned sludge was determined using
171
Equation (4):
172
=
(4)173
where MT is the weight of filter cake after filtration (g) and Mf is the weight of filter cake after
174
drying at 105 centigraded. The experiment was repeated three times and average results were
175
reported. Settling rate tests were conducted in a graduated cylinder with 500 mL sludge sample.
176
After 4 times inversion, the sludge suspension settled down without disturbance and the height of
177
the sludge−liquid was recorded.
178
3. Results
179
3.1 Characterization
180
3.1.1 FT-IR spectra
181
182
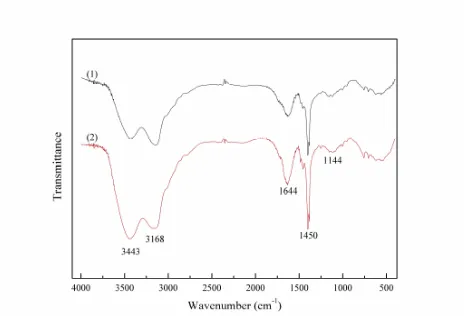
Figure 2 shows the FT-IR spectra of NP and SP. Obviously, the adsorption peaks of NP and SP
184
were almost the same, thus indicating that possible chemical bonds were the same. In other words,
185
this novel UV initiating system didn’t change chemical structures of copolymers. The adsorption
186
peaks at 3443 cm−1, 3168 cm−1 assigned to the stretching vibrations of –NH2 in the amide groups. The
187
adsorption peak at 1450 cm−1 represented for C=O in the amide groups. The adsorption peak at 1144
188
cm−1 corresponded to that of C-O in ester groups. The adsorption peak at 1450 cm−1 corresponded to
189
CH2- flexural vibrations in -CH2-N+. The adsorption peak at >3700 cm−1 stood for -OH stretching
190
vibrations, indicating the overlapping broad and twin peaks. These overlapped peaks can be
191
attributed to the small amount of bound water in the polymers as several chemical bonds were
192
hydrophilic. The FT-IR spectra indicated that AM and DAC were reacted[18].
193
3.1.2 1H-NMR spectra
194
195
Figure 3. 1HNMR spectra of (1) NP, (2) PAM, and (3) PDAC
196
Figure 3 shows the 1H NMR spectra of NP, PAM, and PDAC. Several similarities were
197
observed among NP, PAM, and PDAC, although the differences cannot be ignored. The
198
asymmetric peaks of NP at δ = 1.64 ppm and sharp peak at δ=2.21 ppm were due to the protons at
199
the backbone of methylene and methine groups-CH2-(a) and -CH-(b), respectively. However, the
200
protons in the structures of Figure 3(2) shifted to δ = 1.63 ppm and δ = 2.18 ppm, whereas the triplet
201
and asymmetric peaks of -CH2-(a) and -CH-(b) in Figure 3(3) shifted to δ = 1.89 ppm and δ = 2.54
202
ppm, respectively. The sharp peak at δ = 3.21 ppm in Figure 3(1) was assigned to the protons of -N+
-203
(CH3)3 (c) and was displayed at δ = 3.30 ppm in Figure 3(3). The peak of NP at approximately δ=3.74
204
ppm was assigned to the protons of -CH2-N+-(d), whereas it shifted to δ=3.89 ppm in PDAC. The
205
chemical shift of NP at approximately δ = 4.66 ppm was ascribed to the protons of -O-CH2-(e), and it
206
shifted to 4.79 ppm in PDAC. These minor chemical shift differences for the same group among NP,
207
PAM, and PDAC and the extra peaks indicated the successful preparation of NP using AM and
208
DAC. The sharp peaks of the three polymers at δ = 4.79 ppm were identified as the solvent D2O.
209
Two more peaks at δ = 3.50 ppm and δ = 4.05 ppm, which were assigned to -CH2-N+-(d) and
-O-210
CH2-(e) in the 1H NMR spectra of NP, respectively, were observed by comparing with PDAC
211
spectra. Previous studies proposed that these extra peaks were attributed to the stereochemistry of
212
the copolymers after copolymerization[21]. The chemical shifts in Figure 3(1) at approximately δ =
213
1.90 ppm(x)and δ = 2.59 ppm (y), which were not observed in 1H NMR spectra of copolymers
214
prepared by stable UV initiation system in our previous study[19], can be observed. The two peaks
215
were nearly identical with those at δ = 1.89 ppm and δ = 2.54 ppm in Figure 3(3). This result
216
indicated that a small fraction of PDAC homopolymer was mixed in NP. A probable explanation is
217
proposed as follows: Our previous research indicated that the reactivity ratios of AM and DAC in
218
solution polymerization are 2.27 and 0.38, respectively[19]. The conventional copolymerization
219
equation, which describes the instantaneous copolymer composition and composition of the
220
copolymer formed from a particular feed composition, was established by the reactivity ratios. This
221
the initial phase. In other words, the copolymers generated at such conditions featured low charge
223
density (CD). The prepared polymers with high CD or PDAC can be obtained with continuous
224
depletion of AM monomers. In our novel UV initiation system, DAC monomers can be sufficiently
225
copolymerized with the complexation of different initiators with different activation energies and
226
varying UV light intensities, that is, the radicals were distributed during copolymerization.
227
Therefore, the copolymers generated at the end of polymerization exhibited high CD, or PDAC can
228
be obtained. A small fraction of PDAC in NP copolymer caused the chemical shift at δ = 1.90 ppm
229
(x)and δ = 2.59 ppm (y) in Figure 3(1). These PDAC homopolymers significantly contributed to
230
sludge conditioning.
231
3.1.3 TG-DSC analysis
232
233
234
235
TG-DSC is commonly used to characterize the thermal stability of polymers by monitoring
237
weight changes as a function of temperature. Figure 4 shows the TG-DSC curves of NP, PAM, and
238
PDAC. The three main stages on copolymer thermal decomposition, which corresponded to weight
239
reduction, were observed. In the initial stage, weight losses of approximately 19.1% (w/w) in the
240
range of 20 °C–145 °C for NP, 5.3% in the range of 20 °C–250 °C for PAM, and 17.4% in the range of
241
20 °C–230 °C for PDAC occurred. The losses can be ascribed to the water molecules from air and
242
which were absorbed by the hydrophilic groups of copolymers in polymerization. The water
243
molecules vaporized at 100 °C, leading to a decrease in weight. During the second stage, weight
244
losses of approximately 34.5%, 18.4%, and 51.1% were observed within the ranges of 145 °C–325 °C,
245
250 °C–340 °C, and 230 °C–330 °C, respectively. These losses corresponded to imidization of the
246
amide group and thermal decomposition of methyl in the quaternary ammonium groups. All these
247
polymers exhibited favorable thermal stability[22]. The final stage of thermal decomposition
248
occurred above 325 °C, 340 °C, and 330 °C with weight losses of approximately 44.4%, 54.9%, and
249
26.6%, respectively. These weight losses were due to thermal decomposition of the polymer
250
backbone. As shown in Figure 4, the heat adsorption peak of NP at the final stage reached 361.8 °C,
251
which was between those of PAM and PDAC. Such result also indicated that AM and DAC had
252
been successfully copolymerized.
253
3.1.4 SEM
255
Figure 5. SEM images of (a) NP and (b) SP
256
Figure 5 illustrates the SEM images of NP and SP. Two different surface morphologies were
257
observed. NP presented a porous structure with a prodigious surface area (Figure 5(a)), whereas the
258
surface structure of SP was less porous (Figure 5(b)). In addition, Figure 5 also displays the linear
259
correlation of the natural logarithms of the perimeter (L) and the area (A), indicating that the fractal
260
dimension of the polymer surface could be calculated using Image-Pro Plus 6.0 software. Fractal
261
dimension refers to the slope of the fitted curve. The results showed that the fractal dimensions of
262
NP and SP were 1.375 and 1.317, respectively. The morphological structure of NP resulted in
263
several kinds of surface modification induced by the novel UV initiation system. The porous
264
structure favored water penetration in the polymeric network. Thus, product solubility can be
265
improved. Previous studies have indicated that such structure favors flocculation of colloidal
266
particles and formation of bridge aggregation among flocs. Compared with the smooth structure,
267
such porous structure proves better for adsorption-bridging behavior between the flocculants and
268
particles in sludge dewatering[5,23].
269
3.2.1 Effect of initiator concentration on copolymerization
271
272
Figure 6 Effects of redox initiator concentration on copolymerization
273
274
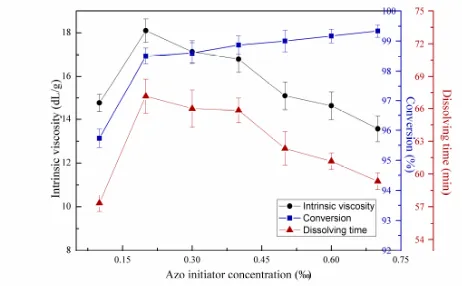
Figure 7 Effects of azo initiator concentration on copolymerization
275
Figure 6 illustrates the effects of redox initiator concentration on copolymerization using
first-276
stage light intensity of 7 mW/cm2, second-stage light intensity of 14.5 mW/cm2, mass ratio between
277
AM and DAC of 7:3, urea concentration of 2 wt‰, and azo initiator concentration of 0.3 wt‰.
278
Figure 7 shows the effects of azo initiator concentration on copolymerization under the same
279
reaction conditions in Figure 6, except that redox initiator concentration equaled 0.45 wt‰.
280
Copolymer intrinsic viscosity and dissolving time increased with increasing initiator concentration
281
after reaching maximum at redox initiator of 0.45 wt‰ and azo initiator concentration of 0.2 wt‰
282
but decreased with further increase in initiator concentration based on Figures 6 and 7. Conversion
283
continually increased in the entire initiator concentration range, featuring a notable decreasing
284
speed. Seabrook et al. proved that classical free-classical polymerization kinetics provides an
285
acceptable quantitative description for photo-initiated polymerization of AM in water[24]. This
286
phenomenon occurs due to the complex formation, cage effect, or primary radical termination with
287
macro-radicals. When the redox or azo initiator concentrations were insufficient, the cage effect
288
may lead to low polymer yields and low intrinsic viscosity due to the predominating termination of
289
growing chains inside the cage as few monomer units contributed to propagation. Considerable
290
primary radicals escaped from their “cages” to react with monomers, leading to the continuous
291
growth of molecular chain with increasing initiator concentrations. At this condition, conversion
292
also increased remarkably. However, chain termination and transfer will occur more easily with
293
increasing redox initiator concentration above 0.45 wt‰ and azo initiator concentration above 0.2
294
wt‰ as radical concentration in the polymerization system increased[25]. This trend accorded well
295
with the classical kinetic theory, which predicts that kinetic chain length depends on the square root
296
copolymers with the numerous produced radicals. The gel effect hampered the increase in
298
monomers without limitation[26].
299
3.2.2 Effects of mass ratio between AM and DAC on copolymerization
300
301
302
Figure 8 Effects of mass ratio between AM and DAC on copolymerization
303
Figure 8 shows the effects of mass ratio between AM and DAC on copolymerization. The
304
experiment was conducted with 0.45 wt‰ redox initiator concentration, 0.2 wt‰ azo initiator
305
concentration, 7 mW/cm2 first-stage light intensity, 14.5 mW/cm2 second-stage light intensity, and
306
urea concentration of 2 wt‰. CPAM features wide applications because it can neutralize the
307
surface charge of colloid particles to form large flocs. Charge density is directly related to charge
308
neutralization efficiency and flocculation performance. However, intrinsic viscosity, conversion,
309
and dissolving time all decreased with increasing DAC ratio, as shown in Figure 8. As mentioned
310
above, the reactivity ratio of AM was higher than that of DAC in solution polymerization[19]. DAC
311
monomers were less likely to polymerize with increasing molecular chains than AM monomers. In
312
addition, the large steric hindrance and cationic charge repulsion caused by the quaternary
313
ammonium groups in DAC caused difficulty in preparation of copolymers with ultrahigh intrinsic
314
viscosity and conversion [6]. However, the dissolving time of produced copolymers decreased with
315
increasing DAC mass ratio, facilitating their application in water treatment. The hydrophilic
316
quaternary ammonium groups in DAC and low intrinsic viscosity resulted in the above
317
phenomena. The intrinsic viscosity of 6:4 mass ratio was lower than that of 7:3 mass ratio, but better
318
charge neutralization performance and shorter dissolving time were expected. Thus, in this study,
319
the optimum mass ratio between AM and DAC was 6:4.
320
3.2.3 Effects of urea concentration on copolymerization
321
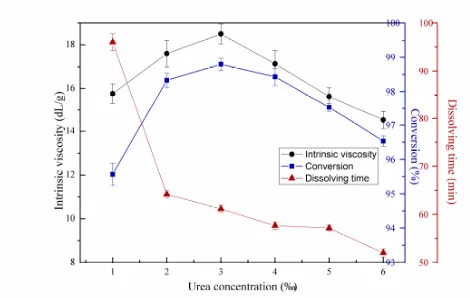
322
Figure 9 illustrates the effects of urea concentration, where the redox initiator, azo initiator,
324
first-stage light intensity, second-stage light intensity, and mass ratio between AM and DAC
325
reached 0.45 wt‰, 0.2 wt‰, 7 mW/cm2, 14.5 mW/cm2, and 6:4, respectively. As mentioned above,
326
short dissolving time will facilitate the actual CPAM application. However, significant differences
327
in size and velocity between the water and polymer inhibited water to seep in the polymer
328
molecular chain of the copolymer solution. Urea can weaken hydrogen bonding between the side
329
groups of CPAM molecular chain, resulting in the decreased intermolecular forces and chance of
330
crosslinking. Therefore, urea was used as solubilizer in polymerization to reduce the dissolving
331
time. Despite the decreased dissolving time with increased urea concentration, urea influenced
332
intrinsic viscosity. This condition was observed as urea acted as a reducing agent to increase the
333
kinetic chain length, and this effect can be observed when urea concentration measured below 3‰.
334
However, the negative effect of urea is that it can transfer growing chains to cause radical
335
termination, thus decreasing intrinsic viscosity and conversion. As shown in Figure 9, in the present
336
study, the optimum urea concentration reached 3 wt ‰.
337
3.2.4 Effects of light intensity on copolymerization
338
339
Figure 10 Effects of first-stage light intensity on copolymerization
340
341
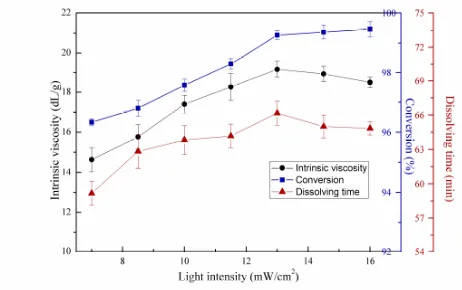
Figure 11 Effects of second-stage light intensity on copolymerization
342
Figure 10 shows the effects of first-stage light intensity on copolymerization. As shown in the
343
figure, second-stage light intensity, redox initiator concentration, V-50 concentration, mass ratio
344
between AM and DAC, and urea concentration totaled 14.5 mW/cm2, 0.45 wt‰, 0.2 wt‰, 6:4, and 2
345
wt‰, respectively. Figure 11 shows the effects of second-stage light intensity on copolymerization
346
under the same reaction conditions in Figure 10, except that the first-stage light intensity measured
347
8.5 mW/cm2. As shown in Figure 10, the intrinsic viscosity, conversion, and dissolving time of
348
copolymer all increased with increasing first-stage light intensity from 4 mW/cm2 to 8.5 mW/cm2.
349
dissolving time decreased, reached a bottom, and increased again with increasing first-stage light
351
intensity. These trends can also be illustrated by the radical copolymerization theory. Initiators can
352
be decomposed and used to generate primary free radicals by UV light. Free radical concentration
353
is positively correlated with UV light intensity[5]. Therefore, intrinsic viscosity and conversion
354
(Figure 10) presented a similar trend with those in Figures 6 and 7. The cage effect may lead to low
355
copolymer yields when light intensity is relatively low[23]. The increase in light intensity above 8.5
356
mW/cm2 will increase termination and chain transfer rate, leading to decreased intrinsic viscosity.
357
Accordingly, the first-stage light intensity reached 8.5 mW/cm2. Monomers can be adequately
358
copolymerized with increasing radical concentration. Therefore, conversion still increased when
359
light intensity was above 8.5 mW/cm2. In addition, the dissolving time showed different trends with
360
intrinsic viscosity when light intensity increased above 13 mW/cm2. The molecular chain may be
361
slightly cross-linked, thus increasing the dissolving time in Figure 10. These results indicate that
362
dissolving time mainly relies on intrinsic viscosity when cross-linking is small.
363
As shown in Figure 11, the curves showed similar trends with those in Figure 10. Intrinsic
364
viscosity and dissolving time increased and decreased with increasing second-stage light intensity,
365
and conversion followed a continuously increasing trend. The highest intrinsic viscosity was
366
observed at second-stage light intensity of 13 mW/cm2. However, differences were observed
367
between the two figures. First, in Figure 11, no vast decreasing range was observed in intrinsic
368
viscosity after reaching the maximum. Second, the dissolving time still correlated well with intrinsic
369
viscosity although light intensity was higher than 13 mW/cm2, indicating that the copolymer was
370
not cross-linked at such condition. Different polymerization stages caused the above differences.
371
The increasing second-stage light intensity below 13 mW/cm2 contributed to high conversion and
372
increase in intrinsic viscosity. However, after the first-stage UV illumination, a certain number of
373
monomers were reacted, and a gel product can be produced. The radical concentration at the
374
middle or last phase will not reach as high as that in the initial phase with the same light intensity
375
given that radical concentration is influenced by monomer concentration. As mentioned above,
376
chain termination and transfer rate were directly affected by radical concentration. Therefore,
377
intrinsic viscosity was less influenced by increasing light intensity above 13 mW/cm2,and molecular
378
chain cross-linking was also less likely to occur.
379
3.2.5 Mechanism and advantages of the novel UV initiation system
380
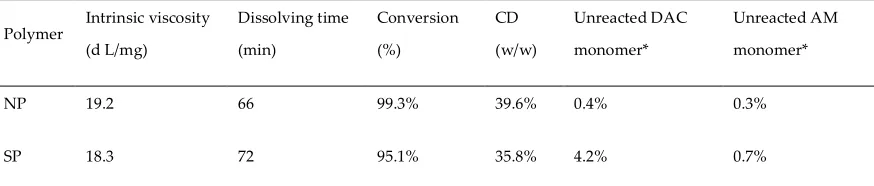
Table 2 NP and SP characteristics at optimum condition
381
Polymer Intrinsic viscosity (d L/mg) Dissolving time (min) Conversion (%) CD (w/w) Unreacted DAC monomer* Unreacted AM monomer*NP 19.2 66 99.3% 39.6% 0.4% 0.3%
SP 18.3 72 95.1% 35.8% 4.2% 0.7%
*The unreacted DAC percentage is obtained by 40% (total DAC monomer percentage) minus CD.
382
The unreacted AM percentage is obtained by 100% minus conversion and unreacted DAC
383
percentage.
384
As shown in Table 2, the intrinsic viscosity of NP was higher than that of SP, whereas the
385
dissolving time of NP was lower than that of SP. These findings indicated that NP flocculated more
386
efficiently and was more applicable than SP. The differences between the initiation systems resulted
387
in the above experimental results. First, radical concentration was differently distributed during
388
polymerization. Chain termination and transfer rate, which were directly affected by radical
389
concentration, resulted in a decisive effect on copolymer intrinsic viscosity. In the novel UV
390
initiation system, most redox initiators with low activation energy reacted to produce radicals at the
391
first low-light-intensity stage of copolymerization, and most azo initiators with high activation
392
energy decomposed in the second light stage. Radicals were generated and controlled at relatively
393
low levels during the entire copolymerization. On the contrary, radicals cannot be generated nor
394
initiation system. Chain termination and transfer rate of our novel UV initiation system were lower
396
than those of SP. Second, radicals were insufficient to polymerize all the monomers for the stable
397
light intensity system as the initiators were exhausted at the end of polymerization. Notably, the
398
initiator concentration should be low because cross-linking will occur due to high concentration of
399
radicals. By contrast, radicals can still be generated with increasing light intensity, which can lead to
400
decomposition of azo initiators. Therefore, the monomers were sufficiently polymerized in this
401
novel UV initiation system, as shown in the conversion rates in Table 2. Table 2 also shows that the
402
CD of NP was significantly higher than that of SP. As mentioned above, the reactivity ratio of DAC
403
is lower than that of AM[19]. In other words, the polymerization activity of DAC was insufficient
404
for complete reaction in a single initiator and stable light intensity system. As shown in Table 2, the
405
unreacted percentage of DAC monomer reached 4.2% for SP, whereas that of NP totaled 0.4%. This
406
finding indicated that the novel UV initiation system is efficient and cost-effective. In addition, the
407
extra 3.8% was converted to PDAC considering the 1H NMR spectra of NP in Figure 3. This PDAC
408
will significantly facilitate sludge conditioning. Third, the increasing light intensity of the novel UV
409
initiation system can mitigate the gel effect in inhibiting radical generation. Monomers are
410
transferred into copolymers, and a gel product can be produced with copolymerization. Light
411
intensity decreased along the radiation path due to light absorption of initiator and scattering effect
412
in reaction medium. This variance will lead to the spatially inhomogeneous distribution of free
413
radicals in the system. Thus, conversion rate and intrinsic viscosity of various layers in the reaction
414
vessel differed in the stable UV light intensity system. However, in this study, a closely
415
homogeneous distribution of free radicals can be achieved by increasing the utilized UV light
416
intensity. Consequently, monomers in different radiation paths can be copolymerized thoroughly,
417
and average conversion rate and intrinsic viscosity increased.
418
For the low dissolving time of NP, the low possibility of copolymer chain cross-linking may
419
explain why this experimental result was obtained although the intrinsic viscosity of NP was high.
420
As mentioned above, radicals were generated and controlled during polymerization through
421
different initiators and light intensities used in our novel UV system. Therefore, radical
422
concentration was controlled at low level during copolymerization, and cross-linking was avoided.
423
In addition, a porous morphology favored water penetration in the polymeric network structure
424
based on Figure 5. Therefore, NP was dissolved better than SP.
425
The implications of our novel UV initiation system bear significance. One of the major obstacles
426
in applying UV initiation technology in preparing organic flocculants is the light-hindering effect of
427
gel product. The heterogeneous distribution of free radicals along the radiation path may pose a
428
negative effect on polymerization. Such effect is unremarkable in laboratory-scale as the radiation
429
path is often short. However, the hindering effect cannot be ignored in large industrial scale. The
430
novel UV initiation system makes it theoretically possible by increasing light intensity and
431
complexing of initiators with different activation energies.
432
3.3 Sludge conditioning performance and mechanism
433
3.3.1 Effects of flocculant dosage on sludge conditioning performance
434
436
437
Figure 12. Effects of NP and SP dosages on residual turbidity (RT) and zeta potential (a), FCMC
438
and SRF (b)
439
The conditioning efficiency of flocculants is influenced by a number of external factors, such as
440
flocculant dosage. Turbidity is widely used to explain the performance of a polymer sample in
441
various flocculation fields because it indicates the content of suspended particles in the liquid
442
phase. FCMC is an important aspect to be considered in compressible sludge dewatering. High
443
FCMC is not desirable because it results in large sludge volumes that increase the following
444
treatment costs. SRF is widely used to evaluate sludge filtration performance, and small SRF reflects
445
a good performance in sludge dewatering. Zeta potential plays an important role in analyzing the
446
charge interactions between the polyelectrolyte and oppositely charged particles[20]. Figure 12
447
shows the effect of NP and SP dosages on RT, zeta potential, FCMC, and SRF. Clear solid–liquid
448
separation was achieved when the dosage was higher than 40 mg/L for NP and SP, as shown in
449
Figure 12 (a). This result corresponded well with that of FCMC and SRF, as shown in Figure 12 (b).
450
Such experimental results indicated that the optimum dosage was 40 mg/L for the two
451
polyelectrolytes. NP constantly showed lower ratios of RT, FCMC, and SRF than SP. A good sludge
452
conditioning performance of NP was obtained, and this condition was closely related to CD,
453
intrinsic viscosity, and morphological porous structure.
454
The indices RT, FCMC, and SRF for the two flocculants rapidly decreased with increasing
455
flocculant dosage, gradually reached the minimum, and slowly increased with increasing flocculant
456
dosage, respectively. These trends were consistent with the typical behavior of polyelectrolytes in
457
the flocculation process reported in previous studies. The trends in the three indices corresponded
458
with the changes in zeta potential of the supernatant in Figure 12 (a). The negative charge on the
459
sludge surface was gradually neutralized, and colloid particles in the sludge destabilized and
460
aggregated with the addition of positively charged flocculants. Correspondingly, the RT, FCMC,
461
were provided. Negatively charged sites of sludge particles were sufficiently neutralized, and good
463
conditioning performance may be achieved. This finding was ascertained by the high zeta potential
464
of NP in Figure 12 (a) and initially explains the good conditioning performance. Charge
465
neutralization was the main mechanism when the most favorable flocculation performance
466
occurred at various flocculant dosages, where zeta potential was zero or close to zero. The repulsive
467
forces between suspended charged particles nearly diminished, and efficient flocculation occurred,
468
leading to effective sludge conditioning. However, in this study, zeta potential was lower than zero
469
at a dosage of 40 mg/L, that is, the optimum dosage. This finding proves bridging, which is
470
relatively common for high intrinsic viscosity polyelectrolytes. The porous morphological structure
471
of NP with a prodigious surface area can crucially enhance the adsorption of polymers on particle
472
surfaces and bridging of particles by polymer chain. In addition, the intrinsic viscosity significantly
473
affects sludge conditioning. At high intrinsic viscosity, the flocculant presented an expanded chain
474
conformation, and molecular chain stretching in the solution was sufficiently long to capture and
475
bridge the colloidal particles [27,28]. An increase in intrinsic viscosity led to molecular chain
476
growth, increased the chance of collision among the colloidal particles, and favored trapping and
477
bridging of particles[29,30]. Therefore, the sludge conditioned by NP was flocculated. Excess
478
flocculants can cause an electrostatic repulsion or a steric effect between the sludge particles,
479
leading to restabilization of sludge particles, a condition that is not conducive to sludge dewatering,
480
as shown in Figure 12.
481
3.3.2 Sludge floc properties and flocculation mechanism
482
483
485
486
Figure 14 Floc size distribution for (a) NP and (b) SP
487
To examine the effects of the novel UV initiation system on flocculant sludge conditioning
488
mechanism, floc characteristics, such as settling behavior and floc size distribution with NP and SP,
489
were comparatively investigated. Figure 13 plots the settling rate of sludge, which is expressed in
490
terms of height of sludge−water interface as a function of time, with the dosage of various
491
flocculants controlled at 40 mg/L. In this study, the rate of sludge–water interfacial height variation
492
over 5 min was assumed to be the sludge sedimentation rate. Settling rates reached 4.0 and 3.7
493
cm/min for the sludge conditioned with NP and SP, respectively. A better settling capability of NP
494
can be observed. At the end of settling, similar heights of 14.4 and 14.7 cm were achieved for NP
495
and SP, respectively. These findings indicate the similar floc sizes of sludge particles conditioned by
496
NP and SP. Nearly the same average floc size of the two polyelectrolytes can be estimated in Figure
497
14. The different settling behavior may be attributed to floc density and floc size distribution. As
498
shown in Figure 14, d10 and d25 of NP were higher than those of SP, indicating that less small floc
499
particles existed in NP-conditioned sludge. Few small particles favored sludge dewatering because
500
the cloth filter was less likely to be clogged[31]. This condition may imply the low SRF of NP, as
501
shown in Figure 12. However, d75 and d90 of NP were smaller than those of SP. Bridging played a
502
prominent role in sludge conditioning for SP as bridging mechanism is constantly characterized
503
with large floc size[32]. However, such large floc size can be disadvantageous for sludge
504
dewatering. Previous studies examined that large and loose flocs with high content of intrafloc
505
water (water from within the floc, comprising loops and tails)[33], which is not easily removed
506
during filtration, were formed. This phenomenon corresponded well with the high FCMC of SP, as
507
509
Figure 15. Sludge flocculation mechanism scheme of NP
510
The different initiation systems included the origin of different sludge conditioning
511
performances and mechanisms. Figure 15 shows sludge flocculation scheme of NP. As it was
512
shown in Figure 3, several fractions of PDAC existed in NP. After the addition of NP, the sludge
513
particles were neutralized and destabilized with the existence of PDAC and copolymers and. At
514
such condition, the main flocculation mechanism was charge neutralization given that the strength
515
between charged sites is frequently higher than Van der Waals force or hydrogen
516
bond[7_ENREF_7]. Flocs are assumed to form through charge neutralization and are characterized
517
with compactness and low intrafloc water. However, numerous negative sites were still found on
518
sludge particles as the zeta potential was lower than 0 mV at a dosage of 40 mg/L, as shown in
519
Figure 12 (a). Bridging became the main flocculation mechanism to form large and dense sludge
520
flocs through Van der Waals force, hydrogen bond, or electrical force. This condition may explain
521
the floc size distribution and sludge conditioning performance of NP. On the contrary, in the single
522
initiator and stable light intensity system, DAC monomers were not sufficiently reacted, the first
523
step of charge neutralization cannot function well, and bridging serves as the main mechanism
524
during flocculation. We observed that flocs mainly formed through bridging were loose and
525
featured a wide range of floc size distribution and high percent of intrafloc water. Therefore, the
526
sludge conditioning performance of SP was poorer than that of NP.
527
5. Conclusions
528
In this study, a novel UV-initiated system characterized with adjustable light intensity and
529
redox-azo complex initiator to maintain a certain concentration of free radicals was used to
530
synthesize NP. The parameters affecting intrinsic viscosity, conversion, and dissolving time of NP
531
were studied. The structure, morphology, and thermal stability were investigated using FT-IR, 1H
532
NMR, TG-DSC, and SEM. Finally, sludge conditioning performance and mechanism of NP were
533
investigated. On the basis of experimental results, the following conclusions were obtained:
534
(1) Characterization results indicated that NP was successfully prepared with AM and DAC by
FT-535
IR and 1H NMR spectra. 1H NMR spectra indicated that a small fraction of PDAC was mixed in
536
NP. An accepted thermal stability was examined by TG-DSC. Surface morphology of NP
537
characterized by SEM showed that a porous structure was observed, and an acceptable
538
dissolvability and a stronger adsorption-bridging behavior were noted between sludge
539
particles and polymer molecules.
540
(2) NP exhibited the best complex performance at intrinsic viscosity, conversion rate, and
541
dissolving time at 0.45 wt‰ redox initiator concentration, 0.2 wt‰ azo initiator concentration,
542
40.0 wt% CD, first- and second-stage light intensities of 8.5 and 13 mW/cm2, respectively, and 3
543
wt% urea,. The advantages of the novel UV initiation system over stable light intensity and
544
single initiator were analyzed. Radical concentrations were maintained as redox initiators
545
decomposed at low activation energy, and azo initiators were generated at high activation
546
(3) The sludge conditioning experiment showed that NP performed better in terms of RT, FCMC,
548
and SRF than SP. A flocculation mechanism was proposed by investigating the sedimentation
549
behavior and floc size distribution. High intrinsic viscosity, porous morphology structure, and
550
mixed cationic homopolymer of NP contributed to good sludge conditioning performances.
551
552
Author Contributions: Qingqing Guan, Guocheng Zhu and Yi Liao conceived and designed the experiments;
553
Jin Xu, Xiaoxu Sun and Fang Tian performed the experiments; Minghan Luo and Jiaxing Xu analyzed the data;
554
every author contributed to writing the paper.
555
Funding: The authors are grateful for the financial support provided by the Natural Science Foundation of
556
Jiangsu (Project BK20160779), Natural Science Research of Jiangsu Universities (Project 16KJB610008),
557
Academic Research Foundation of Nanjing Institute of Technology ( Project YKJ201527), the Department of
558
Science and Technology of Sichuan Province (Project No. 2017JY0129) and the Education Committee of
559
Sichuan Province (Project No.17ZB0312).
560
Conflicts of Interest: The authors declare no conflict of interest.
561
562
References
563
1. Nguyen, T.P.; Hilal, N.; Hankins, N.P.; Novak, J.T. Characterization of synthetic and activated sludge and
564
conditioning with cationic polyelectrolytes. Desalination 2008, 227, 103-110.
565
2. Ma, M.; Zhu, S. Grafting polyelectrolytes onto polyacrylamide for flocculation 2. Model suspension
566
flocculation and sludge dewatering. Colloid Polym. Sci. 1999, 277, 123-129.
567
3. Wolski, P.; Zawieja, I. Hybrid conditioning before anaerobic digestion for the improvement of sewage
568
sludge dewatering. Desalin. Water Treat. 2014, 52, 3725-3731.
569
4. Zhu, J.; Zheng, H.; Jiang, Z.; Zhang, Z.; Liu, L.; Sun, Y.; Tshukudu, T. Synthesis and characterization of a
570
dewatering reagent: Cationic polyacrylamide (p(am-dmc-dac)) for activated sludge dewatering treatment.
571
Desalination and Water Treatment 2013, 51, 2791-2801.
572
5. Zheng, H.; Sun, Y.; Zhu, C.; Guo, J.; Zhao, C.; Liao, Y.; Guan, Q. Uv-initiated polymerization of
573
hydrophobically associating cationic flocculants: Synthesis, characterization, and dewatering properties.
574
Chemical Engineering Journal 2013, 234, 318-326.
575
6. Zheng, H.; Liao, Y.; Zheng, M.; Zhu, C.; Ji, F.; Ma, J.; Fan, W. Photoinitiated polymerization of cationic
576
acrylamide in aqueous solution: Synthesis, characterization, and sludge dewatering performance. The Scientific
577
World Journal 2014, 2014, 1-11.
578
7. Bolto, B.; Gregory, J. Organic polyelectrolytes in water treatment. Water Research 2007, 41, 2301-2324.
579
8. Zheng, H.; Sun, Y.; Guo, J.; Li, F.; Fan, W.; Liao, Y.; Guan, Q. Characterization and evaluation of dewatering
580
properties of padb, a highly efficient cationic flocculant. Industrial & Engineering Chemistry Research 2014, 53,
581
2572-2582.
582
9. Zhou, J.; Liu, F.; Pan, C. Effects of cationic polyacrylamide characteristics on sewage sludge dewatering
583
and moisture evaporation. PLoS ONE 2014, 9, e98159.
584
10. Guan, Q.; Zheng, H.; Zhai, J.; Liu, B.; Sun, Y.; Wang, Y.; Xu, Z.; Zhao, C. Preparation, characterization, and
585
flocculation performance of p(acrylamide-co-diallyldimethylammonium chloride) by uv-initiated template
586
polymerization. Journal of Applied Polymer Science 2015, 132, 10.1002/app.41747.
587
11. Shang, H.; Zheng, Y.; Liu, J. Synthesis in inverse emulsion and decolorization properties of hydrophobically
588
modified cationic polyelectrolyte. Journal of Applied Polymer Science 2011, 119, 1602-1609.
589
12. Ma, J.; Zheng, H.; Tan, M.; Liu, L.; Chen, W.; Guan, Q.; Zheng, X. Synthesis, characterization, and
590
flocculation performance of anionic polyacrylamide p (am-aa-amps). Journal of Applied Polymer Science 2013,
591
129, 1984-1991.
592
13. Agarwal, V.; McLean, D.; Horne, J.; Richardson, D.; Stack, K. Chemometric study of graft copolymerization
593
of guar-g-(acrylamide-co-diallyl dimethylammonium chloride). Journal of Applied Polymer Science 2013, 127,
594
3970-3979.
595
14. Zhao, S.-M.; Liu, K.-Y. Synthesis of copolymer of dmdaac and am. Beijing Huagong Daxue Xuebao (Ziran
596
Kexueban)/Journal of Beijing University of Chemical Technology (Natural Science Edition) 2005, 32, 29-32.
597
15. Bamford, C.H. 9 - redox initiators a2 - allen, geoffrey. In Comprehensive polymer science and supplements,
598
Bevington, J.C., Ed. Pergamon: Amsterdam, 1989; pp 123-139.
599
16. Pabin-Szafko, B.; Wisniewska, E.; Hefczyc, B.; Zawadiak, J. New azo-peroxidic initiators in the radical
600
17. Sun, Y.; Zhu, C.; Xu, Y.; Zheng, H.; Xiao, X.; Zhu, G.; Ren, M. Comparison of initiation methods in the
602
structure of cpam and sludge flocs properties. Journal of Applied Polymer Science 2016, 133, n/a-n/a.
603
18. Guan, Q.; Zheng, H.; Zhai, J.; Zhao, C.; Zheng, X.; Tang, X.; Chen, W.; Sun, Y. Effect of template on structure
604
and properties of cationic polyacrylamide: Characterization and mechanism. Industrial & Engineering Chemistry
605
Research 2014, 53, 5624-5635.
606
19. Guan, Q.; Zheng, H.; Xu, J.; Tian, F.; Sun, X. Effect of charge density on structural characteristics of cationic
607
polyacrylamide: Models based on reactivity ratio and characterization. Journal Of Polymer Materials 2016, 33,
608
365-377.
609
20. Guan, Q.; Tang, M.; Zheng, H.; Teng, H.; Tang, X.; Liao, Y. Investigation of sludge conditioning
610
performance and mechanism by examining the effect of charge density on cationic polyacrylamide
611
microstructure. Desalination and Water Treatment 2016, 57, 12988-12997.
612
21. Abdollahi, Z.; Frounchi, M.; Dadbin, S. Synthesis, characterization and comparison of pam, cationic pdmc
613
and p(am-co-dmc) based on solution polymerization. Journal of Industrial and Engineering Chemistry 2011, 17,
614
580-586.
615
22. Feng, L.; Zheng, H.; Gao, B.; Zhao, C.; Zhang, S.; Chen, N. Enhancement of textile-dyeing sludge
616
dewaterability using a novel cationic polyacrylamide: Role of cationic block structures. Rsc Advances 2017, 7,
617
11626-11635.
618
23. Ma, J.; Shi, J.; Ding, H.; Zhu, G.; Fu, K.; Fu, X. Synthesis of cationic polyacrylamide by low-pressure uv
619
initiation for turbidity water flocculation. Chemical Engineering Journal 2017, 312, 20-29.
620
24. Seabrook, S.A.; Gilbert, R.G. Photo-initiated polymerization of acrylamide in water. Polymer 2007, 48,
4733-621
4741.
622
25. Yuan, Z.; Hu, H. Preparation and characterization of crosslinked glyoxalated polyacrylamide
paper-623
strengthening agent. Journal of Applied Polymer Science 2012, 126, E458-E468.
624
26. Liu, L.Y.; Yang, W.T. Inverse emulsion polymerization of acrylamide initiated by uv radiation. Acta
625
Polymerica Sinica 2004, 545-550.
626
27. Yoon, D.H.; Jang, J.W.; Cheong, I.W. Synthesis of cationic polyacrylamide/silica nanocomposites from
627
inverse emulsion polymerization and their flocculation property for papermaking. Colloids and Surfaces A:
628
Physicochemical and Engineering Aspects 2012, 411, 18-23.
629
28. Yang, Z.; Liu, X.; Gao, B.; Zhao, S.; Wang, Y.; Yue, Q.; Li, Q. Flocculation kinetics and floc characteristics of
630
dye wastewater by polyferric chloride–poly-epichlorohydrin–dimethylamine composite flocculant. Separation
631
and Purification Technology 2013, 118, 583-590.
632
29. Saveyn, H.; Meersseman, S.; Thas, O.; Van der Meeren, P. Influence of polyelectrolyte characteristics on
633
pressure-driven activated sludge dewatering. Colloids and Surfaces A: Physicochemical and Engineering Aspects
634
2005, 262, 40-51.
635
30. Chen, Q.; Wang, Y. Influence of single- and dual-flocculant conditioning on the geometric morphology and
636
internal structure of activated sludge. Powder Technology 2015, 270, Part A, 1-9.
637
31. Feng, L.; Liu, S.; Zheng, H.; Liang, J.; Sun, Y.; Zhang, S.; Chen, X. Using ultrasonic (us)-initiated template
638
copolymerization for preparation of an enhanced cationic polyacrylamide (cpam) and its application in sludge
639
dewatering. Ultrasonics Sonochemistry 2018, 44, 53-63.
640
32. Zhao, C.; Zheng, H.; Feng, L.; Wang, Y.; Liu, Y.; Liu, B.; Djibrine, B.Z. Improvement of sludge dewaterability
641
by ultrasound-initiated cationic polyacrylamide with microblock structure: The role of surface-active
642
monomers. mater. 2017, 10.
643
33. Xiao, J.; Wu, X.; Yu, W.; Liang, S.; Yu, J.; Gu, Y.; Deng, H.; Hu, J.; Xiao, K.; Yang, J. Migration and distribution
644
of sodium ions and organic matters during electro-dewatering of waste activated sludge at different dosages
645
of sodium sulfate. Chemosphere 2017, 189, 67-75.