Nuclear parton distributions
S. A.Kulagin1,
1Institute for Nuclear Research of the Russian Academy of Sciences, Moscow 117312, Russia
Abstract.We review a microscopic model of the nuclear parton distribution functions, which accounts for a number of nuclear effects including Fermi motion and nuclear bind-ing, nuclear meson-exchange currents, off-shell corrections to bound nucleon distribu-tions and nuclear shadowing. We also discuss applicadistribu-tions of this model to a number of processes including lepton-nucleus deep inelastic scattering, proton-nucleus Drell-Yan lepton pair production at Fermilab, as well asW±andZ0boson production in proton-lead collisions at the LHC.
1 Introduction
The QCD factorization theorem [1] suggests that the parton distribution functions (PDFs) are universal process-independent characteristics of the target at high invariant momentum transferQ. PDFs deter-mine the leading contributions to the cross sections of various hard processes involving leptons and hadrons. PDFs cannot be reliably calculated in modern QCD, as they are driven by non-perturbative strong interactions, and QCD-based phenomenology remains to be the primary source of information on PDFs.
The deep-inelastic scattering (DIS) experiments with nuclear targets show significant nuclear ef-fects with a rate that is more than one order of magnitude larger than the ratio of the nuclear binding energy to the nucleon mass (for a review see [2, 3]). These observations rule out the naive picture of the nucleus as a system of quasi-free nucleons and indicate that the nuclear environment plays an im-portant role even at energies and momenta much higher than those involved in typical nuclear ground state processes.
The studies of the mechanisms responsible for observed effects provide a link between particle and nuclear physics and help to better understand both the intrinsic properties of the proton as well as the properties of hadrons in nuclear environment. A typical example in this context is the extraction of thed-quark PDF from the global fits involving the proton and the deuteron data. This procedure re-quires, in turn, a detailed knowledge of nuclear effects in order to control the corresponding systematic uncertainties.
A number of studies are available [4–6], in which the nuclear parton distributions (NPDFs) are extracted from global fits to nuclear high-energy data using the empirical parameterizations of nuclear correction factors for each PDF. Typically these studies involve a large number of free parameters and can be biased by the chosen parameterizations of the Bjorkenxas well as the nuclear mass numberA
dependencies of nuclear correction factors. In this paper we follow a different approach and address
the NPDFs using the microscopic model developed in [7]. The model incorporates a number of nu-clear corrections including the smearing with the energy-momentum distribution of bound nucleons (Fermi motion and binding), the off-shell correction to bound nucleon structure functions, corrections from nuclear meson exchange currents (MEC) and the propagation of the hadronic component of the virtual intermediate boson in the nuclear environment. In [8] this approach was applied to compute individual NPDFs. In Sec.2 we briefly review the approach in context of nuclear DIS. The applica-tions to the nuclear Drell-Yan (DY) reaction in the context of the measurement of nuclear antiquark distributions in Fermilab E772 experiment is discussed in Sec.3. In Sec.4 we review recent studies of
WandZboson production in p+Pb collisions at LHC.
2 Nuclear DIS and PDFs
In a reference frame in which the hadron has a high (infinite) momentum, a PDF is the momentum distribution of the corresponding parton in a hadron in the units of hadron’s momentum. However, the interpretation of PDFs is somewhat more complicated in the nucleus rest frame. We recall that in the target rest frame the characteristic DIS time (or longitudinal distance) can be estimated asL∼(Mx)−1, whereMis the nucleon mass andxthe Bjorken scaling variable [9]. UsingLwe identify two different kinematical regions for nuclear effects. In the regionL<d, wheredis the average distance between bound nucleons in a nucleus, i.e. for large values of x > 0.1, the nuclear DIS cross sections can be approximated by incoherent scattering from bound protons and neutrons. The dominant nuclear corrections in this region are due to energy-momentum distribution of bound nucleons (nuclear Fermi motion and binding [10–13]) and also off-shell correction to bound nucleon structure functions [14]. In the region of smallx < 0.1 one has to account for a scattering corrections from nuclear meson fields [15, 16]. Also in the regionLd(orx0.1) the propagation effects of virtual quark-gluon states in the nuclear environment results in essential corrections to the impulse approximation. For the leading contributions to the DIS structure functions the interference of multiple scattering terms results in a negative correction (nuclear shadowing, for a review see, e.g., [17]).
We use the notationqa/h(x,Q2) for the distribution of (anti)quarks of the typea = u,u¯,d,d¯, . . . in a hadronh. Following [7, 8] we write the nuclear PDFqa/Aas (for brevity, we suppress explicit dependencies onxandQ2)
qa/A=qIAa/A+qcoha/A+qMECa/A , (1)
where the first term on the right side is the contribution from bound protons and neutrons in the impulse approximation, and the other terms are the corrections to the impulse approximation due to coherent nuclear interactions of the hadronic component of the virtual photon and to nuclear meson exchange currents, respectively. These contributions are reviewed below.
2.1 Impulse approximation
In the impulse approximation the nuclear PDFs can be written as a convolution of the proton (neutron) distribution of a nucleus with the corresponding parton distribution of a bound proton (neutron) [7, 14]:
qIAa/A =
τ=p,n
fτ/A⊗qa/τ=
τ=p,n
x<y dydp2
y fτ/A(y,p2)qa/τ(x/y,Q2,p2). (2)
virtuality [14]. The proton (neutron) distribution function in a nucleus is given in terms of the nuclear spectral functionP(for brevity, we drop subscripts identifying the proton and the neutron distribu-tions)
f(y,p2)=
[dk]
1+kz
M
P(k, ε)δ
y−k0+kz
M
δp2−k2, (3)
where the integration runs over the nucleon four-momentumk=(M+ε,k) and [dk]=dk0dk/(2π)4 andk2=k2
0−k2is the invariant mass of the off-shell nucleon. The coordinate system is such that the momentum transfer is antiparallel to thezaxis. The Bjorken variable of the nucleus isx=Q2/2Mq
0 withq0the energy transfer in the target rest frame.
We refer (2) as a generalized impulse approximation because it accounts for the dependence of the nucleon PDF on the nucleon invariant massp2, which is usually not addressed in various versions of impulse approximation. A similar nuclear convolution equation but without off-shell effect was earlier discussed in [12, 13, 18]. Note that (2) and (3) were obtained starting from a Lorentz-covariant approach and using a systematic expansion of matrix elements in series of the small parametersp/M
andε/M, keeping terms of the orderp2/M2andε/M[7, 14, 18]. To this order a generalized nucleon distribution function (3) is given in terms of nonrelativistic spectral function
P(k, ε)=
dt eiεtψ†(k,t)ψ(k,0), (4)
whereψ(k,t) is the nonrelativistic nucleon operator in the momentum-time representation (for more details see [7]). The spectral function describes the energy-momentum distribution of bound nucle-ons. Note thatεin (4) includes the recoil kinetic energy of the residual system ofA−1 nucleons, as it can be seen after inserting a complete set of states and integrating over the time.1
The proton (neutron) spectral function is normalized to the protonZ (neutronN) number, and using (3) we explicitly verify that the proton (neutron) distribution function is normalized as
dydp2fp(n)/A(y,p2)=Z(N), (5)
where the integral is taken over all possible light-cone momentayand the nucleon virtualityp2. Note that the termkz/Min (3) gives vanishing contribution to the normalization (5) due to symmetry rea-son. The distribution function (3) is independent ofQ2in the Bjorken limit and theQ2evolution of the NPDFs in the impulse approximation is governed by the evolution of the PDFs of the corresponding nuclear constituents. For the discussion of power corrections to the nuclear convolution (2) we refer to [7, 19, 20] (see also [21] for spin-dependent DIS).
The first moment of the nucleon distribution iny gives the fraction of the nuclear light-cone momentum carried by bound nucleons. The first moment inp2gives average nucleon virtuality. It will be convenient to discuss dimensionless virtualityv=(p2−M2)/M2. We have
yN=
1
A
dydp2yf(y,p2)=1+ε+ 2 3T
M , (6)
vN=
1
A
dydp2vf(y,p2)=2ε − T
M , (7)
1Note that for the deuteron the spectral function is given in terms of the deuteron wave function asP
where we sum over protons and neutrons andεandT = k2/2M are the nucleon energy and kinetic energy integrated with the nuclear spectral function (4) per one nucleon. Note thatε − T=
V is the average nuclear potential energy per one nucleon. For the deuteron we can evaluate the moments in (6) and (7) using the deuteron wave function. For the Paris wave function we have
yN =0.994 andvN = −0.044. For208Pb, using the nuclear spectral function from [7], we have
yN = 0.963 and vN = −0.197. Note that yN < 1 and vN < 0 because of nuclear binding. Also the inequalityyN < 1 indicates that the bound nucleons carry only a part of the full nuclear light-cone momentum. In this approach the missing nuclear light-cone momentum is carried by the nuclear meson degrees of freedom which are responsible for nuclear binding, as discussed in Sec.2.2.
In terms of the variabley, the distribution functionf(y,p2) is peaked abouty=y
Nwith a width
∼pF/MwithpFthe nuclear Fermi momentum. In terms of dimensionless virtualityv, the distribution
f(y,p2) is located in a narrow region aboutv=v.
Note that (2) predicts a finite nuclear PDF in the regionx>1, because of high momentapz>pF. The rate of NPDF in this region is driven by the high-momentum part of the nuclear momentum distribution.2 In applications we use a model spectral function, which includes both a mean field contribution dominant at low energy and momentum, and a high-momentum and high-energy com-ponent related to short range nucleon-nucleon correlations (SRC) [7]. In order to address the effect of nonisoscalarity (nuclear neutron excess) we use the isoscalarP0 = Pp +Pn and the isovector
P1 =Pp− Pncombinations of the nuclear spectral function. We assume the SRC contribution to be similar for the proton and the neutron nuclear distribution such that the SRC term only contributes to the isoscalar spectral functionP0 and that it cancels out in the isovector combinationP1. This behavior is supported by the observation of the dominance of pnSRC pairs in nucleon knock-out experiments [25]. The isovector spectral functionP1is therefore calculated as the difference between the mean-field contributions to the proton and the neutron spectral functions and is proportional to the proton-neutron asymmetryβ=(Z−N)/A[7].
In off-mass-shell region the PDFs explicitly depend on the nucleon virtuality as indicated in (2). In order to address this effect we note that on average the nucleon virtualityvis small. We then expand the off-shell PDFq(x,Q2,p2) in (2) about the on-shell valuep2=M2in series inv[14]. Keeping the leading terms we have [7, 8]:
q(x,Q2,p2)≈q(x,Q2)(1+δf(x,Q2)v), (8)
δf(x,Q2)=∂lnq(x,Q2,p2)/∂lnp2, (9) where the derivative is evaluated at p2 = M2 andq(x,Q2) is the PDF of the on-shell nucleon. The functionδf describes the relative off-shell modification of the nucleon PDF. This special nucleon structure function does not contribute to the cross section of the physical nucleon, but it is relevant only for the bound nucleon and describes its response to the interaction in a nucleus. The function
δf was studied phenomenologically3in an analysis of data on the nuclear DIS [7] (see Sec.2.4). This analysis suggests a common off-shell function for the quark and antiquark distributions, independent ofQ2 and the parton type. This observation is supported by a recent QCD global analysis of proton and deuteron data [36], as well as by the studies of the nuclear DY production of muon pair in Sec.3 and theW/Zboson production in p+Pb collisions in Sec.4.
2.2 Nuclear MEC correction
As it was noted in Sec.2.1 the nuclear binding effect causesyN <1. Apparently the missing nuclear light-cone momentum should be carried by the fields responsible for nuclear binding [15]. The
cor-2Allowed region of nuclear Bjorken variable is 0<x<M
rection from the nuclear virtual meson cloud was discussed in the context of the nuclear EMC effect in a number of papers [15, 16, 26–30]. These studies indicate an enhancement of the nuclear structure functions in the region 0.05<x<0.15 due to nuclear meson cloud. However, the results of specific calculation are somewhat uncertain due to sensitivity to the details of the pion-nucleon form-factor, the treatment of the particle-hole nuclear excitations in intermediate state as well as theΔ-resonance degrees of freedom.
Here we briefly review the approach followed in [7, 8, 18] and consider constraints on the common nuclear meson cloud coming from the nuclear light-cone momentum sum rule together with the meson contribution to the nuclear potential energy. We write the MEC correction in a convolution form similar to (2):
qMECa/A =
m=π,ρ,...
fm/A⊗qa/m (10)
where fm/A(y,k2) is the nuclear distribution function of a meson typemover light-cone momentum
yand invariant massk2 andq
a/mis corresponding PDF in a virtual mesonmwith invariant massk2. The meson distribution function fmis driven by the imaginary part of the full meson propagator in a nucleus.
For simplicity we will discuss the isoscalar part ofqMEC
a/A assuming the meson PDFs qa/mto be independent from the meson type and equal to the corresponding pion PDF. We also neglect possi-ble off-shell dependence of qa/m. This will allow us to discuss the light-cone distribution function corresponding to the sum over all mesonsfM(y)=m dk2fm(y,k2).
The nuclear light-cone momentum is shared between the nucleons and mesons and the corre-sponding balance equation can be written as [18]
yM+yN =
MA
AM, (11)
Note the ratio of the nucleus massMA = A(M +εB), whereεB is the nuclear binding energy per nucleon, and the nucleon massM in (11). This ratio appears because of the definition of the light-cone momentumyand the nuclear Bjorken variablexinvolves the nucleon massM.
To further constrain the meson distribution, we consider a model nuclear Hamiltonian in effective meson-nucleon theory. Using equations of motion for interacting mesons and nucleons it was possible to obtain a relation [7, 8, 18]
3yM+
m2 M
M2y −1
M=−
V
M , (12)
whereyMandy−1Mare the moments of the nuclear meson distribution function,m2Mis an average meson mass squared, andV is the average nuclear potential energy (see (7) and the discussion thereafter). Note that (12) was obtained in static approximation neglecting the contribution from the terms with time derivatives of meson fields (this is justified by the fact that a typical energy transfer in the nucleon–nucleon interaction in the nuclear ground state is much smaller than corresponding momentum transfer). If only the pion contribution is considered, thenm2
M=m2πandVcorresponds to the pion contribution to the nuclear potential energy.
It is important to note that (11) and (12) allow us to overall constrain the nuclear meson distribu-tion funcdistribu-tion in terms of average nucleon separadistribu-tion and kinetic energyεandT. In particular, for the deuteron with the Paris wave function we haveyM =0.0045 andy−1M =0.390, while for the 208Pb nucleus we have 0.029 and 0.543, respectively.
the nucleon massM. We assume that such configurations are suppressed in nonrelativistic nuclei and consider the meson distribution in the region 0< y <1 and use the following model
fM/A(y)=cy(1−y)n. (13)
The parameterscandndepend on the specific nucleus and fixed fromyMandy−1Mcalculated by (11) and (12).
2.3 Correction from nuclear coherent processes
In the region of smallxthe DIS correlation lengthLexceeds typical distances between bound nucleons and intermediate quark-gluon states may develop multiple scattering interactions while propagating in nuclear environment. To the leading order this effect results in a negative correction known as the nuclear shadowing effect (for a review, see [17]).
In order to address this effect, in [7] we assume that the set of intermediate hadronic states can be approximated by a single effective state and describe its interaction with the nucleon by an effective scattering amplitudea. The rate of the contribution to DIS cross section is driven by Ima. This amplitude depends on the type of the PDF and differ for the proton and the neutron.
It is convenient to discuss nuclear effects in terms of the ratioRi/A = qi/A/(Zqi/p +Nqi/n) for the given PDF typei. Using the optical theorem this ratio can be written in terms of effective cross sections, or the imaginary part of the effective amplitudes in the forward direction
δcohRi/A=ImAi/(ZImaip+NImain), (14)
whereAiis the nuclear amplitude which describes propagation of intermediate states corresponding to PDF of typei in a nucleus, and aip andain are corresponding proton and neutron amplitudes, respectively. We compute the amplitudeAin terms of the Glauber-Gribov multiple-scattering series [31, 32]. Note that the multiple-scattering series start from the double-scattering term, as the single-scattering term is already accounted in the impulse approximation of (2). For more detail discussion ofAsee [7, 8].
To have a closer link to the DIS structure functions, it is convenient to discuss the combinations of PDFs with definiteC-parity,q±i =qi±q¯i. Leta±ipanda±inbe the corresponding proton and neutron effective amplitudes. For theuandd(anti)quark distributions we also consider the combinations with definite isospinI=0,1 andCparityqC
I, i.e.q±0 =u±+d±andq±1 =u±−d±.
We separate the isoscalar and the isovector contributions in Aassuming the isospin symmetry for the scattering offprotons and neutrons, i.e. aup = adnandad p = aun, and write the amplitudes asaup =a0+ 12a1 andad p =a0−12a1, wherea0anda1are the isoscalar and isovector amplitudes, respectively. To the first order inβ=(Z−N)/Awe have [34]
Au,d=A(a0)±β
2a1A (a
0), (15)
where the sign+−should be taken for theuanddquark, respectively, andA =∂A/∂a. The first and the second terms in (15) drive the corrections to the isoscalarq0 and the isovector q1 quark distribution, respectively.
Let us consider first the isoscalarI=0 case. For the nuclear corrections for theC-even andC-odd quark distributions we have
δR+0 =ImA(a+0)/(AIma+0), (16a)
wherea±0 are theIC =0±amplitudes. We note that (16) are obtained by treating theC-odd amplitude as a small parameter and expanding the difference between the quark and antiquark nuclear amplitudes in series ofa−0 to the order (a−0)2 [34]. The effective expansion parameter in (16) is the ratio of the amplitudesa−0/a+0. The smallness of this parameter can be justified within the Regge pole model of high-energy scattering amplitudes.
The nuclear corrections in the isovector termI = 1 can be calculated similarly to the isoscalar case discussed above. We consider 1±channels and expand the corresponding nuclear amplitude in series ofa−0. To the leading order we have
δR±1 =βIma±1A(a+0)/(AIma±1), (17)
where the superscript+and−corresponds to the channel 1+and 1−, respectively. In the derivation of (17) we drop the terms of ordera±1a−0. Note in this context that the effective amplitudes 1± or 0−are generally significantly smaller than the leading amplitudea+0, which drives multiple scattering corrections for all PDFs, as it can be seen from (16) and (17). Furthermore, in the considered approximation the ratioδR−0 as well as the ratiosδR±1 are independent of the effective cross sections in the corresponding channels and depend only onα=Rea/Imaof corresponding amplitude.
The individual corrections foruanddquarks and antiquarks can be derived fromδR±0,1ratios. For more detail see [8].
2.4 Discussion and comparison with data
A detailed analysis of data on the ratios of DIS structure functionsR(A/A) = F2A/FA2 for different nuclei was carried out in [7] in the context of the described model. The analysis included data with
Q2 ≥1 GeV2for the full region of Bjorken xfrom CERN, FNAL and SLAC available before 1997 (see table 1 in [7]). The ratioR(A/A) was computed including nuclear corrections discussed above. Also the target mass [37] and the higher-twist corrections [38] were applied to the structure functions. The predictions were then compared with data by evaluatingχ2as discussed in [7].
The functionδf, which determines off-shell correction (see (9)), and also the effective amplitude
a+0, which drives coherent nuclear corrections for the structure functionF2at smallx, were determined phenomenologically from this analysis. The functionδf was assumed universal, i.e. same for quark and antiquark PDFs independent of flavor, and also independent of scaleQ2,δf =δf(x). We model
δf(x) as a third-order polynomial and extract parameters from analysis of R(A/A). The effective amplitudea+0 is the subject of several constraints. In the region of low Q2 <1 GeV2 the amplitude a+0 is constrained by vector meson dominance model [33].4 Also in the region Q2 > 10 GeV2 the amplitudea+0 and the functionδf are linked by the normalization condition on the nuclear valence quark distribution. The latter is used to determine the leading twist part of the amplitudea+0 [7, 8]. The available nuclear DIS data at small xconstrains the effective amplitude a+0 in a region which is transitional between fully nonperturbative region ofQ2 <1 GeV2and the regionQ2 >10 GeV2, which is driven by the leading twist contribution [7].
The results reported in [7] show an accurate description of the measured dependencies on x,
Q2 and the nuclear mass number Ain the full kinematical region of data. The predictions of [7] were further verified [35] with the recent nuclear DIS data from HERA [47] and JLab [46]. Figure 1 summarizes the data onR(A/D) from4He to208Pb together with the model calculations.
We would like to remark that in some cases the data points from different experiments are not fully consistent. In particular, the central points of12C/D and40Ca/D ratios from E665 experiment
0.7 0.8 0.9 1 1.1 1.2 1.3 1.4 F2 A/F 2 D 4 2He SLAC E139 CERN NMC JLab E03103 KP model 7
3Li 9
4Be
SLAC E139 (Be) CERN NMC (Li) JLab E03103 (Be) KP model 0.7 0.8 0.9 1 1.1 1.2 1.3 1.4 F2 A/F 2 D 12
6C 14
7N
SLAC E139 (C) CERN NMC (C) FNAL E665 (C) DESY HERMES (N) JLab E03103 (C) KP model
27
13Al
SLAC E139
CERN NMC (Al/C)*(C/D) KP model 0.7 0.8 0.9 1 1.1 1.2 1.3 1.4 F2 A/F 2 D 40 20Ca SLAC E139 CERN NMC FNAL E665 KP model 56
26Fe 63
29Cu 84
36Kr
SLAC E139 (Fe) CERN EMC (Cu) CERN BCDMS (Fe) DESY HERMES (Kr) KP model 0.6 0.7 0.8 0.9 1 1.1 1.2 1.3 1.4
10-4 10-3 10-2 0.1 0.3 0.5 0.7 0.9
F2 A/F 2 D Bjorken x 108
47Ag 119
50Sn 131
54Xe
SLAC E139 (Ag) CERN NMC (Sn/C)*(C/D) FNAL E665 (Xe) KP model
10-4 10-3 10-2 0.1 0.3 0.5 0.7 0.9
Bjorken x 197
79Au 208
82Pb
SLAC E139 (Au) CERN NMC (Pb/C)*(C/D) FNAL E665 (Pb) KP model
Figure 1. Summary of data on the ratioFA
[45] at lowxare systematically above the corresponding NMC measurements, which have smaller uncertainties. Similarly, a normalization problem could be present for the E665208Pb/D data. How-ever, the double ratios (40Ca/D)/(12C/D) and (208Pb/D)/(12C/D) of the E665 measurement are in good agreement with the NMC data [41] as well as with our predictions. Also the central points of4He/D, 9Be/D and12C/D ratios reported in [46] are systematically above the corresponding E139 [44] and
NMC [39, 40] results forx>0.3.5 However, the slopes of the measured ratios forx>0.2 seems to be in a good agreement for all experiments. We also comment that the analysis of [35] indicates that a common renormalization factor of 0.98 applied to the data points of [46] leads to a perfect statistical agreement of the discussed data sets.
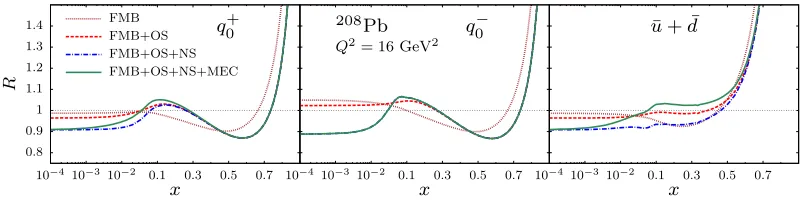
In figure 2 we show nuclear effects on different PDFs computed for 208Pb at Q2 = 16 GeV2 following [8]. The labels on the curves show different nuclear corrections included in turn: Fermi motion and binding (FMB), off-shell correction (OS), nuclear shadowing (NS), meson cloud (MEC).
0.8 0.9 1 1.1 1.2 1.3 1.4
10−410−3 10−2 0.1 0.3 0.5 0.7
R
x q+0
10−410−3 10−2 0.1 0.3 0.5 0.7 x
208Pb
Q2= 16 GeV2 q−0
10−410−3 10−2 0.1 0.3 0.5 0.7 x
¯
u+ ¯d
FMB FMB+OS FMB+OS+NS FMB+OS+NS+MEC
Figure 2. The ratioRi =qi/A/(Zqi/p+Nqi/n) computed for various combinations of parton distributions for the
lead nucleus at fixedQ2=16 GeV2. The left panel shows different nuclear corrections forq+
0 =u+d+u¯+d¯, the middle panel is forq−0 =u+d−u¯−d¯, while the right panel is for antiquark distribution ¯u+d¯.
Note that different nuclear effects outlined above are relevant in different regions of Bjorkenx, as it can be seen from figure 2. In the region of largex >0.2 the leading correction is due to nuclear Fermi motion and binding which is described in terms of the nuclear spectral function. The off -shell correction is also relevant in this region. The nuclear MEC correction is relevant forx < 0.2 while at smallx0.1 the nuclear effects are dominated by multiple scattering of virtually produced quark-gluon intermediate states. Note also an interplay between different nuclear corrections on the antiquark distribution leading to a strong cancellation of nuclear effects in an intermediate region of
x. The implication of this observation will be discussed in more detail in Sec.3 in the context of the measurement of nuclear sea-quark distribution in the Drell-Yan experiments.
We also remark that different nuclear effects are related through a number of sum rules which reflect different global symmetries. In particular, the conservation of the valence quark number links together the off-shell and the shadowing corrections to the valence quark distributions. The normal-ization conditions for the nuclear isoscalarq−0 and the isovectorq−1 valence quark distributions were used in this analysis to constrain the unknown amplitudesa−0,1controlling the nuclear correction in the smallxregion [8]. The conservation of the nuclear light-cone momentum causes the corresponding sum rule at two different levels. At the hadronic level, the nuclear light-cone momentum is shared be-tween nucleons and mesons (see (11)), which allows us to constrain the MEC correction to NPDFs. At the partonic level, the light-cone momentum is balanced between quarks, antiquarks and gluons.
5Similarly about 3% mismatch in the normalization of data points from HERMES and JLab measurements is present for
The study of different contributions to the light-cone momentum sum rule can provide insights on modification of gluon distribution in nuclei.
3 Nuclear Drell-Yan process
The reaction of muon pair production in hadron-hadron collisions (Drell-Yan process) is an important source of information on the proton, pion and nuclear PDFs [48]. In the context of NPDFs, the use of DY data in combination with DIS data allows a separation of the nuclear valence and sea quark distributions. In the DY reaction with the proton beam by tuning the kinematics of the muon pair one can select a region in which the DY cross sections are driven by annihilation of valence quarks in the beam and antiquarks in the target. Then the ratio of the p+A DY cross sections offdifferent nuclear targets provide a tool to measure the nuclear dependence of antiquark PDFs
σDY A
σDY B
≈u¯A(xT,Q2)+d¯A(xT,Q2)
¯
uB(xT,Q2)+d¯B(xT,Q2)
, (18)
wherexT is the Bjorken variable of a nuclear target andQis the mass of the lepton pair.
0.85 0.9 0.95 1 1.05 1.1 1.15
σ
(pT
1
) /
σ
(pT
2
)
12 C
E772 data C/D
C/D, E′=0
C/D, E′=0.7 40Ca
E772 data Ca/D
Ca/D, E′=0
Ca/D, E′=0.7
0.85 0.9 0.95 1 1.05 1.1 1.15
0.1
σ
(pT
1
) /
σ
(pT
2
)
xT
56Fe E772 data Fe/D
E866 data Fe/Be
Fe/D, E′=0
Fe/D, E′=0.7
Fe/Be, E′=0
Fe/Be, E′=0.7
0.1
xT
184W E772 data W/D
E866 data W/Be
W/D, E′=0
W/D, E′=0.7
W/Be, E′=0
W/Be, E′=0.7
Figure 3. Ratio of the DY reaction cross sections for different nuclei vs. xT. Data points are from the E772
This ratio was measured in the experiments E772 [49] and E866 [50] with the proton beam mo-mentum 800 GeV/c at Fermilab in the regionxT <0.15 for a number of nuclear targets. Note that the scaleQ2 is determined by the dimuon mass and Q2 > 16 GeV2 in [49], which is significantly higher than the corresponding scale from the fixed-target nuclear DIS in the sea region. In contrast to DIS, the data on DY nuclear ratios show no antishadowing (i.e. enhancement of nuclear antiquark distributions) atxT ∼ 0.1 that was a long standing puzzle since the nuclear binding should result in an excess of nuclear mesons, which is expected to produce a marked enhancement in the nuclear anti-quark distributions [51].
In figure 3 we show the data along with our predictions on the ratios of the DY cross sections [8]. Note that, as it can be seen from figure 2, various nuclear corrections to the antiquark distribution tend to cancel each other in the region 0.1<xT <0.4, in agreement with data on the nuclear DY process. We also remark that nuclear dependence of the DY process comes from two different sources: (i) the nuclear effects on the bound nucleon PDFs, and (ii) the initial state interaction of the projectile parton in nuclear environment that causes the parton energy loss [52] before annihilation into a dimuon pair. The rate of this effect is characterized by the parton energy loss in a nucleus per unit lengthEand effectively results in a change of the projectile parton Bjorkenx[53] which in turn affects the ratio in (18).
The data from the E866 experiment is shifted towards lower values of target’sxTand higher values of projectile’sxB with respect to the E772 data thus falling into a region where both the shadowing and the energy loss effects become more prominent. The analysis of [8] indicates that the model is in a good agreement with data at a moderate energy loss effect of order of 1 GeV/fm. The solid curves in figure 3 show our predictions withE=0.7 GeV/fm. Note also that the cross section ratios are taken relative to the deuterium for E772 and beryllium for E866. For this reason the corresponding curves in figure 3 are not identical in the overlap region.
4 Production of
W
±and
Z
bosons in p+Pb collisions at LHC
A study of theW±andZ0 boson production cross sections in p+Pb collisions with √s =5.02 TeV at the LHC was performed in [54] in terms of the NPDF model of [8]. Figure 4 shows the model predictions on the production cross sections as a function of the vector boson rapidityyin comparison with recent CMS data [55, 56].6 Similar comparison with preliminary ATLAS data can be found in [54]. We found an excellent agreement between the theoretical predictions based on discussed NPDF model and the measured observables in the entire kinematic range accessible by the experiments. In particular, the model correctly describes the magnitude and the shape of rapidity distributions as well as the difference betweenW+andW−boson distributions (flavor dependence).
This study clearly indicates the presence of nuclear modifications on theW/Zboson production cross sections with respect to the case of p+p collisions. The corresponding nuclear effect is illustrated in the lower panels of figure 4, in which we show the ratio of the result of the full calculation to that without nuclear corrections. In this study we use the ABMP15NNLO proton PDFs of [57]. For com-parison we also show the results obtained with CT10NLO proton PDFs [58] with phenomenological nuclear corrections of [4].
6Experimentally, it is easier to measure the pseudorapidity of the charged lepton originated from theWboson decay,ηl,
20 40 60 80 100 120 d σ / d ηlab l [ nb ] ABMP15+KP CT10+EPS09
ABMP15 (Z×p+N×n) 40 60 80 100
-3 -2 -1 0 1 2 3
ηlabl
0.8 0.9 1
data / ABMP15
-3 -2 -1 0 1 2 3
ηlabl
0.9 1 1.1
W+ W−
p+Pb
√sNN=5.02TeV
NLO CMS 0 5 10 15 20 25 d / dy Z ( nb )
-2 -1 0 1 2
yZ
c.m.
0.8 1
data / ABMP15
NLO CMS
Z0
Figure 4.Top panels: differential cross sections forW+(left),W−(middle), andZ0(right) production in p+Pb collisions at √sNN = 5.02 TeV, as a function of (pseudo)rapidity. The data points indicate the CMS mea-surements [55, 56], while the curves show the predictions based on different models: ABMP15+KP (solid), CT10+EPS09 (dashed-dotted), and ABMP15 without nuclear modifications (dashed). Bottom panels: ratios of the data points and the model predictions shown in the top panels with respect to the result obtained without nuclear modifications (ABMP15). For more details see [54].
In order to illuminate the link between the nuclear correction on the rapidity distributions and those on the PDFs, we recall that in the leading order we have7
dσW+/dy∝d¯p(xp)uA(xA)+up(xp) ¯dA(xA), (19)
dσW−/dy∝u¯p(xp)dA(xA)+dp(xp)¯uA(xA), (20)
xp=x0exp(y), xA=x0exp(−y), (21)
wherexp and xA are the Bjorken variables for the proton and the nucleus, respectively, and x0 = MW/√scorresponds to the central rapidityy =0. At √s = 5.02 TeV we have x0 = 0.016. Thus aty > 0 the rapidity distributions are determined by small-xA region in a nucleus and subject to nuclear shadowing correction. Indeed, the lower panels in figure 4 show a clear suppression of p+A cross sections in this region. Note also that in this region the production of theW+andW−is driven by, respectively, theuandd quarks in the proton. This explains a higher magnitude of W+ boson production rate and also the different shape of W− andW+ boson rapidity distribution. The full nuclear correction on the vector boson production in p+Pb collisions is the result of an interplay of the various mechanisms discussed in Sec.2. It is interesting to note that in the backward rapidity region (y <0) the off-shell correction plays an important role.
Finally, it is worth noting that the precision currently achieved by the LHC experiments with p+Pb and Pb+Pb collisions starts to be sensitive to the predicted nuclear corrections. A further improvement of the accuracy of future data would be extremely valuable in this context since it could provide a tool to disentangle the effect of different underlying mechanisms responsible for the nuclear modifications of PDFs and to study their flavor dependence.
Acknowledgements:I am grateful to R. Petti for fruitful collaboration on reviewed topics. I would like to thank the Organizing Committee of Baldin ISHEPP-23 Conference for warm hospitality. The work was supported by the Russian Science Foundation grant No. 14-22-00161.
References
[1] J. C. Collins, D. E. Soper and G. F. Sterman, Adv. Ser. Direct. High Energy Phys.5, 1 (1988) [2] M. Arneodo, Phys. Rept.240, 301 (1994)
[3] P. R. Norton, Rept. Prog. Phys.66, 1253 (2003)
[4] K. J. Eskola, H. Paukkunen and C. A. Salgado, JHEP0904, 065 (2009) [5] M. Hirai, S. Kumano and T. -H. Nagai, Phys. Rev. C76, 065207 (2007)
[6] D. de Florian, R. Sassot, P. Zurita and M. Stratmann, Phys. Rev. D85, 074028 (2012) [7] S.A. Kulagin and R. Petti, Nucl. Phys. A765, 126 (2006)
[8] S. A. Kulagin and R. Petti, Phys. Rev. C90, 045204 (2014)
[9] B.L. Ioffe, V.A. Khoze and L.N. Lipatov,Hard Processes. Vol. 1: Phenomenology, Quark Parton Model(North-Holland, Amsterdam, 1984)
[10] G. B. West, Ann. Phys.74, 464 (1972)
[11] A. Bodek and J. L. Ritchie, Phys. Rev. D23, 1070 (1981)
[12] S. V. Akulinichev, G. M. Vagradov and S. A. Kulagin, JETP Lett.42, 127 (1985). [Pisma Zh. Eksp. Teor. Fiz.42, 105 (1985)]
[13] S. V. Akulinichev, S. A. Kulagin and G. M. Vagradov, Phys. Lett. B158, 485 (1985) [14] S.A. Kulagin, G. Piller and W. Weise, Phys. Rev. C50, 1154 (1994)
[15] C. H. Llewellyn Smith, Phys. Lett. B128, 107 (1983) [16] M. Ericson and A. W. Thomas, Phys. Lett. B128, 112 (1983) [17] G. Piller and W. Weise, Phys. Rept.330, 1 (2000)
[18] S. A. Kulagin, Nucl. Phys. A500, 653 (1989) [19] S. A. Kulagin, Nucl. Phys. A640, 435 (1998)
[20] S. A. Kulagin and A. V. Sidorov, Eur. Phys. J. A9, 261 (2000) [21] S. A. Kulagin and W. Melnitchouk, Phys. Rev. C78, 065203 (2008) [22] F. Gross and S. Liuti, Phys. Rev. C45, 1374 (1992)
[23] S. G. Bondarenko, V. V. Burov, A. V. Molochkov, G. I. Smirnov and H. Toki, Prog. Part. Nucl. Phys.48, 449 (2002)
[24] S. I. Alekhin, S. A. Kulagin and S. Liuti, Phys. Rev. D69, 114009 (2004) [25] R. Subedi et al., Science320, 1476 (2008)
[26] B. L. Friman, V. R. Pandharipande and R. B. Wiringa, Phys. Rev. Lett.51, 763 (1983)
[27] E. E. Sapershtein and M. Z. Shmatikov, JETP Lett.41, 53 (1985). [Pisma Zh. Eksp. Teor. Fiz.
41, 44 (1985)]
[28] H. Jung and G. A. Miller, Phys. Rev. C41, 659 (1990)
[29] L. P. Kaptari, A. I. Titov, E. L. Bratkovskaya and A. Y. Umnikov, Nucl. Phys. A512, 684 (1990) [30] E. Marco, E. Oset and P. Fernandez de Cordoba, Nucl. Phys. A611, 484 (1996)
[31] R. J. Glauber and G. Matthiae, Nucl. Phys. B21, 135 (1970)
[32] V. N. Gribov, Sov. Phys. JETP30, 709 (1970). [Zh. Eksp. Teor. Fiz.57, 1306 (1969)]
[33] T. H. Bauer, R. D. Spital, D. R. Yennie and F. M. Pipkin, Rev. Mod. Phys.50, 261 (1978).51(E), 407 (1979)
[35] S. A. Kulagin and R. Petti, Phys. Rev. C82, 054614 (2010) [36] S.I. Alekhin, S.A. Kulagin and R. Petti, arXiv:1609.08463 [nucl-th] [37] H. Georgi and H. D. Politzer, Phys. Rev. D14, 1829 (1976)
[38] S. Alekhin, S. A. Kulagin and R. Petti, AIP Conf. Proc.967, 215 (2007) [39] M. Arneodo et al. [New Muon Collaboration.], Nucl. Phys. B441, 12 (1995) [40] P. Amaudruz et al. [New Muon Collaboration], Nucl. Phys. B441, 3 (1995) [41] M. Arneodo et al. [New Muon Collaboration], Nucl. Phys. B481, 3 (1996) [42] J. Ashman et al. [European Muon Collaboration], Z. Phys. C57, 211 (1993) [43] G. Bari et al. [BCDMS Collaboration], Phys. Lett. B163, 282 (1985) [44] J. Gomez et al., Phys. Rev. D49, 4348 (1994)
[45] M. R. Adams et al. [E665 Collaboration], Z. Phys. C67, 403 (1995) [46] J. Seely et al., Phys. Rev. Lett.103, 202301 (2009)
[47] K. Ackerstaff et al. [HERMES Collaboration], Phys. Lett. B475, 386 (2000). B567(E), 339 (2003)
[48] J.-C. Peng and J.-W. Qiu, Prog. Part. Nucl. Phys.76, 43 (2014) [49] D. M. Alde et al., Phys. Rev. Lett.64, 2479 (1990)
[50] M. A. Vasilev et al., Phys. Rev. Lett.83, 2304 (1999)
[51] R. P. Bickerstaff, M. C. Birse and G. A. Miller, Phys. Rev. Lett.53, 2532 (1984) [52] J. D. Bjorken, FERMILAB-PUB-82-059-THY, FERMILAB-PUB-82-059-T [53] G. T. Garvey and J. C. Peng, Phys. Rev. Lett.90, 092302 (2003)
![Figure 1.Summary of data on the ratioofbetter display of both the small FA2 /FD2 for various nuclei from the measurements at CERN [39–43], SLAC [44], FNAL [45], JLab [46] and DESY [47]](https://thumb-us.123doks.com/thumbv2/123dok_us/8147354.1358422/8.482.42.442.76.601/figure-summary-ratioofbetter-display-small-various-nuclei-measurements.webp)
![Figure 3. Ratio of the DY reaction cross sections for di[8] for the deuteron (green) and beryllium (red) ratios with (full line) and without (dashed line) the projectileenergy loss efferent nuclei vs](https://thumb-us.123doks.com/thumbv2/123dok_us/8147354.1358422/10.482.52.428.296.567/figure-reaction-sections-deuteron-beryllium-projectileenergy-eerent-nuclei.webp)
![Figure 4. Top panels: diCT10the data points and the model predictions shown in the top panels with respect to the result obtained withoutsurements [55, 56], while the curves show the predictions based on differential cross sections for W+ (left), W− (middle](https://thumb-us.123doks.com/thumbv2/123dok_us/8147354.1358422/12.482.42.443.79.230/figure-predictions-respect-obtained-withoutsurements-predictions-dierential-sections.webp)
