1
Global Spatial Relationship between Land Use
Land Cover and Land Surface Temperature
Azad Rasul 1,*
1 Department of Geography, Faculty of Arts, Soran University, Soran 44008, Iraq * Correspondence: [email protected]; Tel.: +964-(0)-750-735-8574.
Abstract
Land Surface Temperature (LST) and Land Use Land Cover (LULC) are the principal aspects of climate and environment studies. The object of the study is to assess spatial relationship between LST and remote sensing LULC indices at the global and continental scale. Moderate Resolution Imaging Spectroradiometer (MODIS) Aqua daytime LST and eight LULC MODIS indices of 2018 prepared and processed using Earth Engine Code Editor. R squared and significance of the relationship values of randomly selected points computed in R program. The research observed the relationship between examined indices and LST is significant at the 0.001 level. Normalized Difference Water Index (NDWI) and Normalized Difference Snow Index (DSI) are the dominant drivers of LST in the world, Asia and North America. In Australia and Africa, Normalized Difference Vegetation Index (NDVI) and Enhanced Vegetation Index (EVI) are the dominant drivers of LST. Albedo and Normalized Difference Soil Index (NDSI) have superior in Central America. In South America and Europe, the dominant driver of LST is NDWI. Relationship between albedo and LST is moderate inverse on a global scale. Observed relationship between LST and examined vegetation indices is positive in Europe and North America while inverse in Australia and Africa. All observed relationship between Normalized Difference Built-up Index (NDBI) and LST are positive. Association observed between NDSI and LST is positive in Australia, Africa and Central America.
Keywords: Land Use Land Cover (LULC); Land Surface Temperature (LST); Google Earth Engine (GEE); relationship; remote sensing indices; MODIS; global
1- Introduction
The land surface is a combination of vegetation, water, impervious surface, snow and exposed soils. As a result of the complicity of surface, Land Surface Temperature (LST) varies spatially and temporally. Thermal band of satellite sensors can be utilized for retrieval and study terrestrial surface temperature. Since LST represent the temperature skin of the surface, it plays an important role in the study and models of global climate and climate change. Remote seining data is an important source available widely to produce and analyses Land Use Land Cover (LULC) classes. These data are capable to provide up to date, synoptic views and repetitive coverage of land characteristics (Hegazy and Kaloop, 2015; Zha et al., 2003). Analyses big data of the world required powerful computers. One of the cloud-computing tools is GEE that available as a powerful remote sensing platform. It makes processing and analyzing enormous remote sensing data easier and faster.
2
LULC subject is one of the principal aspects of climate and environment studies. The physical condition of the surface is called land cover while human-altered part of these lands referred to as land use. Satellite data was widely utilized to study spatiotemporal comparison LULC study. Remote sensing spectral indices are a good method to classify LULC classes (Chen et al., 2006). Among them the Normalized Difference Soil Index (NDSI) to select bare soil pixels (Rogers and Kearney, 2004). Normalized Difference Built-up Index (NDBI) to automatically separate built-up areas (Zha et al., 2003). Normalized Difference Water Index (NDWI) to select water and vegetation liquid (Gao, 1995). The Normalized Difference Vegetation Index (NDVI), which is vegetation ratio based index. Enhanced Vegetation Index (EVI), which developed for high biomass regions. Leaf area index (LAI), which is used as a measurement of the total area of leaves per unit area. The Normalized Difference Snow Index to select snow cover lands. In this paper, we abbreviated it as (DSI) to be not confused with NDSI of soil index.
There are many factors lead LST to vary spatially and temporally. MODIS and Landsat data are widely utilized to study the relationship or correlation between LST and LULC. For instance, the correlation between LST and NDVI and LAI studied extensively (Rasul et al., 2017; Schwarz et al., 2012). MODIS LST product used by Clinton and Gong (2013) to study LST of urban areas at the global scale. Vegetation is capable to modify surface and air
temperature through evapotranspiration and shading (Oke, 1989). Based on different areas and times researchers state different results of relationship between LST and vegetation indices, such as strong linear inverse relationship (Bajaj et al., 2012; Liang and Shi, 2009), weak positive relationship (Sumida et al., 2018), and none relationship (Zhang et al., 2008). In the global correlation analyses between NDVI and climatic variables, Ichii et al. (2002) observed a positive correlation between the temperature and NDVI in Europe and Asia (as an example of areas located in northern mid and high latitudes). This positive correlation in the region is associated with the NDVI increase. However, they identified inverse correlation in the southern hemisphere such as South America, southern Africa and northern Australia.
Many research observed increase surface and air temperature in built-up and urbanized areas (Amiri et al., 2009; Baker et al., 2002; Kalnay and Cai, 2003), however, in some areas the inverse relationship indicated between LST and built up indices especially during the daytime in arid and semi-arid regions (Rasul, 2016; Trenberth, 2004). Rasul et al. indicate in semi-arid cities built-up area lead to decrease LST during the daytime. They exhibited the wetness in the major determinant of LST (Rasul et al., 2015). To examine the relationship between the spatial distribution of LST and LULC, Chen et al (2006) used Normalized Difference Bareness Index (NDBaI), NDBI, NDVI and NDWI.
3
2- Data and methods
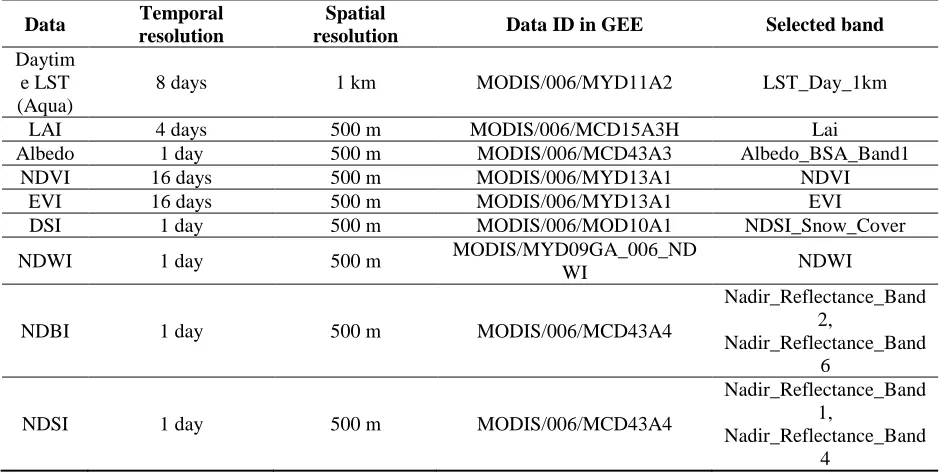
2.1 DataAqua daytime LST product MYD11A2 V6 of the year 2018 utilized in this study. Each pixel value of the LST product is an average of 8 day period (Wan et al., 2015). LAI band of product "MCD15A3H V6" level 4 is selected for this study. It is a composite of 4-day data with a spatial resolution of 500 m (Table 1). For this product, the best pixel available from Terra and Aqua sensors during 4 days selected by the algorithm (Myneni et al., 2015). Albedo from band 1 MODIS product "MCD43A3 V6" utilized in the current study. Each daily data of albedo is produced from 16 days of data (Schaaf and Z., 2015). NDVI and EVI vegetation indices utilized from MYD13A1 V6 product. The products are produced from atmospherically corrected surface reflectance. Low clouds and view angles with the highest NDVI/EVI value criteria selected by the algorithm to prepare product from the 16 day period (Didan, 2015).
Snow cover product of MODIS Terra “MOD10A1 V6” utilized in the study. It is a daily product of the world with 500 m resolution, which produced based on the NDSI index (Hall and G. A., 2016). For water and liquid in vegetation, MODIS Aqua daily product
“MYD09GA_006_NDWI” utilized in the study. The index produced from the Near-IR band and a second IR band if it is available. This data is produced using the “MYD09GA” surface
reflectance composites (Google, 2018).
2.2 NDBI and NDSI indices
NDBI index produced using selected bands of MODIS MCD43A4 data according to Equation 1 and NDSI prepared according to Equation 2:
NDBI = (b6 - b2)/ (b6 + b2) (1)
where b2: Nadir_Reflectance_Band2, b6: Nadir_Reflectance_Band6. NDBI is normalized difference built-up index ranges from -1 to 1. A higher value means more built areas.
NDSI = (b1 - b4)/ (b1 + b4) (2)
4 Table 1: Details of the utilized data in the research.
Data Temporal
resolution
Spatial
resolution Data ID in GEE Selected band
Daytim e LST (Aqua)
8 days 1 km MODIS/006/MYD11A2 LST_Day_1km
LAI 4 days 500 m MODIS/006/MCD15A3H Lai
Albedo 1 day 500 m MODIS/006/MCD43A3 Albedo_BSA_Band1
NDVI 16 days 500 m MODIS/006/MYD13A1 NDVI
EVI 16 days 500 m MODIS/006/MYD13A1 EVI
DSI 1 day 500 m MODIS/006/MOD10A1 NDSI_Snow_Cover
NDWI 1 day 500 m MODIS/MYD09GA_006_ND
WI NDWI
NDBI 1 day 500 m MODIS/006/MCD43A4
Nadir_Reflectance_Band 2,
Nadir_Reflectance_Band 6
NDSI 1 day 500 m MODIS/006/MCD43A4
Nadir_Reflectance_Band 1,
Nadir_Reflectance_Band 4
2.3 Methodology
MODIS LST and LULC indices of 2018 processed and analysed using Earth Engine Code Editor (Gorelick et al., 2017). The name of data collection, the period of study and
interested bands selected in GEE. Values are multiplied by a scale factor when it is required. For instance, LST multiplied by 0.02,Lai by 0.1, albedo by 0.001, NDVI and EVI by 0.0001. Annual data of LST and indices prepared based on mean value of pixels. For the global analyses, 1,000 points randomly selected and for each continent 150 points randomly selected. Then, the value of LST and LULC indices extracted for the glob and each continent. Excel files of results that contain coordination, values of LST and LULC indices of sample points exported from GEE to Google Drive then downloaded to a local computer. Files opened in R programming and figures created by using packages such as "ggpubr", "tidyverse", " ggpmisc", "dplyr" and "ggplot2". Not available values excluded from processing in the study. Statistical calculations conducted in R program. Multiple R-squared selected from “summary” command and the significance of a relationship between LST and indices produced using “Welch's t-test” function in R.
3- Results:
3.1 Global spatial relationship between LULC indices and LST
5
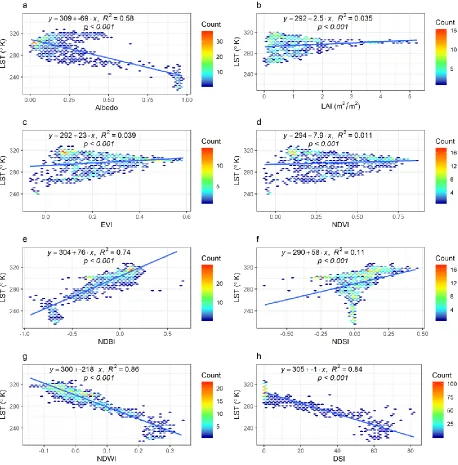
statistically significant inverse relationship (R2 = 0.58). It means low albedo associated with high LST pixel values. The association between NDSI and LST is very weak significant positive (R2
= 0.11); positive high soil value (NDSI) located with high LST values. In contrast, none
relationship observed between LST and examined vegetation indices (LAI (R2 = 0.035), EVI (R2 = 0.039) and NDVI (R2 = 0.011)). It means, at the global scale, high vegetation indices not
associated with low LST, however, in contrast, low (close to zero) value of LAI, EVI and NDVI associated with low LST (between 240 and 250 C, Figure 1b-d).
6
3.2 Continental spatial relationship between LULC and LST 3.2.1 Africa
At the continental scale, in Africa only strong significant inverse linear relationship (R2 = 0.73, p < 0.001) recognized between EVI and LST. It means high EVI values lead to a decrease in LST (Figure 2c). The relationship with other vegetation indices is a moderate significant inverse. R2 with NDVI is 0.7 (p < 0.001) and with LAI is 0.6 (p < 0.001). The relationship with NDBI and NDSI are moderate significant positive. It means high LST associated with a high value of build-up and bare soil. The relationship with water is moderate inverse and high water body associated with low LST, however, none relationship observed between LST and snow index in Africa (Figure 2h).
7
3.2.2 Asia
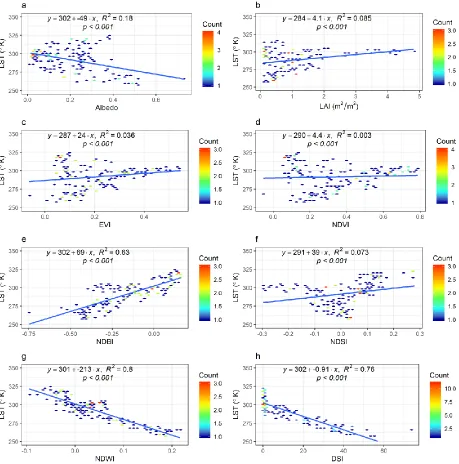
In 2018, strong significant inverse linear relationship observed in Asia between LST and NDWI (R2 = 0.8; p < 0.001) and DSI (R2 = 0.76; p < 0.001). It means, high samples of LST associated with low water and soil indices value and increases NDWI and DSI values lead to decrease LST. Moderate positive relationship (R2 = 0.63; p < 0.001) confirmed between NDBI and LST in the continent (Figure 3e). In contrast, none relationship recognized between LST and vegetation indices and albedo (Figure 3a-d).
Figure 3: Spatial relationship between LULC indices and LST in Asia during 2018.
3.2.3 Europe
8
between LST and NDWI (R2 = 0.83) and DSI (R2 = 0.8) while its relationship with NDBI is positive strong (R2 = 0.8, Figure 4e, g and h). It means that increased water and snow value lead to decrease LST and increase built-up value lead to increase LST. Moderate statistically
significant inverse relationship (R2 = 0.42) detected between LST and albedo in Europe. In contrast, small but significant positive relationship recognized between LST and EVI (R2 = 0.24)
and NDVI (R2 = 0.22); it means high EVI and NDVI value associated with high LST values in the continent. Nevertheless, none relationship observed with LAI (Figure 4b).
9
3.2.4 Australia
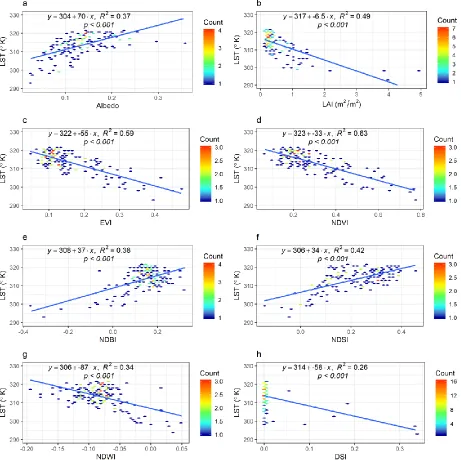
In 2018, moderate significant inverse linear relationship observed between LST and NDVI (R2 = 0.63; p < 0.001), EVI (R2 = 0.59; p < 0.001) and LAI (R2 = 0.49; p < 0.001), low values of LST associated with high examined vegetation indices in Australia (Figure 5b-d). Moderate significant positive relationship (R2 = 0.42) and low positive relationship (R2 = 0.38)
identified between LST and NDSI and NDBI, respectively. It means high built up and bare soil lead to increase LST in Asia. In addition, a low significant inverse relationship observed with NDWI (R2 = 0.34) and DSI (R2 = 0.26). In terms of albedo, the low positive relationship (R2 = 0.37) recognized with LST.
10
3.2.5 North America
In North America during 2018, very strong significant inverse linear relationship observed between LST and NDWI (R2 = 0.91) and DSI (R2 = 0.87) while its relationship with NDBI is strong positive (R2 = 0.84; Figure6 e, g-h). It means increased water and snow value lead to decrease LST and increase built-up value lead to increase LST. Moderate statistically significant inverse relationship (R2 = 0.69) confirmed between LST and albedo in North America and low LST associated with high albedo. In addition, moderate significant and low positive relationship observed between LST and EVI (R2 = 0.43, p < 0.001) and NDVI (R2 = 0.34, p <
11
Figure 6: Spatial relationship between LULC indices and LST in North America during 2018.
3.2.6 South America
In South America during 2018, neither strong nor moderate relationship observed between LST and examined LULC indices (Figure 7). Low significant relationship recognized between LST and NDWI (R2 = 0.31) and NDBI (R2 = 0.26). The relationship between LST and NDWI is inverse while the relationship with NDBI is positive; high NDBI associated with high LST in the continent. None relationship identified between LST in South America and other examined LULC indices, namely DSI, NDSI, EVI, NDVI, LAI and albedo (Figure 7).
12
3.2.7 Central America
In addition, in Central America during 2018, none strong relationship observed between LST and examined LULC indices (Figure 8). Only moderate relationship recognized between LST and albedo. The relationship is significant positive linear (R2 = 0.57, p < 0.001). It means high value of albedo associated with high LST (Figure 8a). Small significant positive
relationship confirmed between LST and NDSI (R2 = 0.35, p < 0.001) and NDBI (R2 = 0.28, p < 0.001). Increased built up and bare soil in Central America lead to increase LST (Figure 8e-f). None relationship identified between LST in Central America and other examined LULC indices, namely, LAI, EVI, NDVI, NDWI and DSI. It means examined vegetation indices and water and snow indices not influenced LST in Central America.
13
3.3 Spatial relationship between LULC indices and LST in different latitudes
The relationship between vegetation indices and LST is vary based on different latitudes. In northern hemisphere, only in high latitudes, the relationship is positive (R2 EVI = 0.53, R2 NDVI = 0.57, R2 LAI = 0.41). No relationship identified in middle latitudes between vegetation
indices and LST. These relationships convert to inverse in northern low latitudes, southern low and middle latitudes. The relationship is moderate in northern low latitudes but small in the southern hemisphere.
The relationship between albedo and LST is a strong inverse (R2 = 0.79) in northern high latitudes (high albedo associated with low LST) but no relation detected in northern middle latitudes. In northern low latitude, southern low and middle latitudes the relationship is positive (Table 2). It means high albedo associated with high LST.
The relationship between NDBI and LST is moderate positive in all different latitudes regions. The highest relationship observed in the northern middle latitudes. No relationship detected in the northern high latitudes, however, in the other parts of the world the relation is positive, high bare soil associated with high LST. The highest relationship observed in low latitudes regions (R2 = 61).
In the northern and Southern middle latitudes and northern high latitudes, the relationship between snow index and LST is inverse. As anticipated high snow values associated with low LST. However, in northern and southern low latitudes non-relationship observed. The
relationship between NDWI and LST is inverse moderate or strong in all different latitude regions (high NDWI values leads to decrease LST). The highest relationship was in the northern middle latitudes (R2 = 7). Al observed relationships between LULC indices and LST in all latitudes regions are statistically very significant.
Table 2. Spatial relationship between LULC indices and LST in different latitudes.
Latitudes EVI NDVI LAI Albedo NDBI NDSI DSI NDWI
60-90 N 0.53 + *** 0.57 + *** 0.41 + *** 0.79 - *** 0.41 + *** 0 0.53 - *** 0.63 - ***
30-60 N 0 0 0 0 0.61 + *** 0.36 + *** 0.63 - *** 0.7 - ***
0-30 N 0.51 - *** 0.56 - *** 0.32 - *** 0.48 + *** 0.58 + *** 0.6 + *** 0 0.51 - *** 0-30 S 0.25 - *** 0.28 - *** 0.35 - *** 0.6 + *** 0.48 + *** 0.61 + *** 0 0.61 - *** 30-60 S 0.17 - *** 0.16 - *** 0.16 - *** 0.12 + *** 0.46 + *** 0.35 + *** 0.28 - *** 0.49 - ***
Note: “+” is positive and “–“is inverse relationship. ***: p < 0.001
4- Discussions
The relationship between examined LULC indices and LST is statistically significant at the 0.001 level in both the global and continental scale. Based on the value of R squared, NDWI and DSI are the dominant drivers of LST at the global scale, Asia and North America. In
14
Relationship between albedo and LST is moderate inverse on a global scale. At the continental scale, this association is inverse in North America, Europe, however, it is positive in Africa, Australia and Central America meanwhile none relationship observed in South America. High albedo in some continents associated with low LST, however, associated with high LST in some others. In agreement with our result in Europe, the “inverse” linear relationship between LST and albedo confirmed in urban areas in central Italy using both remote sensing and in situ
measurements (Bonafoni et al., 2017).
At the global scale, Asia, Central and South America, none relationship observed between LST and examined remote sensing vegetation indices, namely, LAI, EVI and NDVI. This association is small positive in Europe between LST and EVI and NDVI. Moderate positive with EVI in North America and low positive with NDVI. This relationship is moderate inverse in Australia and strong or moderate inverse in Africa. The identified relationship between LST and examined vegetation indices is positive in Europe, North America (growing LST with increasing vegetation indices). This result is anticipated because the seasonal cycles of vegetation and temperature are in the same period (Schultz and Halpert, 1993). However, this relationship is inverse in Australia and Africa (decreasing LST with growing vegetation indices). An inverse relationship between NDVI and LST in Australia and positive relationship in high latitudes is consistent with results of Schultz and Halpert (1993). The interpretation is perhaps in cold areas, land decease its temperature faster than vegetation cover while in the warm and hot areas, evapotranspiration lead vegetation areas to have lower LST than non-vegetated areas.
The relationship between built-up and LST is strong at the global scale, Europe and North America while moderate in Asia and Africa but small in Central America, South America and Australia. All observed relationship between NDBI and LST are positive and built-up areas lead to increase LST in both the global and continental scale. In general, impervious surface materials increase LST. Strong positive correlation and strong positive relationship confirmed in the local studies between NDBI and LST (Chen et al., 2013; Malik et al., 2019; Zhang et al., 2009). However, some research in semi-arid areas recognized built-up lead to decrease LST in the local scale (Rasul et al., 2015) because the LST of surrounding bare soil rises more than LST of impervious materials.
Not association observed between bare soil and LST at the global scale, Europe, Asia, North America, and South America while this relationship is moderate positive in Australia and Africa, however, low positive in Central America. A high value of soil index is associated with high LST in Australia and Africa. In the regional scale, positive relationship between LST and barren land area was detected in an arid Potohar region in northeastern Pakistan (Tariq et al., 2019).
15
None relationship observed between snow index (DSI) and LST in Africa, Central America, it is very low in South America while low in Australia, however, strong in the world, Asia, North America, Europe. The identified relationship is inverse in all areas and high snow lead to decrease LST because of the high albedo of the snow. The influence of snow cover on LST is low or neglectable in tropical regions while as a result of increased snow cover in middle and upper latitudes, the influence of snow on LST is high.
Hence, our results implied that an increase in snow cover and water bodies could significantly decrease the surface temperature of any continent and region due to the
demonstrated inverse relation of DSI and NDWI with LST. In addition, increasing vegetation can reduce LST in Africa and Australia (not in all continents and at the global scale). However, increase built-up and barren areas usually increase surface temperature.
5- Conclusions
LST and LULC subject are the principal aspects of climate and environment studies. As a result of the complicity of surface and influence of many components, LST varies spatially and temporally. Therefore, the study aims to assess the spatial relationship between LST and remote sensing LULC indices at the global and continental scale.
MODIS Aqua day time LST and eight LULC MODIS indices of 2018 analysed and processed using Earth Engine Code Editor. Statistical calculations such as R squared and significance of the relationship between LST and LULC of values of randomly selected points conducted in R program. The research observed the relationship between examined LULC indices and LST is statistically significant at the 0.001 level. NDWI and DSI are the dominant drivers of LST in the world, Asia and North America. In Australia and Africa vegetation indices, namely, NDVI and EVI are the most dominant drivers. Albedo and NDSI have the superior among LULC indices in Central America. In South America and Europe, the dominant driver of LST is NDWI.
Relationship between albedo and LST is moderate inverse on a global scale. At the continental scale, this association is inverse in North America, Europe, however, positive in Africa, Australia, and Central America. At the global scale, Asia, Central and South America, none relationship observed between LST and examined vegetation indices. This association is positive in Europe and North America while inverse in Australia and Africa. All observed relationship between NDBI and LST are positive.
Not association observed between NDSI and LST in global level, Europe, Asia, North America, and South America while this relationship is positive in Australia, Africa and Central America. The relationship between water and LST is inverse in the world and all continents. None relationship observed between snow index and LST in Africa, Central America while this association is inverse in the world, South America, Australia, Asia, North America and Europe.
16
relationship is inverse with vegetation indices but positive with albedo in entire parts of the world. Observed relationships are positive with NDBI and NDSI in all different latitudes regions. While an observed relationship is an inverse with DSI and NDWI in all deferent latitudes areas. Our result is based on annual daytime MODIS LST and the relationship between LULC indices and LST perhaps different during nighttime and in different seasons.
References
Amiri, R., Weng, Q., Alimohammadi, A., Alavipanah, S.K., 2009. Spatial–temporal dynamics of land surface temperature in relation to fractional vegetation cover and land use/cover in the Tabriz urban area, Iran. Remote sensing of environment 113, 2606–2617.
Bajaj, D.N., Inamdar, A.B., Vaibhav, V., 2012. Temporal variation of Urban Heat Island using Landsat data: a case study of Ahmedabad, India, in: 33rd Asian Conference on Remote Sensing 2012, ACRS-2012. Asian Association on Remote Sensing, pp. 797–804.
Baker, L.A., Brazel, A.J., Selover, N., Martin, C., McIntyre, N., Steiner, F.R., Nelson, A., Musacchio, L., 2002. Urbanization and warming of Phoenix (Arizona, USA): Impacts, feedbacks and mitigation. Urban ecosystems 6, 183–203.
Bonafoni, S., Baldinelli, G., Rotili, A., Verducci, P., 2017. Albedo and surface temperature relation in urban areas: Analysis with different sensors, in: 2017 Joint Urban Remote Sensing Event (JURSE). Presented at the 2017 Joint Urban Remote Sensing Event (JURSE), pp. 1–4.
https://doi.org/10.1109/JURSE.2017.7924612
Chen, L., Li, M., Huang, F., Xu, S., 2013. Relationships of LST to NDBI and NDVI in Wuhan City based on Landsat ETM+ image, in: 2013 6th International Congress on Image and Signal Processing (CISP). Presented at the 2013 6th International Congress on Image and Signal Processing (CISP), pp. 840–845. https://doi.org/10.1109/CISP.2013.6745282
Chen, X.-L., Zhao, H.-M., Li, P.-X., Yin, Z.-Y., 2006. Remote sensing image-based analysis of the relationship between urban heat island and land use/cover changes. Remote sensing of environment 104, 133–146.
Clinton, N., Gong, P., 2013. MODIS detected surface urban heat islands and sinks: Global locations and controls. Remote Sensing of Environment 134, 294–304.
Didan, K., 2015. MYD13A1 MODIS/Aqua Vegetation Indices 16-day L3 Global 500m SIN Grid V006. Gao, B.-C., 1995. Normalized difference water index for remote sensing of vegetation liquid water from
space, in: Imaging Spectrometry. International Society for Optics and Photonics, pp. 225–236. Google, 2018. MODIS Aqua Daily NDWI [WWW Document]. Google Developers. URL
https://developers.google.com/earth-engine/datasets/catalog/MODIS_MYD09GA_006_NDWI (accessed 12.28.19).
Gorelick, N., Hancher, M., Dixon, M., Ilyushchenko, S., Thau, D., Moore, R., 2017. Google Earth Engine: Planetary-scale geospatial analysis for everyone. Remote Sensing of Environment, Big Remotely Sensed Data: tools, applications and experiences 202, 18–27.
https://doi.org/10.1016/j.rse.2017.06.031
Hall, D.K., G. A., R., 2016. MODIS/Terra Snow Cover Daily L3 Global 500m SIN Grid, Version 6.
Hegazy, I.R., Kaloop, M.R., 2015. Monitoring urban growth and land use change detection with GIS and remote sensing techniques in Daqahlia governorate Egypt. International Journal of Sustainable Built Environment 4, 117–124.
Ichii, K., Kawabata, A., Yamaguchi, Y., 2002. Global correlation analysis for NDVI and climatic variables and NDVI trends: 1982-1990. International journal of remote sensing 23, 3873–3878.
17
Liang, S., Shi, P., 2009. Analysis of the relationship between urban heat island and vegetation cover through Landsat ETM+: A case study of Shenyang, in: 2009 Joint Urban Remote Sensing Event. IEEE, pp. 1–5.
Malik, M.S., Shukla, J.P., Mishra, S., 2019. Relationship of LST, NDBI and NDVI using Landsat-8 data in Kandaihimmat Watershed, Hoshangabad, India. IJMS Vol.48(01) [January 2019].
Myneni, R., Y., K., T., P., 2015. MCD15A3H MODIS/Terra+Aqua Leaf Area Index/FPAR 4-day L4 Global 500m SIN Grid V006.
Oke, T.R., 1989. The micrometeorology of the urban forest. Philosophical Transactions of the Royal Society of London. B, Biological Sciences 324, 335–349.
Rasul, A., Balzter, H., Smith, C., 2017. Applying a normalized ratio scale technique to assess influences of urban expansion on land surface temperature of the semi-arid city of Erbil. International journal of remote sensing 38, 3960–3980.
Rasul, A., Balzter, H., Smith, C., 2015. Spatial variation of the daytime Surface Urban Cool Island during the dry season in Erbil, Iraqi Kurdistan, from Landsat 8. Urban climate 14, 176–186.
Rasul, A.O., 2016. Remote sensing of surface urban cool and heat island dynamics in Erbil, Iraq, between 1992 and 2013 (Ph.D.). University of Leicester.
Rogers, A.S., Kearney, M.S., 2004. Reducing signature variability in unmixing coastal marsh Thematic Mapper scenes using spectral indices. International Journal of Remote Sensing 25, 2317–2335. Schaaf, C., Z., W., 2015. MCD43A3 MODIS/Terra+Aqua BRDF/Albedo Daily L3 Global - 500m V006. Schultz, P.A., Halpert, M.S., 1993. Global correlation of temperature, NDVI and precipitation. Advances
in Space Research 13, 277–280.
Schwarz, N., Schlink, U., Franck, U., Großmann, K., 2012. Relationship of land surface and air
temperatures and its implications for quantifying urban heat island indicators—An application for the city of Leipzig (Germany). Ecological Indicators 18, 693–704.
Sumida, A., Watanabe, T., Miyaura, T., 2018. Interannual variability of leaf area index of an evergreen conifer stand was affected by carry-over effects from recent climate conditions. Scientific Reports 8, 13590.
Tariq, A., Riaz, I., Ahmad, Z., Yang, B., Amin, M., Kausar, R., Andleeb, S., Farooqi, M.A., Rafiq, M., 2019. Land surface temperature relation with normalized satellite indices for the estimation of spatio-temporal trends in temperature among various land use land cover classes of an arid Potohar region using Landsat data. Environ Earth Sci 79, 40. https://doi.org/10.1007/s12665-019-8766-2 Trenberth, K.E., 2004. Climatology (communication arising): rural land-use change and climate. Nature
427, 213.
Wan, Z., Hook, S., Hulley, G., 2015. MYD11A2 MODIS/Aqua Land Surface Temperature/Emissivity 8-Day L3 Global 1km SIN Grid V006.
Zha, Y., Gao, J., Ni, S., 2003. Use of normalized difference built-up index in automatically mapping urban areas from TM imagery. International journal of remote sensing 24, 583–594.
Zhang, Y., Odeh, I.O.A., Han, C., 2009. Bi-temporal characterization of land surface temperature in relation to impervious surface area, NDVI and NDBI, using a sub-pixel image analysis. International Journal of Applied Earth Observation and Geoinformation 11, 256–264. https://doi.org/10.1016/j.jag.2009.03.001