Research and development for accuracy improvement of
neutron nuclear data on minor actinides
Hideo Harada1,a, Osamu Iwamoto1, Nobuyuki Iwamoto1, Atsushi Kimura1, Kazushi Terada1, Taro Nakao1, Shoji Nakamura1, Kazuhito Mizuyama1, Masayuki Igashira2, Tatsuya Katabuchi2, Tadafumi Sano3, Yuji Shibahara3, Yoshiyuki Takahashi3, Koichi Takamiya3, Cheol Ho Pyeon3, Satoshi Fukutani3, Tosiyuki Fujii3, Jun-ichi Hori3, and Hiroshi Yashima3
1 Japan Atomic Energy Agency, Nuclear Science and Engineering Center, Tokai, Naka, Ibaraki 319-1195, Japan 2 Tokyo Institute of Technology, Laboratory for Advanced Nuclear Energy, O-okayama, Meguro, Tokyo 152-8550, Japan 3 Kyoto University, Research Reactor Institute, Kumatori, Sennan, Osaka 590-0494, Japan
Abstract. To improve accuracy of neutron nuclear data on minor actinides, a Japanese nuclear data project entitled “Research and development for Accuracy Improvement of neutron nuclear data on Minor ACtinides (AIMAC)” has been implemented. Several independent measurement techniques were developed for improving measurement precision at J-PARC/MLF/ANNRI and KURRI/LINAC facilities. Effectiveness of combining the independent techniques has been demonstrated for identifying bias effects and improving accuracy, especially in characterization of samples used for nuclear data measurements. Capture cross sections and/or total cross sections have been measured for Am-241, Am-243, Np-237, Tc-99, Gd-155, and Gd-157. Systematic nuclear data evaluation has also been performed by taking into account the identified bias effect. Highlights of the AIMAC project are outlined.
1. Introduction
For the study of nuclear transmutation systems, accurate nuclear data are indispensable [1–3]. As an example, sensitivity and uncertainty analysis has been performed [4,5] recently for the accelerator-driven system (ADS) proposed by the Japan Atomic Energy Agency (JAEA) using the covariance of JENDL-4.0 [6]. The impact of improving accuracy of relevant nuclear data was quantitatively shown. According to the investigation, capture cross sections of minor actinides (MAs) are among the most important data. To improve accuracy of capture cross sections of MAs, a Japanese nuclear data project entitled “Research and development for Accuracy Improvement of neutron nuclear data on Minor ACtinides (AIMAC)” has been performed since October 2013 [7]. The AIMAC project focuses not only on the fast neutron region but also thermal and resonance energy regions, since both of them are important for normalization of energy dependent data measured by a TOF method.
Recently, high quality energy dependent data on capture cross sections of MAs have been measured at J-PARC/ANNRI [8–10], LANL/DANCE [11,12], CERN/n TOF [13,14] et al. Resonance analysis of neutron total cross section has also been used to deduce a capture cross section at JRC-Geel/GELINA [15]. Since statistical uncertainty of neutron time-of-flight data has been decreased drastically owing to high-intensity pulsed neutron beam produced by a spallation reaction, determination of absolute value of energy dependent data is becoming a key issue for improving the accuracy.
ae-mail:[email protected]
International activity by OECD/NEA for improving the accuracy has been also going on [16].
For accurate determination of the absolute value, it is important to develop high-precision measurement techniques, identify un-recognized bias effects, and correct the effects precisely. In the AIMAC project, plural independent measurement techniques have been developed in order to make cross-checks of the measurements, and to recognize bias effects that are difficult to be identified by a sole measurement technique. Finally, all of available experimental data are re-evaluated with systematic corrections of identified bias effects.
The actions of the AIMAC project are summarized as follows:
– Precise characterization of sample
– Activation measurement method at KURRI/LINAC
TOF facility
– TOF measurement method at J-PARC/ANNRI and
KURRI/LINAC facilities
– Re-evaluations with systematic corrections.
Highlights of the above actions are summarized in this paper. Details of each achievement are described in each contributing papers.
2. Highlights of AIMAC project
2.1. Precise characterization of sample
Accurate determination of absolute sample amount is important for cross section measurements. In the case of the sealed241Am sample previously used at ANNRI [10], the uncertainty of the sample amount was not given.
0.0 0.2 0.4 0.6 0.8 1.0
238 239 240 241 242 243 244 245 246 247 248 249
Relat
iv
e
intensit
y
Atomic mass
Figure 1. Mass spectrum of243Am material measured by TIMS.
Table 1. Isotopic ratio measurement of the243Am material.
Isotopes Declared ratio mass spectroscopy
241Am 2.7% 2.29±0.03% 243Am 97.3% 97.71±0.03%
Therefore, only energy dependence of capture cross section has been determined [10]. In the AIMAC project, two sealed samples of 241Am (480 and 950 MBq) and three sealed samples of 243Am (60, 120, 240 MBq) have been prepared. Althoughγ-ray intensity for each sample is declared in the specification sheets, its uncertainty is as large as 10%. For precise characterization, small amounts (130 kBq of 241Am and 10 kBq of 243Am) of the same materials used for fabricating these sealed samples have been prepared for destructive analyses by mass spectroscopy andα-ray spectroscopy. To determine absolute amounts of the sample, several precise non-destructive methods have also been developed, that is, micro calorimetry and γ-ray spectroscopy. Effectiveness of synthesized analyses obtained by the developed independent techniques is shown.
2.1.1. Isotopic ratio measurement by mass spectroscopy
The isotopic ratios of Am in the prepared 241Am and 243Am materials were measured by TIMS [17]. The isotopic purity of 241Am material was verified by the TIMS: impurity level is less than 5ppm. On the other hand, isotopic impurity of 241Am in the 243Am material is significant. Figure 1 shows a relative intensity of Am isotopes in the 243Am material. A peak corresponding to 241Am is clearly shown together with a prominent243Am
peak. The measured isotopic ratio is shown in Table1. It is remarkable that extremely high precision data is obtained by this mass spectroscopy. Details of the spectroscopic techniques are described in [18].
2.1.2. Characterization of sample materials by αspectroscopy
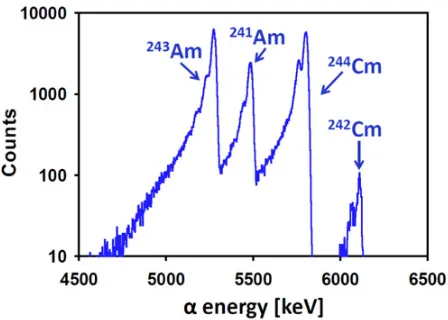
The same 243Am material has been analysed by α spectroscopy. Figure2clearly shows not only241Am and 243Am but also242Cm and 244Cm. Since the half-lives of
these Cm isotopes are shorter than those of Am isotopes, peaks of Cm isotopes are significant although Cm amount is much smaller than that of Am. The quantified amounts of Cm isotopes are indispensable for analysis of micro calorimetry [18] described in 2.1.4.
Figure 2.αspectrum of243Am sample material.
Table 2. Summary of quantified sample activities. Declared γ-ray micro Sample ID activity spectroscopy calorimetry
[MBq] [MBq] [MBq]
241Am #1 480 511±10 510.7±0.5 241Am #2 950 962±19 957.4±0.5 243Am #1 60 66.7±1.3 67.3±0.3 243Am #2 120 155±3 155.8±0.3 243Am #3 240 286±6 281.8±0.3
2.1.3. Absolute amount measurement by γ-ray spectroscopy
The absolute MA amounts in the MA samples could be determined by measuring decayγ-rays escaping from the sealed samples. Gamma rays emitted from the samples were measured with a planar type High-Purity Germanium (HPGe) detector. An efficiency curve of the HPGe detector was determined with uncertainties less than about 1% by combining measured efficiencies and Monte Carlo simulation. This method was originally developed in [19]. The γ-ray emission probabilities for the majorγ rays of relevant nuclides were determined with uncertainties less than 1.2% [20].
The sample amounts deduced using the efficiency and theγ-ray emission probabilities are determined with uncertainty of about 2%. The results are summarized in Table 2, together with those determined by micro calorimetry described in 2.1.4 [21].
2.1.4. Absolute amount measurement by micro calorimetry
A high-performance calorimeter TAM VI (Thermometric AB, Sweden) was utilized to measure decay heat from a sealed sample. Since the Q-values and half-lives of 241Am and 243Am isotopes are well known with high
0.05–0.1%. In case of 243Am samples, the achieved precision was about 0.1-0.5% because of correction uncertainty of Cm. Contamination of Pu isotopes needs to be checked before obtaining final results, although its contribution is expected to be small [18,21].
2.2. Activation measurement method at KURRI TOF facility
A neutron activation method has been developed in the neutron target room at KURRI electron linear accelerator facility. This compact facility has been used for cross section measurements using a neutron TOF technique. Neutrons are produced via a photonuclear reaction by the pulsed electron beam. The neutron producing target is set in the water tank as shown in Fig.3. Neutrons thermalized in the tank are used for irradiating a sample set near the tank.
There are important advantages compared to measure-ments using research reactors as below:
− Energy dependence of neutron flux is determined experimentally using a TOF technique.
− Neutron energy spectrum is varied by adjusting the amount of boric acid in the water tank.
Activation measurements have been performed using unsealed 237Np samples. Neutron flux at the sample position was monitored using thin Au foils. It was shown that enough amount of 238Np was produced for capture cross section determination: statistical uncertainty is less than 1%. Details of the activation techniques are described in [22]. Unsealed 241Am and 243Am samples have also been measured, and the analyses is ongoing.
2.3. TOF measurement methods at J-PARC/ANNRI and KURRI/LINAC
2.3.1. Capture cross sections of155,157Gd at J-PARC/ANNRI
For absolute determination of capture cross sections, a new method was developed and applied to155,157Gd [23]. This method does not need precise values on neutron flux nor detector efficiency, but needs only a ratio of capture yields for two different thickness samples. This method is applicable in the case that the ratio of capture cross section to total cross section can be approximated by one. Figure 4 shows a part of the capture cross section of 157Gd determined by this method, together with that of
JENDL-4.0 [6]. The obtained data is fitted by introducing a negative resonance in resonance analyses. Details of the resonance analyses are described in [24].
2.3.2. Capture cross sections of241,243Am at J-PARC/ANNRI
Capture cross sections of 241,243Am have been measured using the Ge spectrometer at J-PARC/ANNRI. The samples with different thickness have been used for both 241Am and243Am measurements. All of the samples are
precisely characterized by the methods as described in 2.1. The neutron pulse at J-PARC/MLF has been generated in a double bunch mode: the time interval between two bunches is about 600 ns [25]. This made data analyses of ANNRI very complicated. During the measurement period
Moderator tank Sample for
Irradiation
Figure 3. A photograph of activation measurement setup installed in the neutron target room at KURRI-LINAC facility.
Neutron Energy [eV]
1 . 0 1
0 . 0
Captu
re
Cross
Sec
ti
o
n
[b]
0 100000 200000 300000 400000
157
Gd
Kimura at J-PARC/ANNRI JENDL-4.0
Figure 4. A low energy part of capture cross section of157Gd
measured at J-PARC/ANNRI and JENDL-4.0.
of the AIMAC project, J-PARC has been operated by a single-mode. Figure 5 shows capture yields as a function of neutron energy obtained for a 243Am measurement as an example. As a result, the double-bunch time structure is not observed in the figure, and resonance peaks are clearly shown even at around 100 eV.
To deduce capture cross sections from the data, neutron self-shielding and multiple-scattering effects in a sample need to be corrected. The combinational use of capture yields measured for different thickness samples is expected to enable a cross-check of the correction factor.
2.3.3. Total cross section measurements of Am at J-PARC/ANNRI
Neutron Energy [eV]
1 10 100
Capture Y
iel
ds /
sh
ot /
b
in
0.00000 0.00002 0.00004 0.00006 0.00008 0.00010
243
Am
Background
Figure 5. Capture yields for a243Am sample measured by the Ge
spectrometer at J-PARC/ANNRI with single-bunch mode.
Figure 6. A photograph of neutron detectors installed in the J-PARC/ANNRI for neutron transmission measurements.
6Li-glass scintillator. These detectors are set at about
45-degree angle to the neutron beam axis as shown in Fig.6. The developed DAQ system is designed to process signals from both the installed neutron detectors and the Ge spectrometer. The charge-sensitive ADC module of CAEN (model v1720, 12-bit, 250-MHz) is used for processing signals of neutron detectors. The peak-hold ADC boards of CAEN (model v1724, 14-bit, 100-MHz) is used for processing signals of the Ge spectrometer. Details on the performance of the DAQ system are described in [26].
Figure 7 shows a neutron transmission spectrum measured for a 241Am sample (957.4± 0.5 MBq) using the developed neutron detection system. This is the first neutron transmission data for a MA sample at J-PARC/ANNRI. Since the ratio of capture cross section to total cross section is nearly one at low energy region, the data will be usefully used for cross-checking with the capture data on241Am.
2.3.4. Extension of energy region of capture cross section above 100 keV at J-PARC/ANNRI
In order to extend the measurable energy region of capture cross section at ANNRI from 100 keV to more than 300 keV, the data-taking system developed for the ANNRI-NaI spectrometer has been upgraded. Furthermore, a neutron shield tube has been installed at the sample position to reduce neutron background [27].
The measured neutron capture cross section of 99Tc is shown in Fig. 8. It is noticeable that the measurable
Neutron Energy [eV]
0.2 0.4 0.6 0.8 1.0 1.2
Neut
ron Tr
a
n
s
m
is
si
on
0.80 0.85 0.90 0.95 1.00
241
Am
Figure 7. Neutron transmission spectrum of241Am.
Neutron Energy [eV]
104 105 106
Capture Cross Section [b] 0.1 1
99
Tc
Figure 8. Neutron capture cross section of99Tc measured using
the NaI spectrometer at J-PARC/ANNRI.
energy region is successfully extended from 100 keV up to about 800 keV. Details of the measurement techniques are described in [28].
2.3.5. TOF measurements at Kyoto/LINAC
A 4πBGO spectrometer has been developed and installed at the 10 m flight-path area in the KURRI-LINAC facility for capture cross section measurements as shown in Fig. 9. A DAQ system is also developed to process signals from the spectrometer. The high-speed digitizer of Agilent Technology (model M9210A, 10-bit) is used for processing signals of BGO detectors.
The capture cross section of237Np has been measured using the BGO spectrometer [22]. The samples with different thickness have been used to enable cross-check of the correction factor of neutron self-shielding and multiple-scattering effect in the sealed237Np samples. For resonance analyses, the neutron pulse resolution function of this facility has been investigated based on Monte Carlo calculations. Details of the simulation techniques are described in [29].
2.4. Re-evaluation with systematic corrections
2.4.1. Evaluations of capture cross sections for the thermal neutron region
Figure 9. A photograph of 4πBGO spectrometer installed in the KURRI-LINAC facility.
TOF channel
400 600 800 1000 1200
Rel
a
ti
v
e
Ca
pt
ur
e
Yi
e
lds
0.0 0.1 0.2 0.3 0.4
26 MBq 5 MBq 1 MBq
237
Np
Figure 10. Capture yields for three237Np samples measured by
the BGO spectrometer at KURRI/LINAC.
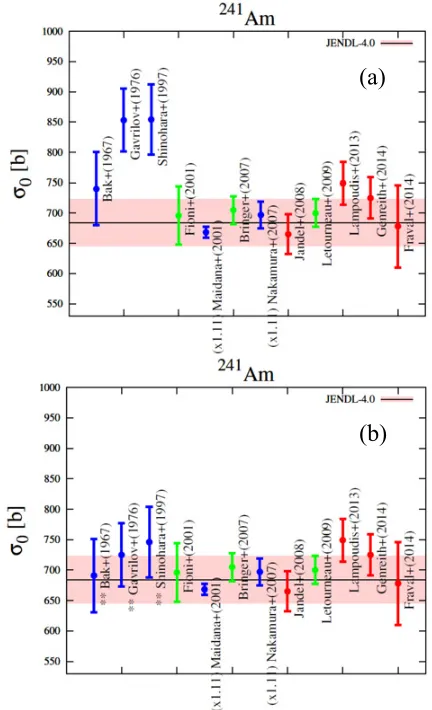
a research reactor [30–32]. In order to separate thermal neutrons from epi-thermal neutrons, a Cd cut-off method has been applied. The Cd cut-off energy is typically about 0.5 eV. In the case of MAs, large resonances are located just near the cut-off energy. In order to deduce thermal capture cross sections accurately, the reaction rate near the Cd cut-off energy needs to be evaluated carefully. Some of the old measurements did not take into account this effect. Recently, systematic corrections have been performed using the identified systematic bias effect [33,34]. An example of the systematic correction performed in the AIMAC project on 241Am is shown in Fig. 11 (data in upper graph is before correction, and that in lower after correction). The limited data are corrected where enough information is given for the correction. The other type of measurememnts are also shown in the same figure for comparison. It is remarkable that the dispersion of data is drastically reduced after this systematic correction.
2.4.2. Evaluations of capture cross sections for fast neutron region
In order to evaluate capture cross sections for fast neutron region, statistical model calculations have been performed. For the calculation, resonance parameters are re-evaluated. Statistical model parameters used for the calculation are also adjusted using available total cross section, capture
(a)
(b)
Figure 11. Capture cross section of241Am for thermal neutrons,
before (a) and after (b) the systematic correction described in the text.
Figure 12. Promptγ-ray spectrum for neutron capture reaction of99Tc.
cross section, and prompt γ-ray yields. Figure 12shows calculated and experimental promptγ-ray yields [35] as an example of the evaluation. Details of the evaluation on capture cross sections and the developed methodology are described in [36].
3. Conclusions
are developed for improving measurement precision at J-PARC/MLF/ANNRI and KURRI/LINAC facilities. Some of the newly developed techniques are shown to improve precision drastically. Effectiveness of combining the independent precise techniques is shown for identifying bias effects and improving accuracy. Importance of systematic re-evaluation with corrections of the identified bias effects is also demonstrated.
The present study includes the result of “Research and Development for accuracy improvement of neutron nuclear data on minor actinides” entrusted to the Japan Atomic Energy Agency by the Ministry of Education, Culture, Sports, Science and Technology of Japan (MEXT). HH deeply appreciates valuable discussions with P. Schillebeeckx.
References
[1] H. Harada, T. Baba, M. Igashira, H. Yamana, S. Raman, J. Nucl. Sci. Technol. Sup. 2, 366 (2002) [2] M. Salvatores et al., WPEC-26, OECD/NEA (2008) [3] H. Harada, et al., WPEC-31, OECD/NEA (2014) [4] H. Iwamoto, K. Nishihara, T. Sugawara,
K. Tsujimoto, J. Nucl. Sci. Technol. 50, 856 (2013)
[5] H. Iwamoto, K. Nishihara, R. Katano, K. Tsujimoto, JAEA-Research 2014-033 (2014)
[6] K. Shibata, O. Iwamoto, T. Nakagawa, et al., J. Nucl. Sci. Technol. 48, 1 (2011)
[7] H. Harada, O. Iwamoto, N. Iwamoto et al., EPJ Web of Conferences 93, 06001 (2015)
[8] A. Kimura, T. Fujii, S. Fukutani, et al., J. Nucl. Sci. Technol. 49, 708 (2012)
[9] K. Hirose, K. Furutaka, K.Y. Hara, et al., J. Nucl. Sci. Technol. 50, 188 (2013)
[10] H. Harada, M. Ohta, A. Kimura, et al., Nucl. Data Sheets 119, 61 (2014)
[11] E-I. Esch, R. Reifarth, E.M. Bond et al., Phys. Rev. C
77, 034309 (2008)
[12] M. Jandel, T.A. Bredeweg, E.M. Bond et al., Phys. Rev. C 78, 034609 (2008)
[13] K. Fraval, F. Gunsing, S. Altstadt et al., Phys. Rev. C
89, 044609 (2014)
[14] E. Mendoza, D. Cano-Ott, C. Guerrero et al., Phys. Rev. C 90, 034608 (2014)
[15] L. Lampoudis, S. Kopecky, O. Boulamd et al., Euro. Phys. J. Plus 128, 86 (2013)
[16] https://www.oecd-nea.org/science/wpec/ sg41/
[17] Y. Shibahara, et al., J. Radioanal. Nucl. Chem. 307, 2281 (2016)
[18] Y. Shibahara, et al., to be published in Proc. of ND2016 (S301)
[19] R.G. Helmer, J.C. Hardy, V.E. Iacob, et al., Nucl. Instru. Meth. A 511, 913 (2003)
[20] K. Terada, S. Nakamura, T. Nakao, et al., to be published in J. Nucl. Sci. Technol., doi: 10.1080/00223131.2016.1174167 (2016)
[21] K. Terada, et al., to be published in Proc. of ND2016 (R300)
[22] Y. Takahashi, H. Yashima, et al., to be published in Proc. of ND2016 (S033)
[23] A. Kimura et al., in preparation
[24] K. Mizuyama, et al., to be published in Proc. of ND2016 (S114)
[25] K. Kino, M. Furusaka, F. Hiraga, et al., Nucl. Instru. Meth. A 736, 66 (2014)
[26] T. Nakao, et al., to be published in Proc. of ND2016 (R130)
[27] T. Katabuchi, T. Matsuhashi, T. Terada, et al., Nucl. Instru. Meth. A 764, 369 (2014)
[28] T. Katabuchi, et al., to be published in Proc. of ND2016 (S111)
[29] T. Sano, et al., to be published in Proc. of ND2016 (S055)
[30] C.H. Westcott, W.H. Walker, T.K. Alexander, Proc. 2nd Int. Conf. Peaceful Uses of Atomic Energy, Geneva 16, 70 (1958)
[31] H. Harada, S. Nakamura, T. Katoh, Y. Ogata, J. Nucl. Sci. Technol. 32, 395 (1995)
[32] S. Nakamura, M. Ohta, H. Harada, et al., J. Nucl. Sci. Technol. 43, 1500 (2007)
[33] G. Zerovnik, B. Becker, T. Belgya, et al., Nucl. Instru. Meth. A 799, 29 (2015)
[34] K. Mizuyama, N. Iwamoto, O. Iwamoto, published online in J. Nucl. Sci. Technol. (2016)
[35] T. Matsumoto, M. Igashira, T. Ohsaki, J. Nucl. Sci. Technol. 40, 61 (2003)