Electric Power Supply Network Management
Using GIS Solution
A.Balamurugan 1, Saravanaraja.K 2, G.Ramakrishnaprabu3
Asst. Professor, Department of EEE, VMKV Engineering College, Salem, Tamilnadu, India1
P.G. Student, Department of EEE, VMKV Engineering College, Salem, Tamilnadu, India 2
Associate Professor, Department of EEE, VMKV Engineering College, Salem, Tamilnadu, India3
ABSTRACT: Our paper deals Electrical Utility Network is the most generic term in the case of electrical transmission network, concerned in GIS environment. The network gets started from the source and ends with sink. The source is the generation point of electricity and the sink is the end point may be an industry / a small house where the energy is best utilized. This electric utility network is an energy process flow in which it begins with the source, distributed through grid and transmitted to the ends by using transformers and gets connected by cables for its energy transfer. The role of GIS is to spatially map the entities, to make the whole process in real time and share the data across all verticals using Arc GIS or Quantum GIS. Analyze the distribution transmission lines and mapping using GIS technique.
KEYWORDS:GIS; Distribution network, Mapping, fault location, Line losses I. INTRODUCTION
GIS- based distribution network fault location algorithm, which greatly improve the distribution system fault locating efficiency, and ensure the distribution network of safe, reliable operation. The distribution network fault location is when the Distribution network after a failure to quickly and accurately locate the point of failure and regional, in order to be able to Quickly fault segment area isolation, while a non- fault Segment of the region to restore power. The importance of mapping things into GIS environment / setup is to provide spatial solutions in a real time manner. The major problems identified in this energy sector were
1) Frequent p o w e r failure due t o natural disaster (excessive precipitation, lightning, etc), 2) Unequal transmission of load.
3) Rupture on the equipments due to the improper maintenance.
All the equipments involved in electric transmission network have got some limited time period on its durability. Periodic change on these equipments is necessary to maintain the standards in electrical network. So spatially managing these with temporal dimension involved will pave way for the system to automatically denote / trigger / tell about the time limit for each and every equipment automatically within a threshold time limit and thereby decreasing the frequent power failures involved in an electrical network.
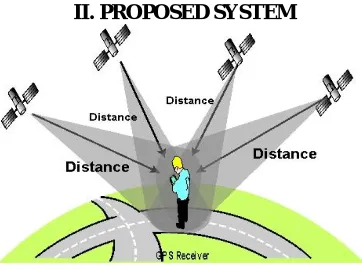
II. PROPOSED SYSTEM
Fig 1 Proposed System
Mapping these features and spatially locating these feature in system and to make it readily available or keeping it shared across the networks is the immediate need of the hour. The importance of mapping things into GIS environment / setup is to provide spatial solutions in a real time manner
A GIS database can be created as follows [2]:
Step 1: Locate equipment by GPS or map area.
Step 2: Ratings or specifications of equipment are given.
Step 3: Topology of network and modelling in GIS is performed. Step 4: Add area map to GIS software.
All the equipments involved in electric transmission network have got some limited time period on its durability. Periodic change on these equipments is necessary to maintain the standards in electrical network. So spatially managing these with temporal dimension involved will pave way for the system to automatically denote / trigger / tell about the time limit for each and every equipment automatically within a threshold time limit and thereby decreasing the frequent power failures involved in an electrical network. To reach the equipment / to find the exact fault wherein it has occurred could be substantiated presently only by line patrolling through man power. The notified location on the identified network wherein the fault has occurred could not be easily identified and asked for the first responders to act / go to the exact area and rectify the problem immediately
A) GIS APPLICATION IN MAPPING OF NETWORK AND CONSUMERS
GIS technology can be effectively used for correct marking of the jurisdiction various Distribution Circles on Geographical Area Map. GIS mapping of Sub- transmission and Distribution network from 33 kV substations down to LT feeders becomes handy in proper identification, locating and documenting of electrical network assets. All the existing connections and consumer details can be graphically displayed on the GIS map linked to the database. The mapping of electrical network on GIS base maps and linking with the indexed consumer database is a multi-step process.
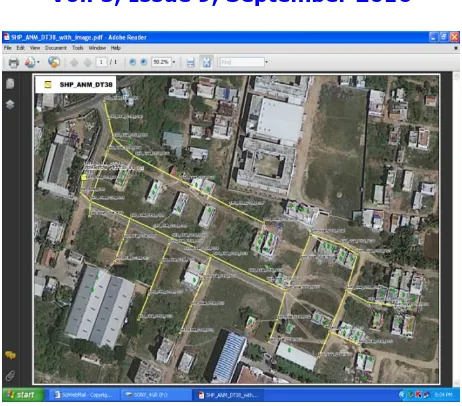
Fig 2 View – 01 (LT ASSET MAPPING & CONSUMER MAPPING)
The location coordinates (Latitude-Longitude) of every consumer and electrical network element, from 110/22 KV sub-station through 22 KV feeder down to DT and the nearest LT service pole has been plotted on GIS map, with the following features:
All the network elements are identified and a database developed to record all the technical attributes of the network element.
All the network assets have a unique identification number. The network database has a linkage with consumer database.
The network database is having a GUI interface where all the child components are shown as subset of the parent. When a parent is selected the entire child components can be seen in the left pane. The graphical symbol of the parent component is shown as expandable.
In case of network reconfiguration where some components are electrically connected to a new parent component, then all such child components can be selected in the left pane can be dragged and dropped to be new parent component. The database gets immediately modified to show new electrical connectivity.
B) MAPPING AND INDEXING OF ELECTRICAL CONSUMERS
The purpose of GIS Mapping and Indexing of the consumers is to identify and locate all the consumers on geographical map, which are being fed from the Distribution Mains. There may be cases where electric connection exists but it does not exist in the utility's record. It may be a case of unauthorized connection or non-slenderized connection. On the other hand, there may be cases where a connection exists in the utility's record, but it may not exist physically at site. Following reasons could be attributed for such anomalies:
1. The connection might have been disconnected long back but the record may not have been updated. 2. It may be a case where the address and other details of the consumers are not correctly recorded.
C) MAPPING AND DOCUMENTATION OF ELECTRIC NETWORK
The complete electrical network and network route are digitized and mapped on a suitable scale over the base map, using suitable GIS software, so that the changes in the network can be timely and correctly updated on a periodic basis. Through software application, queries can be generated to find out the network details like the make and specifications of network elements, the length of feeders and LT conductors, number of transformers and breakers on any section of the network. The network database should have the important details of 110/22 KV substations, 22KV feeders, Distribution Transformers and LT lines.
Fig 3 View 2(HT ASSET MAPPING & CONSUMER MAPPING)
The purpose of GIS Mapping and Indexing of the consumers is to identify and locate all the consumers on geographical map, which are being fed from the Distribution Mains. There may be cases where electric connection exists but it does not exist in the utility's record. It may be a case of unauthorized connection or non-slenderized connection. On the other hand, there may be cases where a connection exists in the utility's record, but it may not exist physically at site. Following reasons could be attributed for such anomalies:
1. The connection might have been disconnected long back but the record may not have been updated. 2. It may be a case where the address and other details of the consumers are not correctly recorded.
Using GIS, the LT lines coming out from Distribution Transformer and all service connections from the LT mains can be checked with reference to the consumers connected and accordingly the consumer database can be updated.
D) FEEDER-WISE AND DISTRIBUTION TRANSFORMER-WISE CONSUMER SEGREGATION
To identify the areas of high losses, it is essential to segregate the energy input and consumption Distribution Transformer-wise and 22 KV feeder-wise. The losses are assessed by subtracting the total energy utilization of the consumers from the energy supplied to the respective Distribution Transformer and 22 KV Feeder. Using GPS-based survey of 22 KV feeders, DTs and LT poles, the connected consumers can be identified on the GIS map and segregated Distribution Transformer-wise and 22 KV feeder-wise.
F) LINE LOSSES AND POWER FACTOR
1. Evaluate 22 KV, and LT feeder-wise technical losses
2. Identify the network section overloaded or having high technical losses
3. Identify the area of unbalanced loading of Distribution Transformer and LT Network and take corrective action to minimize technical loss and achieve Optimum utilization of transformer's capacity.
4. Work out voltage regulation of the network and identify the areas having high voltage drops and suffering with low voltage problem.
Based on the above information, alternate arrangement of supply to important areas can be made in case of outage of part of existing feeding network. Also, augmentation of the network can be effectively planned to cater for the increase in projected load.
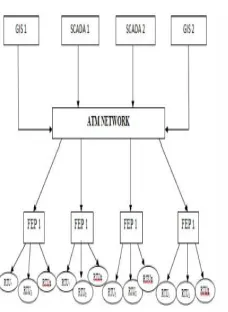
III. INTEGRATION OF GIS – SCADA
Fig 4 Integration of GIS – SCADA Using ATM Network
Fig 5 Fault Analysis by using GIS Technology
Step 1: Installation of map server
Step 2: After installation the coding is given to the map server
Step 3: Installation of GIS template and shaping the file by using SQL command prompt Step 4: Creates start and end Geometry for shaping the selected file
Step 5: After SQL command the geometry map will be developed in HTML document.
Basic Syntax Used in MapServer : MAP LAYER1 LAYER2 CLASS STYLE END CLASS END LAYER2 END LAYER1 END MAP END
Run the map in local host and execute it in the browser window using the below URL: http://localhost/cgi-bin/mapserv.exe?map=C:\ms4w\Apache\htdocs\shp\testchi.map&mode=map
IV. RESULTS WITH DISCUSSIONS
SL Name of the feeder Anticipated length in KM
Anticipated CL in MVA
Anticipated peak in MVA
Expected regulation
Line loss after imp in LU
1 Kolathukombai I 16.931 7.402 15.24 7.63 270200.00
2 Kolathukombai II 11.454 3.539 8.29 3.94 290751.00
Table 1. Expected Voltage regulation with Line Loss
S.No Name of the SS
Name of the feeder
Connected load in KVA
Voltage Regulation
with 1.5 DF Line loss in Lakhs (units)
Line loss saving in
LU
Existing Proposed Existing Proposed Existing Proposed
1 Mettupatty -110 /22 KV -SS Kolathu kombai---22 KV # 14943 2483 16.5000 1.3800 1236934 20492 1216442
2 Minnampalli-110/22 KV -SS kolathukombai I-22KV # 0 7402 0.0000 7.6300 0 270200 -270200
3 Minnampalli-110/22 KV -SS kolathukombai I-22KV # 0 3539 0.0000 3.9400 0 290751 -290751
Table 2 . Actual Voltage Regulation with Line Loss Saving
Before GIS Implementation After GIS Implementation
The HT line Regulation has not been calculated easily and not maintained within the norms
The HT Regulation has been calculated easily and maintained within the norms
Difficult to identify the HT LT pole location, DT and not to control overload Distribution Transformer. Fuse of call to be attend slowly
Easy to identify the HT LT pole location. Avoid overload Distribution Transformer and locate the new DT at load centre point. Fuse of call to be attend slowly
The damaged pole and snapped conductor are difficult to identify there more chance to happen Fatal and Non fatal accident. the fault trips are frequently happened
The damaged pole and snapped conductor are easily identify there more less chance to happen Fatal and Non fatal accident. .the fault trips are happened rarely
The maintenance and operation cost is high due to it requires high man power. this results having less efficiency
Due to Computer technique it requires less man power and operational cost. this results having High efficiency
V. CONCLUSION
The Web based Geographical Information System (GIS) is not limited to a certain Science or unique technology, but it has very extended branches of usage in a lot of the daily activities.GIS technology has the ability to manage the information and represents it with various maps which allow for users to interact with it completely. GIS provides us to show all accumulated data which are stored in any format for long time as visible layers linked between location data and attributes.GPS has three main components; the satellite system, the control system, and the end users. Distribution networks are typically of two types, radial or interconnected. A radial network leaves the station and passes through the network area with no normal connection to any other supply and interconnected network is generally found in more urban areas and will have multiple connections to other points of supply. Our future perspective is to integrate this Electric Network Utility of GIS with SCADA to really simulate the real time flow of the energy across the networks, and which is aimed to be kept in server environment for any time any where identification and demarcation of any effect in the system / energy flow at any junctions across the networks. On integration with SCADA we could also provide diversified solutions in this electrical utility network sector.
REFERENCES
1. Daya Nand Pant (2000) all “Forest Vegetation / Landuse Change Detection and Impact Assessment
2. In Part of Western Himalaya” International Archives of Photogrammetry and Remote Sensing. Vol.33, Pp : 1111 – 1118
3. Gopalakrishnan K.S (1997), et all ”Land Cover Change Detection – Kodayar River Basin, Western Ghats Region of Kanyakumari District, India”, The National Geographical Journal of India, Vol. 46,No 1-4, Pp: 93 – 98.
4. Kavitha.N, (2008), all “Landuse / Land Cover Changes in Nellore District”, The Indian Geographical Journal. Vol. 82, No 1, Pp: 60 – 66.
5. Nayak.S and Behera.M D, (2009), “Land Use / Land Cover Classification and Mapping of Pilibhit District, Uttra Pradesh, India”, the Indian Geographical Journal, Vol. 83, No 1, Pp: 15 – 24.
6. Prakasam.C (2010) “Land use and land cover change detection through remote sensing approach: a case study of Kodaikanal taluk, Tamilnadu” The International Journal of Geomatics and Geoscience, Vol. 1, No 2, Pp: 150 – 158.
7. Punithavathi .J (2010)et all “Changes In The Cropping Pattern, Crop Concentration, Agricultural Efficiency In Papanasam Taluk, Thanjavur District, Tamil Nadu, India” Recent Research in Science and Technology, Vol 2, No . 2 Pp: 01-07