Article
1
What Proportion Counts? Disaggregating Access to
2
Safely Managed Sanitation in An Emerging Town in
3
Tanzania
4
Hans C. Komakech 1,*, Francis Moyo 1, Oscar Veses Roda 2, Revocatus L. Machunda 1, Om P.
5
Gautam 4, Kyla M. Smith 4 and Sandy Cairncross 3
6
1 The Nelson Mandela African Institution of Science and Technology, Arusha Tanzania
7
2 University of Leeds, Leeds, United Kingdom;
8
3 London School of Hygiene and Tropical Medicine, Keppel St, London, UK
9
4 WaterAid, London, UK
10
* Correspondence [email protected]
11
Abstract: Sustainable Development Goal (SDG) 6.2 sets an ambitious target of leaving no one
12
without adequate sanitation by 2030. The key concern is the lack of local human and financial capital
13
to fund the collection of reliable information to monitor progress towards the goal. As a result,
14
national and local records may be telling a different story of the proportion of safely managed
15
sanitation that counts towards achieving the SDGs. This paper unveils such inconsistency in
16
sanitation data generated by urban authorities and proposes a simple approach for collecting
17
reliable and verifiable information on access to safely managed sanitation. The paper is based on a
18
study conducted in Babati Town Council in Tanzania. Using a smartphone-based survey tool, city
19
health officers were trained to map 17,383 housing units in the town. A housing unit may comprise
20
of two or more households. The findings show that 5% practice open defecation, while 82% of the
21
housing units have some forms of sanitation. Despite the extensive coverage, only 31% of the faecal
22
sludge generated is safely contained, while 64% is not. This study demonstrates the possibility of
23
using simple survey tools to collect reliable data for monitoring progress towards safely managed
24
sanitation in the towns of global south.
25
Keywords: small towns; mapping; urban sanitation; access; SDG; Tanzania
26
27
1. Introduction
28
The United Nation’s Sustainable Development Goal (SDG) 6.2 designates the year 2030 as the
29
‘finish line’ for low-income countries to ‘achieve access to adequate and equitable sanitation and
30
hygiene for all’ [1]. It also aims to end open defecation and pays special attention to the needs of
31
women and girls including people in vulnerable situations [2]. Since 2015, the race to meet this goal
32
has seen increased governments’ eagerness to gather sanitation information to inform national
33
policies and interventions [3]. Some experts, however, see the SDGs to be an overly ambitious target
34
for many African countries. The critics point at the lack of human and financial capital to fund
35
sanitation investments and limited state capacity to collect reliable information required to measure
36
success and monitor progress as the main impediments for African countries to achieve Goal 6.2 [2].
37
38
In Tanzania, for example, most towns do not have reliable baseline data on access to sanitation
39
facilities and their sustained use. The information that is available is fragmented and cannot easily be
40
verified. Therefore, attempts to achieve universal access to adequate and equitable safely managed
41
sanitation by 2030 might be derailed by a lack of reliable data needed to organize and design targeted
42
interventions. Often the data being gathered by local authorities are presented only to show overall
43
success but not where bottlenecks exist. This is mainly due to techniques of data collection and the
44
local officials’ vested interest of only showing improvement in overall sanitation coverage. The local
45
authorities focus on collecting information about absence or presence of a toilet (user interface i.e. the
46
superstructure slab and pan), or the visible aspect, with no detailed information on the type of
47
containment (storage) or what happens downstream in the sanitation service chain. As a result, there
48
is a dearth of well-disaggregated sanitation data that can be used to inform the design of targeted
49
interventions needed to make progress towards achieving the SDG target of universal access to safely
50
managed sanitation across the country.
51
This study was designed to provide evidence-based findings that will facilitate the planning and
52
selection of viable intervention options for improved management of the entire sanitation service
53
chain in a small town of Tanzania. The study is based on the mapping of sanitation facilities in eight
54
wards of the Babati Town Council, Tanzania. A simple mobile phone survey tool was developed and
55
used to collect data on access to sanitation services in the town. To track the country progress towards
56
the SDG sanitation goal, the Ministry of Health is implementing the National Sanitation Campaign
57
(NSC). The ministry has developed a registry system that is being used by local government health
58
officers to collect sanitation data in the area of jurisdictions. By comparing the two methodologies of
59
sanitation data collection and mapping, we aim to identify the disparities in data reliability and
60
validity, and to unveil what really counts towards achieving SDGs relating to sanitation
61
62
The challenges in data collection together with the differences in classification of sanitation
63
facilities means that reports of success or failure cannot be compared across nations, and sometimes
64
across towns. The key question remains therefore, what proportion of safely managed sanitation
65
counts? Our attempt to find an answer to this question prompted us to develop a survey tool for use
66
in the freely available tool and software, Open Data Kit (ODK), installed on an android smartphone.
67
We engaged local government health and executive officers to carry out the data collection exercises
68
in their areas of jurisdiction within the Babati Town Council. The ODK software allows for the storage
69
of big data sets that can be easily aggregated/consolidated and retrieved for analysis, and easily
70
accessible for independent verification. By collecting information throughout the sanitation service
71
chain, the survey offers an opportunity for disaggregation of access to sanitation and for setting a
72
realistic and verifiable baseline information. Although our efforts in one town may not be conducive
73
to generalization, the development of a smartphone-based tool to generate easily verifiable data is a
74
major contribution of this of this study. We show how a simple mapping tool (using open source
75
software and cheap smartphones) and engaging town council staff to collect data can lead to the
76
collection of reliable sanitation data and contribute to tracking progress towards the SDG targets.
77
Integrating this tool into national campaigns, such as the National Sanitation Campaign (NSC) of
78
Tanzania, can help in tracking progress towards the SDG targets. This technique coupled with
79
growing mobile network coverage and lower costs of smartphones and internet connection provides
80
opportunity for governments to collect and aggregate reliable and verifiable sanitation data at a
81
relatively low cost.
82
83
2. Review of key concepts and definitions on safely managed sanitation
84
During the Millennium Development Goals (MDGs) era (1990 – 2015), progress towards meeting
86
the sanitation target was initially monitored using the binary category of either improved or
87
unimproved facilities [4]. According to the MDG definition, an improved sanitation facility separates
88
human excreta from human contact. The unimproved, which includes shared sanitation facilities on
89
the other hand, comprises of facilities that were considered to put users at risk of being in contact
90
with human excreta [4]. The binary approach was later modified to a service ladder comprising three
91
rungs: unimproved, shared, and improved sanitation. Yet in this new classification, the focus
92
remained more strongly on technology types. Improved sanitation includes facilities that were
93
connected to sewer, septic tank systems, pour-flush latrines, ventilated improved pit and simple pit
94
latrines. Public sanitation facilities were categorized as shared and unimproved, and included open
95
pit latrines and bucket latrines.
96
However, the technology-based categorization of sanitation services has been critiqued as being
97
biased towards some of the technologies. For instance, promoters of composting and urine-diverting
98
toilets which were not in the list felt excluded [5]. The Joint Monitoring Program (JMP) have since
99
refined the sanitation classification and adopted a modified version of the sanitation ladder to
100
monitor and report progress towards the SDG 6.2 [4]. Presently, SDG 6.2 uses normative definition
101
of sanitation targets and indicators, putting emphasis on the proportion of the population using a
102
safely managed sanitation service. Improved sanitation facilities include flush/pour flush to piped
103
sewer, septic tank or pit latrine; composting toilet or pit latrine with slab. Safely managed sanitation
104
is defined as “the use of improved sanitation facilities which are not shared with other households,
105
where excreta are safely disposed in situ or temporarily stored then emptied, transported and treated
106
off-site or transported through sewers to a wastewater treatment facility”. Safely managed sanitation
107
is a new addition, at the top level of the JMP sanitation service ladder (see the representation in Figure
108
1). As one moves from left to right on the sanitation axis (x-axis), the costs and level of service also
109
increases for households.
110
111
Figure 1: Joint Monitoring Program sanitation service ladder
112
113
In addition, for monitoring progress towards the SDG, the JMP sanitation ladder has been
114
modified to include: no service (open defecation), unimproved service, limited service, basic service,
115
excreta on fields, forest, bushes, open bodies of water, beaches or other open spaces or with solid
117
waste. Unimproved refers to the use of pit latrines without a slab or platform, hanging latrines and
118
buckets. Limited is when improved sanitation facility is shared by two or more households. Basic
119
service on other hand is the use of improved facilities that are not shared by other households. Safely
120
managed which sits at the top of the ladder indicates the use of improved facilities that are not shared
121
with other households and where excreta are safely disposed in-situ or transported and treated
off-122
site (see SDG 6.2).
123
Based on the above definitions of different service levels under SDG 6.2, it is important to focus
124
the debate on what type of sanitation technologies are included in the different service levels. Some
125
scholars argue that monitoring types of technologies defined as improved is an imprecise proxy for
126
the quality of the services [2]. According to Kvarnström et al. [5] and Mara [6], a function-based
127
sanitation ladder is a more appropriate way of measuring and monitoring success. The classification
128
of shared sanitation used by more than one household as limited has also sparked a lot of debate. The
129
main JMP argument for excluding shared sanitation facilities in the improved category is that it
130
increases the risk of adverse public health outcomes. Arguably, households relying on shared
131
sanitation are more prone to acute diarrhoea, helminths, etc. [7]. However, other scholars argue that
132
the evidence on health challenges associated with shared sanitation is weak due to many reasons: the
133
diverse typologies of shared sanitation facilities; uncertain methodologies often used for measuring
134
health risks; and lack of evidence regarding actual latrine use, distance, waiting time, and cost. Also
135
that there are major differences in many study designs that limit comparability between cases [7].
136
According to Evans et al. [8] and Mara [6], the classification of shared sanitation as limited is
137
also a disincentive for public investment in unplanned areas or slum sanitation. Feasible sanitation
138
investment in such areas is likely to be related to improving or building new shared facilities which
139
will not be counted as progress towards the safely managed sanitation target of the SDG [8]. As a
140
result, more public attention is now geared towards Faecal Sludge Management (FSM) and sewer
141
networks that only benefit planned areas and more affluent urban communities. Focusing on
142
technologies appropriate only in planned and more affluent areas risks creating or reproducing
143
inequalities in sanitation service provision, which is contrary to the SDG human right principle of
144
leaving no one behind. Therefore, we argue that safely managed sanitation should only serve as an
145
ideal standard that every country or town should aspire to, but shall not side-track policy makers
146
from the provision of sanitation services that allows households to put their feet on the first rung of
147
the sanitation ladder to reduce access inequality [8].
148
In addition to the types of sanitation facilities, the SDG sanitation service ladder requires a shift
149
in the way progress was being monitored and reported by the JMP. The new service ladder allows
150
for a disaggregated analysis of the sanitation services being provided. Although the use of
151
representative samples to measure access has been questioned, long term monitoring data collected
152
for the MDG through the national census, national demographic health surveys (DHS), and UNICEF
153
multiple indicator cluster surveys (MICS) studies are available to track the first three rungs of the
154
service ladder (unimproved, limited, basic). Yet, at a country level, the classification of sanitation
155
services is sometimes quite differently from those used by the JMP, which brings complication in the
156
calculation of the global statistics. For instance, in Tanzania, sanitation facilities are classified as
157
unimproved, improved, basic, or safely managed. Where improved sanitation facilities include any
158
non-shared toilet of the following types: flush/pour flush toilets to piped sewer systems, septic tanks,
159
and pit latrines; ventilated improved pit (VIP) latrines; pit latrines with slabs; and composting toilets
160
[9].
161
162
3. Materials and Methods
163
The study was conducted in Babati Town, located in Manyara Region, Northern Tanzania. The
165
town is situated at about 168 kilometres south of Arusha city and 700 kilometres from Dar es Salaam.
166
Babati Town is located at the northern end of Lake Babati catchment area, a tourist hotspot. Babati
167
Town covers an approximate area of 460.86 km2 (Figure 2). The town was upgraded and accredited
168
with town council status in 2014 following the division of Arusha region into the two regions of
169
Manyara and Arusha. The secession of Manyara from Arusha region compelled the central
170
government to upgrade at least one area in the newly established Manyara region to township status
171
to become a regional headquarter. Administratively, Babati Town has eight wards comprising of 36
172
streets (urban area) and 13 villages (peri-urban area), with a total population of approximately 93,108
173
residents (NBS, 2012).
174
175
Figure 2: Babati town council administrative boundary
176
Babati Town’s population growth is estimated at 3.2% per year (above the national average),
177
which means currently the town population could have reached about 108,990 individuals. The
178
decision of the Tanzanian Government in 2015 to move government offices and ministries from Dar
179
es Salaam to Dodoma, positioned Babati Town as a central place for people travelling to the capital
180
from Tanga, Kilimanjaro and Arusha regions, which are in the northern part of the country. This
181
stimulates growth of business such as hotels, lodges and street vendors (machinga). The population
182
growth and business development however also come with increased production of faecal and solid
183
wastes in the town.
184
185
3.2 Data collection method
186
This study used a survey methodology with a research design aimed at obtaining an overall
187
picture of the sanitation situation in the small town. It employed both quantitative and qualitative
188
methods to collect sanitation information along the service chain. The study target was to reach every
189
housing units in Babati Town (total enumeration) but it managed to collect information from 17,383
190
Ethical approval was obtained for this research from the National Institute for Medical Research
192
(NIMR) in Tanzania. The term housing unit is used here to signify that not all visited homes were for
193
domestic dwelling but also that one sanitation facility may be used by two or more households (e.g.
194
housing complexes developed for renting). The discrepancy between housing units visited for data
195
collection and estimated number of households in Babati may also be due to the fact that i) there is
196
no updated list/number of dwellings in Babati; ii) some dwellings were not occupied at the time of
197
this research; and iii) security restrictions exist for some housing for police and prisons staff quarters.
198
A structured questionnaire was developed in XLSForm format and the converted to Open Data Kit
199
(ODK) XForm for use on android-based smartphones and tablets. The ODK software and step by
200
guide on how to develop tool is available for free online (http://xlsform.org/en/) but our questionnaire
201
tool used in this study can be provided to anyone needing it upon request to the lead author. The
202
survey collected data included GIS location, ward, street, gender of owner, education of owner, user
203
interface, containment, year of construction, number of users, sanitation outlet, emptying mechanism
204
and open defecation etc. Local government officials working at the ward and street/village level,
205
whose job responsibilities also include collection of sanitation data, were trained on how to use the
206
data collection tools. This was in the form of a two-day training conducted to agree on common
207
terminologies used to identify different components of the sanitation services chain and to reduce
208
errors. A practical field survey was also conducted to test the functioning of the survey tools outside
209
the study area.
210
In total 56 local government officials were involved in the data collection, visiting about 20 to
211
100 dwellings per day depending on the terrain and distance between housing units. In each housing
212
unit, the sanitation facility (user interface and visible parts of the containment) was geo-referenced
213
and photographed using the Geographical Positioning System (GPS) and camera embedded on the
214
smartphones or tablets. The tools were programmed to automatically save the GPS readings when
215
the accuracy is within zero to four meters. The survey questionnaire was also programmed in such a
216
way that the enumerators could move to the next question only when the current active cell was filled
217
with valid information. Respondents were residents of the dwellings who were above 18 years of age,
218
knowledgeable with the dwelling sanitation design, construction, use and management. In the case
219
where a respondent was not certain of some of their responses, phone calls were made to other
220
residents of the dwelling for clarification.
221
The use of local officials who have the responsibility to collect sanitation data and also have legal
222
access and power to inspect dwellings in the areas of their jurisdiction increased the study potential
223
to reach almost all of the dwellings in the town. Since the study was action research, involving the
224
local authorities was a critical component as well as strengthening their capacity in generating high
225
quality data needed for making decisions on sanitation services.. Our aim was to strengthen existing
226
personnel and systems that will remain in place for the long term, to both ensure sustainability and
227
increase data reliability and quality. In terms of training of officials on how to appropriately engage
228
with households, we note that it is important to work with the local leaders (street chairmen and ten
229
house cell leaders) to build trust of the community on the process. The GPS records and photo
230
reduced the chances of those whose sanitation facilities or practices were not legal to withhold
231
information. It also closed loopholes for enumerators (who are supposed to have sanitation data in
232
their offices) to duplicate shelved information or fill the questionnaire from their offices. In-depth
233
interviews and stakeholders’ meetings were conducted to validate data from the sanitation mapping.
234
Respondents for in-depth interviews included Babati Town Council (BTC) and Babati Water and
235
Sanitation Authority (BAWASA) staff, selected residents, and all enumerators involved in the data
236
collection. The interview was used to validate household survey data especially on issues such as
237
open defecation, lack of toilets and “vomiting of toilets”. Vomiting of toilets” is the practice of digging
238
a hole next to a full pit latrine and diverting the sludge to this hole. Respondents were from
239
individuals with a wide knowledge of the town, sanitation service providers or regulators. This
240
helped the study to have a complete and accurate picture of the types of toilets existing across Babati
241
243
3.3 Data management and analysis
244
In total 17,384 settlements were surveyed and mapped. Data collected was imported into
245
Microsoft Excel and cleaned to generate sanitation maps and descriptive statistics. Excel pivot tables
246
were used to group and compare the data on various types of sanitation interfaces, containment,
247
outlet, emptying, transport and treatment. The QGIS 3.8.1 'Zanzibar' was used to visualize and
248
analyse the spatial configuration of the sanitation facilities in Babati Town. Qualitative information
249
from in-depth interviews were grouped into themes following their similarities or differences to
250
support and qualify quantitative information.
251
252
4. Results
253
4.1 Settlement descriptive statistics
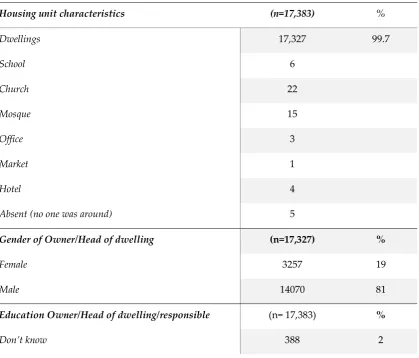
254
Out of the 17,383 housing units surveyed, 56 were offices, hotels, churches, and mosques among
255
others (Table 1). Based on the survey, a total 109,397 people were reported as accessing sanitation
256
from the mapped 17,383 housing units. The majority (71%) of housing units were owned or under
257
the care of individuals with primary level education (81% male and 19% female). Overall, 82% of the
258
housing units had some form of sanitation facility.
259
260
Table 2. Statistics of housing units surveyed in Babati Town Council
261
Housing unit characteristics (n=17,383) %
Dwellings 17,327 99.7
School 6
Church 22
Mosque 15
Office 3
Market 1
Hotel 4
Absent (no one was around) 5
Gender of Owner/Head of dwelling (n=17,327) %
Female 3257 19
Male 14070 81
Education Owner/Head of dwelling/responsible (n= 17,383) %
262
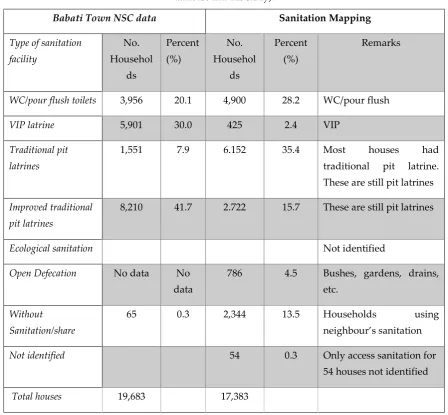
4.2 Distribution of sanitation technology types
263
In this section, the sanitation data presented are from the National Sanitation Campaign (NSC)
264
and this study’s sanitation mapping exercise. The two data sets were collected by the same local
265
government officials but using different tools. Based on the 2017 Babati Town NSC data, only 0.3%
266
of the dwellings did not have sanitation facilities, 7.9% had traditional latrines, and most of the
267
households were reported to have improved latrines (Table 2). Traditional latrines are categorized as
268
unimproved because they are almost all dilapidated, normally built of a few wooden poles, grass,
269
cloth or plastic materials. The pits are less than four meters deep; the floors are not well covered and
270
faecal matter can easily be seen. The idea that most households are using improved sanitation of some
271
kind has made the town authority to start planning for the town sewer network and treatment
272
lagoons. When Babati Town NSC data are converted to the categories of the JMP sanitation ladder, it
273
shows that 49.6% of the dwellings are using pit latrines (improved and unimproved, and 30.0% have
274
VIP latrines. Also, only 20.1% of the sanitation facilities in Babati Town can be classified as flush
275
latrines of all types. Since no information is collected on the containment, emptying, and treatment
276
the NSC data cannot be used to compute the proportion accessing safely managed sanitation in the
277
town. However, the user data from this study indicates that about 35.4% of the houses have
278
traditional latrines, 15.7% uses improved pit latrines, 28.2% uses flush latrines of all types, 2.4% have
279
VIP latrines and 4.5% practice open defecation (Table 2).
280
281
No formal education 1,534 9
Primary education 12,319 71
Secondary education 2,299 15
Tertiary education 843 5
Age of Owner/Head of dwelling/responsible (n=17,383) %
Unknown 244 1
18 – 21 231 1
21 – 30 1927 11
31 – 40 4532 26
41 – 50 4485 26
51 – 60 3064 18
Above 60 2900 17
Housing unit with sanitation (n=17,383) %
Yes 14,199 82
Table 2. Distribution of sanitation facilities as per the JMP sanitation service ladder (source: NSC
282
database and this study).
283
Babati Town NSC data Sanitation Mapping
Type of sanitation facility
No. Househol
ds
Percent (%)
No. Househol
ds
Percent (%)
Remarks
WC/pour flush toilets 3,956 20.1 4,900 28.2 WC/pour flush
VIP latrine 5,901 30.0 425 2.4 VIP
Traditional pit latrines
1,551 7.9 6.152 35.4 Most houses had
traditional pit latrine. These are still pit latrines
Improved traditional pit latrines
8,210 41.7 2.722 15.7 These are still pit latrines
Ecological sanitation Not identified
Open Defecation No data No data
786 4.5 Bushes, gardens, drains, etc.
Without Sanitation/share
65 0.3 2,344 13.5 Households using
neighbour’s sanitation
Not identified 54 0.3 Only access sanitation for
54 houses not identified
Total houses 19,683 17,383
284
There is a great difference in the VIP data (30% in the NSC and 2.4% from the survey). This is
285
likely because of the difficulties of identifying ventilated improved latrines faced by the health
286
officers and data collectors for the NSC registry. Before training, we noted that all ward health officers
287
were unable to correctly identify the different sanitation user interfaces. For instance, one health
288
officer had his definition of traditional sanitation as “choo cha muda” meaning short term use latrine.
289
It is therefore possible that after proper training coupled with practical field visits, the local
290
authorities engaged were more likely to correctly distinguish VIP latrines from the other types of
291
facilities.
292
Further analysis of the 14,199 housing units with some forms of sanitation revealed that 10% of
293
the containment is of septic tanks, and 7% sealed tanks, while 20% were properly covered and then
294
abandoned when full (Table 3). However, only 1% of sanitation containment are reported is emptied
295
when full, but the emptied the sludge is either disposed onsite or transported to open land dedicated
296
for faecal sludge discharge by the town authority. The site is close to cultivated food crops. About
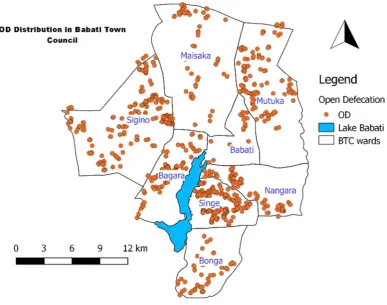
297
4.5% of the housing units practice open defecation (calculated based on the average number of users
298
per housing unit size of about 7.7 this is roughly about 6,000 people). Open defecation was not
299
reported in the NSC data but from this study, it is practiced in all 8 wards of the town (Figure 3),
300
Table 3. Types of sanitation containment
302
Containment type Number Percent (%)
Septic tank 1,451 10.2
Sealed tank 988 7.0
Lined pit but open bottom 483 3.4
Lined pit but semi-permeable walls and open bottom 2,487 17.5
Unlined pit 5,765 40.6
Pit, properly abandoned when full /properly abandoned 2,991 21.1
Don’t know 34 0.2
Total 14,199 100.0
303
From the study 80% of the containment were reported not yet full or has never gotten full since
304
construction, about 18% is not emptied, only 1% of the containments are emptied and another 1% not
305
known.
306
307
Figure 3. Distribution of households practicing open defecation in Babati Town
308
From the data collected during this study it is possible to prepare maps of distribution of types
309
of sanitation user interfaces and containments. To show that Babati is not ready for a central sewer
310
inform the town sanitation planning process which was being carried by a consultant hired by the
312
authority. The classified map was also used during the sanitation scenario planning exercise. As a
313
result, the local authority has selected to implement faecal sludge management in the town, and a
314
consultant will be hired to develop the business plan.
315
316
Figure 4. Distribution of dry and wet sanitation in Babati town council
317
4.3 Access to safely managed sanitation in Babati town
318
To estimate the proportion of safely managed sanitation in Babati town, we used the faecal waste
319
flow diagram methodology. The faecal waste flow diagram popular known as Shit Flow Diagram
320
methodology (SFD) is an approach that graphically visualizes the efficiency of faecal sludge
321
management of an area [10]. It is a useful approach for tracing the flow path of human excreta along
322
the sanitation service chain: containment, emptying, transport, treatment, and final disposal or reuse.
323
From the survey data, the proportion of households having access to different sanitation
324
containment is summarized in the SFD matrix (Table 4). The proportion for each type was derived
325
by counting the containment falling in each category. As shown in Table 4 there are also septic tanks,
326
or pour flush connected to soak pits or pit latrines with high risk of groundwater contamination. The
327
following assumptions were made to develop the SFD for the town:
328
a) Assumed that 50% of pits/tanks are in areas with high risk of groundwater contamination.
329
b) Assumed 10% of sealed tanks, pits, septic tanks are being emptied.
330
c) Visual inspection of locations of each sanitation categories on the groundwater contour
331
maps, location of 435 deep and shallow wells constructed by the households [11].
332
d) Assumed that open defecation derived from housing units is the same when converted to
333
proportion of the town population practicing open defecation.
334
The assumptions were validated through field visits to public and private toilets, interviewing
336
households having shallow wells, and review of findings from a groundwater contamination study
337
carried out in the town [11]. There is no central sewerage network or central treatment plant in BTC
338
but only a dedicated place where faecal sludge is discharged by vacuum trucks. In terms of open
339
defecation, we rounded to 5% the population that still practice open defecation.
340
The risk of groundwater pollution can be estimated from data on drinking water from
341
groundwater sources, hydrogeology and the distance between groundwater sources and sanitation
342
facilities (as indicated in assumption ‘c’ above). The risk assessment tool from the SFD Graphic
343
Generator guides the user to select the appropriate sanitation option in the selection grid (either
344
located in low or high-risk areas of groundwater pollution). Both assumption “a” (50% of pits/tanks
345
are in areas with high risk of groundwater contamination) and the visual assessment of wells from
346
the study carried out in the town on groundwater contamination [11] were used in developing the
347
SFD graphic to show the risk of groundwater pollution.
348
349
Table 4: Estimates of Sanitation Containment Matrix for faecal sludge flow diagram
350
Containment type Estimated proportion of
population using this type
Estimated proportion of this type that is
emptied
Septic tank with soak pit 8 10
Sealed tank with soak pit 12 10
Lined pit, open walls and bottom but no overflow
11 10
Unlined pits, no overflow 15 10
Open defecation 5
Pit of all types, never emptied but abandoned and covered with soil no overflow
3
Septic tank connected to soak pit but with high groundwater risk
7 10
Sealed tank connected to soak pit but with high groundwater risk
11 10
Lined pit, open walls and bottom but with high groundwater risk
11 10
Pit of all types, never emptied but with high groundwater risk
3
351
Using the matrix in table 4, we developed the Babati Town Shit Flow Diagram (SFD). It shows that,
352
although sanitation coverage in Babati Town is high (e.g. about 82% of the housing units had some
353
form of sanitation); only 31% of the faecal sludge currently produced is safely contained on site, not
354
emptied (i.e. safely managed), while about 69% is not contained (Figure 5). Out of the 69%, about 1%
355
of the faecal sludge is emptied but it is discharged untreated, while 64% is not contained on site and
356
5% is open defecation. The NSC classification only focuses on the user interface where investment is
357
done by dwelling owners, the information cannot be used directly to develop the faecal sludge flow
358
diagram. Although the concerted efforts being made through the Tanzania Nation Sanitation
359
Campaign is allowing households to put their feet on the first rung of the sanitation ladder, which
360
reduces access inequality [8], it is not possible to determine the proportion of safely managed
361
sanitation in the town. The faecal waste flow diagram for Babati was used to change the mindset of
362
the local authority and made them select faecal sludge management as the best option for the town
363
in the short to medium term.
364
Figure 5: Babati Town faecal sludge flow diagram
365
366
4.4 Disparities between reported NSC data and sanitation mapping exercise
367
The rapid ‘urbanisation’ of Babati Town, makes it an interesting and peculiar case for
368
understanding and disaggregating access to safely managed sanitation in emerging towns in the
369
countries of the global south such as Tanzania.
370
This town-wide sanitation mapping study reveals large disparities between the data collected in
371
this study compared with the sanitation data reported by local authorities. It was revealed that the
372
methodology we have adopted in this study produces more information than the routinely used NSC
373
registry-based methodology. The officers who were involved during the data collection are
374
sanitation facilities. The town-wide sanitation mapping exercise has uncovered that the local
376
authority’s methods, tools/technology, type of data collectors and categories used to define and
377
collect sanitation data are not robust and have some limitations. The reports are based on data
378
collected through paper-based surveys with no clear methods for data verification. In 2017, the Babati
379
Town NSC data show that 50.4% of households have improved sanitation facilities, about 9% of the
380
households have hand-washing facilities, and five streets/villages have full sanitation coverage.
381
However, through this study, where all data points were georeferenced and photographed, the
382
number of households with improved sanitation facilities is less than half of what is in the Babati
383
Town’s NSC database, for instance, open defecation is practiced in all wards.
384
385
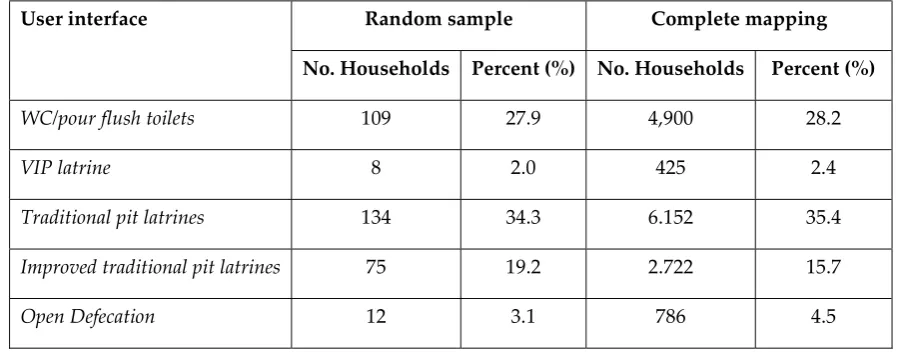
4.5 The potential for replication of this study methods
386
In this study we surveyed the whole town, something which is not possible to accomplish in
387
large cities. To promote comprehensive survey of sanitation service chain, it would be good to know
388
what kind of sampling could be applicable for large urban towns. We tested the potential of
389
systematic random sampling of housing units in a town for sanitation mapping. The sampling
390
strategy we used to get the number of housing units for further analysis was calculated based on the
391
following formula [12]:
392
Sample size, 𝑛 =
( ) (1)
393
Whereby ‘e’ is the level of precision (%), ‘N’ is the total number of housing units, and ‘n’ is the
394
sample size for survey. A precision level of 5% was selected in order to get optimal sample size
395
(recommended ‘e’ is between 5% and 10%) [13]. The sample size for a town with 17,383 housing units
396
is then 391 units. To get the housing list, a unique code was assigned to the full list of housing units
397
(17,383) in Excel. Then in an empty column the formula "=rand ()" was used to generate a random
398
number for each data point. The data table was then sorted in ascending order on basis of the random
399
numbers. The randomized order was used to select the first 391 housing units for analysis. Table 5
400
and 6 shows that it is enough to use a representative sample to estimate sanitation user interface
401
coverage, the percentage for the different categories are nearly the same. Critical to the use of
402
representative sample is of course the local capacity to generate an accurate list of housing units
403
within an area. Once the survey tool is designed to capture information on user interface,
404
containment, emptying, treatment and final disposal or reuse and budget is allocated, it is possible
405
to realistically estimate the proportion of access to safe sanitation that counts.
406
Table 5. Comparison of sanitation user interface
407
User interface Random sample Complete mapping
No. Households Percent (%) No. Households Percent (%)
WC/pour flush toilets 109 27.9 4,900 28.2
VIP latrine 8 2.0 425 2.4
Traditional pit latrines 134 34.3 6.152 35.4
Improved traditional pit latrines 75 19.2 2.722 15.7
Share 52 13.3 2,344 13.5
Not identified 1 0.3 54 0.3
Total (households) 391 100 17,383 100
Table 6. Comparison of sanitation of containment
408
Containment type Random
sample
Percent (%)
No. full mapping
Percent (%)
Septic tank 29 8.9 1,451 10.2
Sealed tank 36 11.0 988 7.0
Lined pit but open bottom 3 0.9 483 3.4
Lined pit but semi-permeable walls and open bottom
60 18.4 2,487 17.5
Unlined pit 120 36.8 5,765 40.6
Pit, properly abandoned when full /properly abandoned
78 23.9 2,991 21.1
Don’t know 29 8.9 34 0.2
Total 391 14,199
5. Discussion
409
In Babati, the consensus had been that sanitation coverage is over 90%, meaning that the
410
authorities are only dealing with the “last mile”, basically that eliminating open defecation in the
411
town can now be achieved. From our total sanitation mapping in Babati Town, most user interfaces
412
are connected to containment systems that are rarely, if ever, emptied. Most users reported that they
413
will simply construct a new pit once the old ones are full and that open defecation is practiced
414
throughout the town. Building a new pit when one is full is of course only a short-term solution, it is
415
not a sustainable at the city level, eventually, there will be no more space available to keep building
416
new pits in the future. In Babati Town, as in other towns and cities in Tanzania, limited data are being
417
generated on the entire sanitation service chain. We can state that the current focus on user interfaces
418
may be leading local authorities and the government into counting and using incomplete data on
419
safely managed sanitation service provision.
420
The observed large proportion of user interface and containment types on the lower rungs of the
421
JMP sanitation ladder could also be attributed to the priorities of the National Sanitation Campaign
422
(NSC) that is being carried out in Babati Town council. The NSC registry captures five types of user
423
interfaces; traditional pit latrine, improved traditional pit latrine, VIP, pour flush, WC flush and no
424
sanitation or whether faeces are visible around the household surroundings. The focus, therefore, is
425
only on ensuring that people have some form of sanitation that can be measured and without
426
considering the entire service chain. By focusing only on the user interface, the authority may be over
427
counting the number of people with access to safely managed sanitation services in the town. This is
428
because any form of pour flush sanitation facility is automatically considered an improved sanitation
429
The other challenge for small towns is how upgrading to a town’s status also impacts on the way
431
sanitation is seen by the new town authorities. In the case of Babati, the process did not follow steps
432
stipulated in the local government act/regulation where a rural area shall first be upgraded to a
433
trading centre, a small-town authority and thereafter become a town or city. The bureaucratic growth
434
process to some extent provides space for development of infrastructure needed to cope with the
435
socio-economic services needs of a town setting, and for people to change their mind-set through
436
social learning and invest in safe sanitation. As a result, Babati Town has grown to have diverse
437
sanitation types, with a large proportion of dwellings having no access to safely managed sanitation.
438
Taking into consideration the fact that SDG pledges to “leave no one behind” specifically in goals 6.1
439
and 6.2 on universal access to sanitation; it becomes apparent that Babati Town’s attempts at
440
achieving these goals would need extra effort. This is a challenge because moving up the ladder from
441
the lowest possible sanitation type is a slow process [14]. In addition, about 14% of households in
442
Babati Town are dependent on their neighbour’s sanitation facilities. Although, this type of access to
443
sanitation can be categorized as neighbour-shared access and improved [crf: 15]. Further scrutiny of
444
access to shared facilities between neighbours at late night hours, when owners are not present at the
445
dwelling or when considering issues of cleanness and proper use [14], reveals how complex the
446
situation is and open defecation might become inevitable.
447
The disparities between sanitation data reported by local authorities and those revealed by this
448
town-wide sanitation mapping study, demonstrate a major challenge for poor countries to achieve
449
the SDG target on sanitation. The town-wide mapping exercise has uncovered that local authority’s
450
methods, tools/technology, type of data collected, or categories used to define and collect sanitation
451
data are not robust and have limitations. Babati Town’s NSC report, for example, indicates that five
452
streets/village have full sanitation coverage, implying zero open defecation in some streets/villages.
453
However, this is contrary to the data collected using a digitized method, where GPS points and
454
photos were recorded. Both sets of data were collected by the local authority’s officers including the
455
wards / streets executives, health officers and community development officers. Despite the same
456
local officers getting involved in the two different exercises, the data generated are different. The
457
differences come from the method of data collection used such as manual filling of forms in the NSC
458
study versus the use of a mobile phone-based survey tool. The NSC data are collected by enumerators
459
under the supervision of village or ward health officials who have limited budget allocated to
460
facilitate their work. In some cases, this lack of budget may lead to lower motivation levels to collect
461
the data. In other cases, the officers may also have vested interest to report improvement. The
462
problem is compounded by the fact that there are no clear methods used by the authorities for data
463
verification. One critical challenge for NSC data validation is lack of money. It cost about USD500 per
464
year to print NSC registry books for small town like Babati (personal communication). The annual
465
budget designated for sanitation mapping per town varies from USD 6,000 to USD 15,000 out of
466
which only about USD 2,000 – 5,000 may be allocated for the NSC survey. About USD 13,000 is
467
required to collect data from 17,383 housing units, this is roughly paying USD 8-10 per day to each
468
enumerator. However, the local authority usually pays USD 4 per day to their enumerators, which is
469
comparatively low. It is still possible however to use the same NSC resources to conduct
470
comprehensive sanitation surveys. The methodology used in this study can be made reasonably
471
cheap and easily scalable to other cities with different sanitation options especially if a careful random
472
selection is done.
473
Moreover, apart from issues of tools and human biases, categories used to define sanitation
474
facilities are important. The Shit Flow Diagram (SFD) generated using the town-wide sanitation
475
mapping exercise, reveals that currently the local authorities are not considering the proportion of
476
safely managed sanitation. The main questions any sanitation intervention must strive to answer,
477
therefore, are: what is the basis for lumping certain types of sanitation facilities into a certain
478
sanitation category? Does the category clearly reflect the full sanitation service chain? The NSC
479
classification, for example, groups sanitation facilities into five categories, namely unimproved
480
toilets. These categories do not portray any information about the containment type, and do not
482
disaggregate access through the sanitation service chain. The NSC emphasis is on the ‘political face’
483
of sanitation service, the user interface, where users can easily associate the health risks to the direct
484
human contact with excreta. It is important, therefore, to focus on understanding what proportion of
485
safely managed sanitation counts, or, simply, what benefits, success and or failure is defined or
486
embroiled in the sanitation categories. Nevertheless, it is not only the proportion of safely managed
487
excreta that is important, but also good to know if the sanitation service delivery in town is
488
sustainable in medium to long term circumstances. Building a new pit when the old one gets full may
489
not be a sustainable solution for households even if the faecal sludge is safely contained on site.
490
Similarly, the SDGs and the shift towards considering the full sanitation chain are still quite
491
recent – and so governments have yet to catch up. This necessitates the need for sanitation
492
interventions such as the NSC to break away from old thinking and approaches that employed
493
politically motivated sanitation categories, where governments focused on implementing policies or
494
projects to fit their political agenda and claim political credits. The NSC categories seem to
495
intentionally or unintentionally overlook real problems, in this case, potential groundwater
496
contamination [11, 16], by selecting interventions that would have very limited or no budgetary
497
pressure on the government. The focus on intervention at user interface where investments are
498
largely the responsibility of a dwelling’s owner, allows local authorities to excuse themselves from
499
their key role as the providers for public services. In addition, without aggregating the data
500
throughout the sanitation service chain it will be difficult for the local authority to measure real
501
progress or for residents to hold them accountable. Clear descriptions of sanitation categories are an
502
important entry point for planning interventions to reduce or eliminate sanitation related challenges
503
such as faecal contamination of underground water used by poorer urban households and WASH
504
associated diseases. This, together with increased capacity for data collection, consolidation, analysis
505
and interpretation will facilitate government to track inequalities in safely managed sanitation.
506
Additional work is required to understand the relationship between inequalities in different elements
507
of safely managed services, so that these can be more systematically monitored in future reports for
508
growing small towns such as Babati.
509
For the sake of discussion, there is room for cost saving (money and time) when a clear sampling
510
strategy is applied using an accurate list of housing units within an area. For the National Sanitation
511
Campaign, the local authority currently collects data on a quarterly basis with the objective of
512
reaching every household at the end of the year. As stated above, selecting good sample size can
513
produce the same result and track progress of a community as a whole. However, it may not be seen
514
by the local authority as an appropriate method for monitoring the progress of each household along
515
the sanitation ladder. These would be important discussions to hold with the government authorities
516
if they were to consider scaling up the use of this data collection technique.
517
518
5.1 Limitations and implications
519
The main limitation for this study was the tension of BTC being a project partner and at the same
520
time a regulator of the sanitation sector in the town. The latter made people who did not have toilets
521
to disappear during the visit or quickly build new toilets after getting information about our survey
522
from friends or relatives. Data on the numbers of respondents who did not agree to answer the survey
523
or that built new toilets are not reported in this paper. This challenge was minimized by training
524
enumerators (the local government officers) not to punish people during the mapping exercise.
525
During the research, an effort was made to spread a message that build peoples’ confidence when
526
they are approached by enumerators. Also, a small number of toilets were not observable as they
527
were located inside bedrooms. Finally, mapping all the housing units in a town requires time and
528
financial resources for trainings, testing the survey tool and analysis of data for informed decision
529
This study design is somehow feasible (in terms of time and budget) for small towns like Babati, but
531
it is unlikely to be feasible for large cities, for instance a city of 4 million people such as Dar es Salaam
532
or even greater e.g. New Delhi or Mexico with over 20 million people. However, the local authorities
533
can still easily integrate the research methodology and the tool used in their data collection programs.
534
In Tanzania, NSC data are being collected on a quarterly basis by enumerators at the street level and
535
it is therefore possible for this tool to be integrated in their routines. At national level the approach
536
provides opportunity to engage in policy discussion around about monitoring and planning for
city-537
wide sanitation services.
538
539
6. Conclusions
540
The commitment at the core of the SDGs to ‘leave no one behind’ is the most ambitious
541
commitment governments have made on access to sanitation to date. A key question going forward
542
is to understand what proportion of safely managed sanitation counts towards the SDG goal for
543
sanitation in a given country. As it stands now, the indicators and data used by JMP are based on
544
national and local records and databases, which are not consistent and are difficult to verify. Leaving
545
no one behind requires access to credible data and information. Lack of such valuable information
546
on sanitation leads to poor planning and prioritization of investment by local authorities. A small
547
town in Tanzania, just like many other small towns in the countries of the Global South, often dreams
548
of a network sewer with advanced wastewater treatment. Sewer systems are ideal for the protection
549
of groundwater, yet it is not often the right investment choice for small towns in low-income countries
550
in the short to medium term (10 – 20 years planning period), specifically given the low number of
551
sanitation facilities that could connect to a sewer system. In the short to medium term, small towns,
552
like Babati, should prioritize harmonization of sanitation designs, supervision of construction,
553
providing training to artisans, enforcement of sanitation bylaws and demarcation of clear areas for
554
future construction of sanitation infrastructure. The town’s authorities can also invest in a small
555
number of decentralized wastewater treatment systems. Adopting a phased approach towards
556
citywide sanitation services is the best option for small towns like Babati.
557
Our Babati study is likely one of the first comprehensive sanitation mapping carried out in
558
Tanzania. The data collected serves as baseline and can be used to develop a sustainable database for
559
sanitation improvement and contribute to appropriate urban planning for sanitation services. We
560
have shown how a simple mapping tool (using open source software and cheap smartphones) and
561
engaging town council staff to collect data can lead to the collection of reliable sanitation data.
562
Integrating this tool into national campaigns, such as the National Sanitation Campaign (NSC) of
563
Tanzania, can help in tracking progress towards the SDG targets. Moreover, the growing mobile
564
network coverage, and lower costs of smartphones and internet connection means that it is possible
565
for governments to collect and aggregate sanitation at a relatively low cost. However, we must note
566
that the politics of data and knowledge will always be an issue in reporting progress towards the
567
SDGs. The proportion of what is considered safe sanitation is likely to remain a subject of debate in
568
countries where these forms phone-based mapping results may contradict existing records. For the
569
local authorities, whatever happens after that is like the adage “out of sight, out of mind”. Yet,
570
sanitation is a public good with the health benefits to households are gained only when everyone has
571
access [17, 18].
572
573
Funding: This research was funded by UK Aid from the Department of International Development
574
(DFID) as part of the Sanitation and Hygiene Applied Research for Equity (SHARE) Research
575
Consortium (http://www.shareresearch.org).
576
Acknowledgments
578
This paper was made possible with UK Aid from the Department of International Development
579
(DFID) as part of the Sanitation and Hygiene Applied Research for Equity (SHARE) Research
580
Consortium (http://www.shareresearch.org). However, the views expressed do not necessarily
581
reflect the Department’s official policies.
582
Conflicts of Interest: The authors declare no conflict of interest. The funders had no role in the
583
design of the study; in the collection, analyses, or interpretation of data; in the writing of the
584
manuscript, or in the decision to publish the results.
585
References
586
1. United Nations General Assembly. Transforming our world: The 2030 agenda for
587
sustainable development. General Assembly 2015, 70 session, pp 18.
588
2. Hutton, G.; Chase, C. The knowledge base for achieving the sustainable development goal
589
targets on water supply, sanitation and hygiene. Int J Environ Res Public Health 2016, 13(6),
590
pp. e536.
591
3. World Health Organization (WHO); United Nations Children's Fund (UNICEF). Progress on
592
Drinking Water, Sanitation and Hygiene: 2017 Update and SDG Baselines. WHO and UNICEF: Geneva,
593
2017.
594
4. WHO; UNICEF. Progress on Drinking Water and Sanitation – Special Focus on Sanitation. WHO
595
and UNICEF: Geneva, 2008.
596
5. Kvarnström et al. The sanitation ladder – a need for a revamp? J Water Sanitation and
597
Hygiene for Development 2011. 1(1), pp. 3-12.
598
6. Mara, D. Sanitation: what’s the real problem? IDS Bulletin 2012, 43.
599
7. Heijnen et al. Shared Sanitation versus Individual Household Latrines: A Systematic
600
Review of Health Outcomes. PLOS ONE 2014, 9(4), pp. e93300.
601
8. Evans et al. Editorial: Limited services? The role of shared sanitation in the 2030 Agenda for
602
Sustainable Development. J of Water Sanitation and Hygiene for Development 2017.
603
9. Ministry of Health et al. Tanzania Demographic and Health Survey and Malaria Indicator
604
Survey 2015-2016. MoHCDGEC, MoH, NBS, OCGS, and ICF: Dar es Salaam, Tanzania, 2016.
605
10. Peal et al. Fecal sludge management (FSM): analytical tools for assessing FSM in cities. J of
606
Water, Sanitation and Hygiene for Development 2014, 4(3), pp. 371-383.
607
11. Pantaleo et al. Contamination of groundwater sources in emerging African towns: the case
608
of Babati town, Tanzania. Water Practice and Technology 2018. 13(4), pp. 980-990.
609
12. Kwiringir et al. Descending the sanitation ladder in urban Uganda: evidence from
610
Kampala Slums. BMC Public Health 2014, 14(1), pp. 624.
611
13. Heijnen et al. Neighbour-shared versus communal latrines in urban slums: A
cross-612
sectional study in Orissa, India exploring household demographics, accessibility, privacy,
613
use and cleanliness. Trans R Soc Trop Med Hyg 2015, 109, pp.690.
614
13. Turner, A.G. Sampling strategies.Handbook on designing of household sample surveys. United Nations
615
Statistics Division: Geneva, 2003.
616
14. Sorensenet al. Emerging contaminants in urban groundwater sources in Africa. Water
617
15. Batley, R.; McLoughlin; C. The Politics of Public Services: A Service Characteristics
619
Approach. World Development 2015, 74, pp. 275-285.
620
16. Cairncross, S. The public health benefits of urban sanitation in low and middle income
621
countries. Utilities Policy 2018, 51, pp. 82-88.